


Abstract
Fast ion pressure profiles flattened by multiple Alfvén eigenmodes (AEs) are investigated for various neutral beam deposition powers in a multi-phase simulation, which is a combination of classical simulation and hybrid simulation for energetic particles interacting with a magnetohydrodynamic fluid. Monotonic degradation of fast ion confinement and fast ion profile stiffness is found with increasing beam deposition power. The confinement degradation and profile stiffness are caused by a sudden increase in fast ion transport flux brought about by AEs for fast ion pressure gradients above a critical value. The critical pressure gradient and the corresponding beam deposition power depend on the radial location. The fast ion pressure gradient stays moderately above the critical value, and the profiles of the fast ion pressure and fast ion transport flux spread radially outward from the inner region, where the beam is injected. It is found that the square root of the MHD fluctuation energy is proportional to the beam deposition power. Analysis of the time evolutions of the fast ion energy flux profiles reveals that intermittent avalanches take place with contributions from the multiple eigenmodes. Surface of section plots demonstrate that the resonance overlap of multiple eigenmodes accounts for the sudden increase in fast ion transport with increasing beam power. The critical gradient and critical beam power for the profile stiffness are substantially higher than the marginal stability threshold.
Export citation and abstract BibTeX RIS
1. Introduction
Alfvén eigenmodes (AEs) are one of the major concerns of burning plasmas because they can transport energetic alpha particles and reduce the alpha heating efficiency leading to deterioration of the plasma performance [1–5]. Comparison among DIII-D experiments with different beam injection powers revealed the stiffness of the fast ion pressure profile with critical beam powers for sudden increase in fast ion transport flux [6]. In this paper, we regard fast ion profile as 'stiff' when the increase of the fast ion profile gradient above a critical value is lower than the proportional increase to the beam power. Critical gradient models based on linear stability analysis have been proposed for the prediction of the fast ion stiff profile [7, 8]. However, we would like to point out that the resonance overlap of multiple eigenmodes [9] can be another mechanism of critical gradient formation. What is important is that the degree of resonance overlap depends on the mode amplitudes. If the mode amplitudes are not large enough for the resonance overlap, the fast ion flux may not be able to keep the fast ion distribution close to the marginal stability where the fast ion drive is balanced with the intrinsic damping of the modes.
In DIII-D experiments, significant flattening of the fast ion profile was observed during Alfvén eigenmode (AE) activity [10–14]. In these experiments, a rich spectrum of toroidal Alfvén eigenmodes (TAEs) and reversed shear Alfvén eigenmodes (RSAEs) driven by ∼80 keV neutral beam injection is observed during the current ramp-up phase with reversed magnetic shear. Since the fast ion distribution in the DIII-D experiments is significantly affected by AEs, a comprehensive simulation, which deals with both the AEs and the fast ion transport as self-consistently and realistically as possible, yet is attainable on a tractable timescale, is needed. We have developed a multi-phase simulation, which is a combination of classical simulation and hybrid simulation for energetic particles interacting with an MHD fluid, in order to investigate a fast ion distribution formation process with beam injection, collisions, losses, and transport due to the AEs [15]. It was demonstrated with the multi-phase simulation of DIII-D discharge #142111 that the fast ion spatial profile is significantly flattened due to the interaction with the multiple AEs and that the fast ion pressure profile is in agreement with that of the experiment with the root-mean-square of the deviations equal to the error bar [16]. The predicted temperature fluctuation profiles of n = 3, 4, and 5 modes were quantitatively compared with ECE measurements, and it was found that the fluctuation profiles as well as phase profiles are in very good agreement with the measurements. Additionally, the saturated amplitudes are within a factor of 2 of those measured. The fast ion spatial profile is significantly flattened due to interaction with multiple AEs with amplitude  , which is consistent with [17, 18], where resonance overlap of multiple AEs [9] was found to be the key mechanism for fast ion transport. The nonlinear MHD effects [19–23] that prevent the AE amplitude from increasing to a large amplitude observed in a reduced simulation [24] are included in the hybrid simulation.
In the present work, we investigate the fast ion pressure profile and the fast ion transport flux brought about by AEs for different beam deposition powers in order to clarify how the fast ion pressure profile and the fast ion transport vary with increasing beam deposition power. We perform a scan of the beam deposition power using the same simulation model and the equilibrium data as used in [16].
2. Simulation model
We use the MEGA code [25], in which the bulk plasma is described by the nonlinear MHD equations and the fast ions are simulated with the particle-in-cell method. In this work, we use the same MHD model as used in our previous work [16], where an extended MHD model given in [26] is employed, and the equilibrium toroidal flow is taken into account. The extended MHD equations with the fast ion effects are given by


where  is the vacuum magnetic permeability, γ is the adiabatic constant, and ν,
  and χ are artificial viscosity and diffusion coefficients chosen to maintain numerical stability. In this work, the dissipation coefficients ν,
  , χ, and
  are assumed to be equal to each other. The dissipation terms (viscosity, resistivity, and diffusivity) play a physical role to enhance the damping of AE modes in the MHD simulation that includes continuum damping [27, 28] but does not include kinetic damping such as radiative damping [29] and thermal ion Landau damping. In this paper, we use the same value of the coefficients as used in the previous work,
  normalized by
  where vA is the Alfvén velocity at the plasma center, and R0 is the major radius at the geometrical center of the simulation domain. The subscript 'eq' represents the equilibrium variables. The equilibrium toroidal flow velocity
  , which is assumed to be constant in time, and the thermal ion diamagnetic drift velocity
  are included in the equations. For the thermal ion diamagnetic drift velocity given by equation (6), we retain only the magnetization current part and neglect the remaining part that corresponds to the grad-B and curvature drift in order to keep the initial density profile in equilibrium. Otherwise, the density profile would evolve and deviate from the initial profile and become non-uniform on the magnetic surface. The MHD momentum equation (equation (2)) includes the fast ion contribution in the fast ion current density
  , which consists of the contributions from parallel velocity, magnetic curvature and gradient drifts, and magnetization current. The
  drift disappears in
  due to the quasi-neutrality [25]. Fast ions are simulated using the full-f particle-in-cell (PIC) method and a guiding-center approximation [30], where we employ the gyrokinetic approach to account for finite Larmor radius effects. Electromagnetic fluctuations for the fast ion dynamics are averaged over the fast ion gyro orbit. It was demonstrated that the MEGA code with the full-f PIC method can be applied to energetic particle modes in JT-60U, although the numerical noise level is higher in the full-f PIC simulation than in the delta-f PIC simulation [31, 32]. Cylindrical coordinates
  are used in the simulation. The numbers of grid points are (128, 128, 256) for
  coordinates, respectively. For the purpose of the data analysis, magnetic flux coordinates
  were constructed for the MHD equilibrium where r is the radial coordinate with r = 0 at the plasma center and r = a at the plasma edge, and ϑ is the poloidal angle.
3. Simulation results
3.1. Fast ion pressure profile and Alfvén eigenmodes
In our previous work, we ran a multi-phase simulation and a classical simulation for the DIII-D discharge #142111 at t = 525 ms with beam deposition power 6.25 MW [16]. The beam injection energy is approximately 80 keV, and the full, half, and third energy components are considered. The ratio of the beam ion velocity with 80 keV energy to the Alfvén velocity at the plasma center is 0.50. Collisions (slowing down, pitch-angle scattering, and energy diffusion) and fast-ion losses are included in the simulations. In this work we investigate a total of 8 cases with different beam deposition powers using the equilibrium data and the beam deposition profile that was used in the previous work. The MHD equilibrium was reconstructed with EFIT code [33], assuming MHD velocity  . The MHD equilibrium is also an equilibrium for equations (1)–(7). The equilibrium profiles of ion density (
 ), electron temperature, ion temperature, and the safety factor, where mD is deuterium mass, are shown in figure 1. We use experimental values for collision frequencies. The multi-phase simulations are run with alternating classical phase for 4 ms and hybrid phase for 1 ms. This combination is repeated until stored fast ion energy is saturated, after which, the hybrid simulation is run continuously for 2 ms. Computational particles are injected at a constant rate over a beam injection period tinj, although both the multi-phase and classical simulations are terminated before
  . The slowing-down time is 227 ms at the plasma center, and the time scale for energy decrease is half of the slowing-down time. In the previous work, tinj was set to be 150 ms, which covers the energy decrease time, but the run was terminated before t = 75 ms because the stored fast ion energy reached a steady state at t = 70 ms. In some runs in this work, we reduce the beam injection period tinj to 75 or 100 ms. This enables us to reduce the number of particles while keeping the numerical particle injection rate similar among the runs. We restrict the toroidal mode number of energetic particle drive in the simulation to n = 1–5 in order to reduce the numerical noise. This is supported by the experimental observation that the toroidal mode number of the AE modes is n = 1–5 at
  ms [14]. The beam deposition profile is the same as used in the previous work, but the computational particle weight is scaled to match the total deposition power. Table 1 summarizes the beam deposition power, the last hybrid simulation period, the beam deposition period tinj, and the number of computational particles. It was confirmed in a reduced simulation of bursting evolution of five AEs with toroidal mode number n = 1–5 that 2 million particles are sufficient for numerical convergence in burst interval, modulation depth of the stored fast ion energy at each burst, and saturation level of the stored fast ion energy [24]. The time evolutions of stored fast ion energy and the MHD kinetic energy are shown for
  MW in figure 2. The stored fast ion energy evolutions are compared between the multi-phase simulation and the classical simulation in figure 2(a).
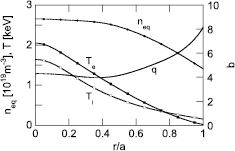
Figure 1. Radial profiles of equilibrium ion density (neq), electron temperature (Te), ion temperature (Ti), and safety factor (q).
Download figure:
Standard image High-resolution image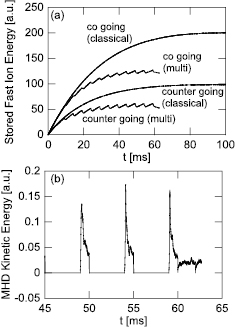
Figure 2. Time evolutions of (a) stored fast ion energy in multi-phase and classical simulations, and (b) MHD kinetic energy in the multi-phase simulation for beam deposition power 9.38 MW.
Download figure:
Standard image High-resolution imageTable 1. Beam deposition power (PNBI), the last hybrid simulation period ( ), beam injection period (tinj), and number of particles (N).
| PNBI (MW) | 1.56 | 3.13 | 4.69 | 6.25 | 7.81 | 9.38 | 12.5 | 15.6 |
 (ms) (ms) |
90–92 | 76–78 | 70–72 | 70–72 | 60–62 | 60–62 | 55–57 | 55–57 |
| tinj (ms) | 100 | 150 | 150 | 150 | 75 | 100 | 75 | 75 |
| N (106) | 4.2 | 8.4 | 8.4 | 8.4 | 4.2 | 4.2 | 4.2 | 4.2 |
Figure 3(a) shows the ratio of stored fast ion energy in the multi-phase simulation to that in the classical simulation for various beam deposition powers. We see a monotonic decrease in the ratio for higher beam deposition power, which indicates a degradation of fast ion confinement. For the highest beam deposition power, the stored fast ion energy is reduced to 46% of the classical value. Figure 3(b) shows the fast ion pressure profiles at the final time (t = te) for all the runs. The fast ion pressure increases for higher beam deposition power. However, the increase is not linearly proportional to the beam deposition power. This is indicated in figure 3(c) where the fast ion pressure profiles are normalized by the classical pressure at the plasma center for each run. We see that the normalized fast ion pressure is reduced for higher beam deposition power, which indicates profile stiffness. For the highest beam deposition power  MW, the fast ion pressure in the hybrid simulation is only 22% of that in the classical simulation at the plasma center.
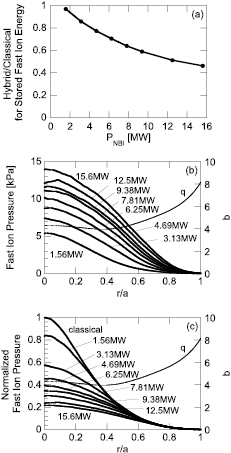
Figure 3. (a) Ratio of stored fast ion energy in multi-phase simulation to that in classical simulation versus beam deposition power, (b) comparison of fast ion pressure profiles, and (c) comparison of fast ion pressure profiles normalized by the central classical pressure among various beam deposition powers.
Download figure:
Standard image High-resolution imageThe reduction in stored fast ion energy and fast ion pressure is brought about by interaction with multiple AEs. The frequencies and the spatial profiles of the AEs are analyzed for the last 2 ms of the hybrid phase. The dominant AEs are toroidal Alfvén eigenmodes (TAEs) with toroidal mode number n = 1–5, which are the same as the run for  MW presented in our previous work. The run for
  MW was validated with the DIII-D experiment for the fast ion pressure profile and electron temperature fluctuation profiles with toroidal mode number n = 3–5 including the absolute amplitude and the phase profile [16]. The spatial profiles of the TAEs are compared in figure 4 between
  MW and 15.6 MW. The major poloidal harmonics and peak locations are the same between
  MW and 15.6 MW for all the modes. The ratio of the cosine part to the sine part, which are represented by solid and dashed lines respectively in the figure, indicates the phase of each harmonic. We see in figure 4(e) that the sign of the cosine part varies from positive for m = 13 to negative for m = 18 with the sine part negative for m = 15. This indicates a smooth variation in the phase of the spatial profile, which corresponds to a sheared spatial profile. This kind of phase variation is weak in figure 4(f) for
  MW. Frequencies are lower by 5–10% for the higher beam deposition power
  MW. Apart from the differences for phase profile and frequency, the modes are almost the same for all the runs. For
  MW, another n = 2 mode is found near the plasma edge with frequency 57 kHz. This mode is considered in the surface of section plot presented in section 3.3.
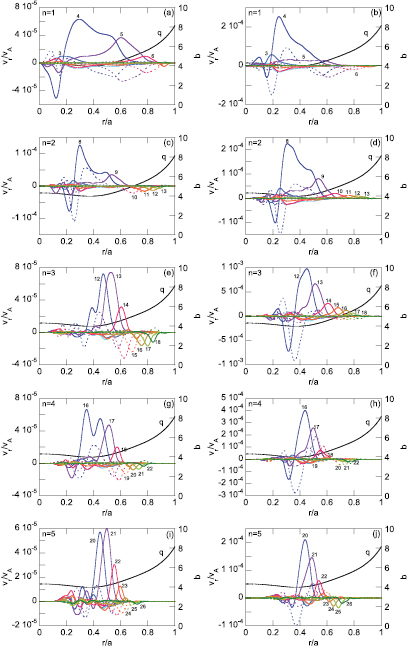
Figure 4. Radial velocity profiles of TAEs for beam deposition power (a), (c), (e), (g), (i) 1.56 MW and (b), (d), (f), (h), (j) 15.6 MW with toroidal mode number and frequency (a) n = 1, 64 kHz, (b) n = 1, 61 kHz, (c) n = 2, 68 kHz, (d) n = 2, 68 kHz, (e) n = 3, 72 kHz, (f) n = 3, 67 kHz, (g) n = 4, 77 kHz, (h) n = 4, 70 kHz, (i) n = 5, 81 kHz, and (j) n = 5, 73 kHz. Solid (dashed) lines show  [
[ ] harmonics with poloidal mode number m labeled in the figure.
Download figure:
Standard image High-resolution imageThe width of resonance regions in phase space depends on mode amplitude. The amplitudes of the TAEs are shown versus beam deposition power in figure 5(a). We see a rising trend in the n = 3 TAE amplitude, which is the largest for most of the runs. The MHD kinetic energy roughly represents the total energy of AEs. The square root of MHD kinetic energy is plotted versus PNBI in figure 5(b), which shows a linear increase with beam deposition power. This is similar to the observations in DIII-D experiments where the sum of the AE amplitudes increases with total beam power above a stability threshold [6].
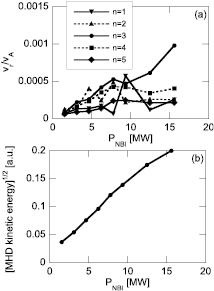
Figure 5. (a) Amplitudes of TAEs with toroidal mode number n = 1–5 and (b) the square root of MHD kinetic energy versus beam deposition power.
Download figure:
Standard image High-resolution image3.2. Critical gradient of fast ion pressure profile
For physical understanding of the fast ion pressure profiles, we have analyzed the spatial gradient of the fast ion pressure profile and the fast ion energy flux brought about by the MHD perturbations. The fast ion energy flux brought about by the MHD perturbations with toroidal mode number n is defined by
where  ,
,  ,
,  ,
,  ,
,  , vEr, and
  are Jacobian, fast ion parallel and perpendicular pressures, parallel and perpendicular 3rd order moments, radial
  drift velocity, and radial fluctuation of magnetic field unit vector respectively. The derivation of equation (8) is given in the appendix.
Figure 6 shows the radial profiles of the fast ion beta gradient and the fast ion energy flux for all the runs. Fast ion beta  is the ratio of fast ion pressure to the magnetic pressure, and
  is the normalized radius. The profiles averaged in the last 2 ms of the hybrid phase are shown in figure 6. The fast ion energy fluxes given by equation (8) are summed over n = 1–5. When we compare the fast ion beta gradient profiles between the lowest (1.56 MW) and the highest (15.6 MW) beam deposition powers, the maximum value increases by only a factor of 2, and the peak location shifts from
  to
to  . This indicates that the increase in fast ion pressure gradient is limited, and that the fast ion pressure profile spreads radially outward. On the other hand, the increase in the fast ion energy flux shown in figure 6(b) is remarkable. It should be noted that the figure is normalized by the beam deposition power for each run. Then, the rise in fast ion energy flux for higher beam deposition power in the figure indicates the rapid increase in the fast ion energy flux.
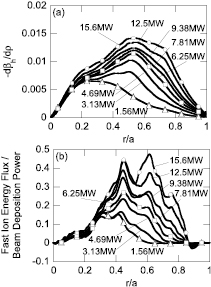
Figure 6. Radial profiles of (a) fast ion beta gradient and (b) fast ion energy flux normalized by the beam deposition power for various beam deposition powers. The fast ion beta profiles and the energy flux profiles are averaged in the last 2 ms of the hybrid phase for each run. The fast ion energy flux is analyzed using equation (8) and summed over n = 1–5.
Download figure:
Standard image High-resolution imageLet us examine the relations among beam deposition power, fast ion beta gradient, and fast ion energy flux for fixed radii. The fast ion beta gradient is plotted versus beam deposition power for various radii in figure 7(a). We see pressure gradient increases for higher beam deposition power. However, the increase is not a linear function of beam deposition power. For r/a = 0.4 and r/a = 0.6, the increase of beta gradient slows down when the beta gradient reaches  –0.01. We turn our attention to the relation between the fast ion energy flux and the fast ion pressure gradient. Figure 7(b) shows this relation. We see a sudden increase in fast ion energy flux for
  . This rapid increase in fast ion energy flux suppresses the increase in fast ion pressure gradient leading to the stiffness of the fast ion pressure profile. Figure 7(c) shows fast ion energy flux versus beam deposition power. We see critical beam deposition powers for the sudden increase in fast ion energy flux,
  for r/a = 0.6,
  for r/a = 0.7, and
  for r/a = 0.8. These results are similar to the observations in DIII-D experiments where fast ion transport suddenly begins to increase above a threshold, and the threshold depends on the phase space location on which each measurement focuses [6].
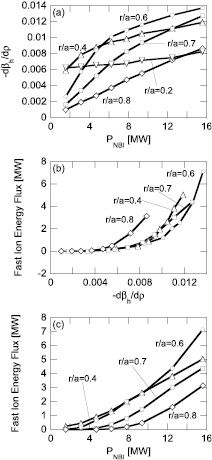
Figure 7. (a) Fast ion beta gradient versus beam deposition power, (b) fast ion energy flux versus fast ion beta gradient, and (c) fast ion energy flux versus beam deposition power for various radii.
Download figure:
Standard image High-resolution image3.3. Time evolution of fast ion energy flux profile and resonance overlap
The fast ion energy flux profile shown in figure 6(b) is an average over the last 2 ms of the hybrid phase for each run. The time evolution of fast ion energy flux profile and the contribution from each eigenmode to the fast ion transport are useful for our understanding of the fast ion transport mechanism. Figure 8 shows the time evolutions of the total energy flux and the energy flux brought about by each toroidal node number for  MW, 3.13 MW, 6.25 MW, and 15.6 MW. Figures 8(a), (c), (e) and (g) show the time evolutions of the total energy flux profiles. The energy flux shown in the figure is averaged over 0.02 ms. We see intermittent properties in the energy flux evolutions. The time evolution of fast ion energy flux at r/a = 0.46 for
  MW is shown in figure 9 to clarify the intermittent properties. The large fluxes shown in figure 8 look like avalanches propagating radially outward and sometimes inward. Some avalanches are highlighted in figure 8(e). For larger beam deposition power, the energy flux profiles spread to the edge. Figures 8(b), (d), (f) and (h) show contours of the energy flux for each toroidal mode number defined by equation (8), for which the toroidal mode number is distinguished with color. We see in the figures that the multiple modes contribute to the fast ion transport, and the fluxes brought about by different modes are overlapped. This motivates us to investigate the resonance regions in fast ion phase space for each mode, and their overlap.
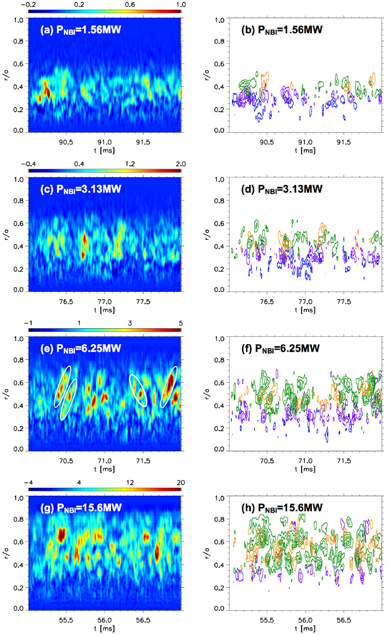
Figure 8. Time evolutions of fast ion energy flux profile and contours of the contributions from toroidal mode number n = 1 (blue), n = 2 (purple), n = 3 (green), n = 4 (orange), and n = 5 (red) for beam deposition power (a), (b) 1.56 MW, (c), (d) 3.13 MW, (e), (f) 6.25 MW, and (g), (h) 15.6 MW. The unit of the color bars in panels (a), (c), (e), and (g) is MW. Some avalanches are highlighted by white ellipses in panel (e).
Download figure:
Standard image High-resolution image
Figure 9. Time evolution of fast ion energy flux at r/a = 0.46 for beam deposition power 6.25 MW.
Download figure:
Standard image High-resolution imageWe analyze the resonance regions in fast ion phase space for a single eigenmode with fixed amplitude and frequency. The amplitude and frequency of the eigenmodes were analyzed for the last 2 ms of the hybrid phase of each run. Figure 10 shows the particle trajectories in the phase space of normalized major radius  and energy E (keV) for beam deposition power (a) 1.56 MW, (b) 3.13 MW, (c) 6.25 MW, and (d) 15.6 MW. The particle orbits were followed with the electromagnetic perturbations of a single eigenmode for 2 ms, and the position in
  space was recorded as each particle passed the mid-plane from bottom to top. Collisions are turned off to clarify the resonance regions. The particles are co-going to the plasma current with the same magnetic moment which gives
  for E = 70 keV. The peak of the fast ion distribution is located at
  . Only the particles trapped by the eigenmode are plotted in the figure. The time for this analysis (= 2 ms) is 1–30 times longer than the bounce period of the wave-particle trapping. The particles are initially located uniformly in
  space with intervals 0.01 in horizontal axis and 1 keV in vertical axis. The particles plotted can be regarded as resonance regions in phase space. The eigenmodes are represented by colors: n = 1 (blue), n = 2 (purple), n = 3 (green), n = 4 (orange), and n = 5 (red). Figure 10(d) for beam deposition power
  MW contains a contribution from an additional n = 2 mode with frequency 57 kHz, which is different from the n = 2 mode shown in figure 4(d) and located near the plasma edge. Readers are referred to similar analyses for DIII-D [17] and AUG [34].
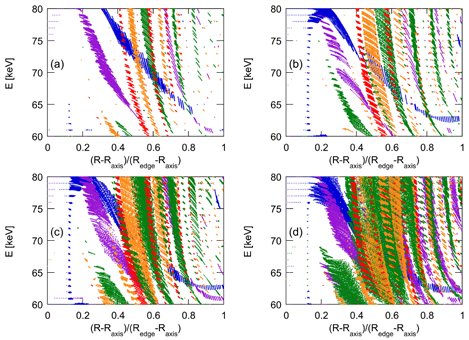
Figure 10. Particle trajectories in the phase space of normalized major radius  and energy E (keV) for beam deposition power (a) 1.56 MW, (b) 3.13 MW, (c) 6.25 MW, and (d) 15.6 MW. Particle orbits are followed with the electromagnetic perturbations of a single TAE with fixed amplitude and frequency, and
  and E are recorded when the particle passes the mid-plane from bottom to top. The particles are co-going to the plasma current with the same magnetic moment which gives
  for E = 70 keV. Only the particles trapped by the TAE are plotted in the figure. The eigenmodes are represented by colors: n = 1 (blue), n = 2 (purple), n = 3 (green), n = 4 (orange), and n = 5 (red).
Download figure:
Standard image High-resolution imageIn figure 10(a) for  MW, only the resonance region of the n = 1 mode (blue) overlaps the resonance regions of the other modes, but the overlapped regions are small in the phase space. For
  MW shown in figure 10(b), the resonance regions of n = 2–5 modes broaden due to the larger amplitude of eigenmodes. However, we see that gaps exist between the resonance regions of n = 5 (red), n = 4 (orange), and n = 3 (green) for
  . These gaps account for the normalized fast ion energy flux for
  MW similar to that for
  MW shown in figure 6(b). For
  MW shown in figure 10(c), the resonance regions overlap substantially for
  . This is consistent with the enhanced fast ion energy flux for 0.4 < r/a < 0.6 for
  MW shown in figure 6(b). The overlapped region spreads outward up to
  for
for  MW shown in figure 10(d), which is also consistent with the fast ion energy flux profile shown in figure 6(b). This agreement between the fast ion energy flux profiles and the phase space structures indicates that the enhanced fast ion transport can be attributed to the resonance overlap among the multiple AEs.
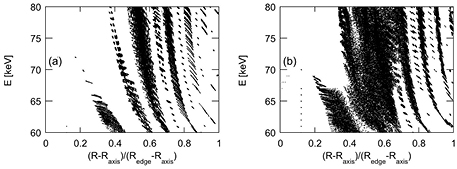
We have investigated the resonance overlap among the multiple AEs in figure 10. On the other hand, it has been pointed out that stochastic regions also appear in phase space for a single AE with large amplitude [24, 35–37]. Figure 11 compares the surface of section plots for n = 3 mode between  MW and 15.6 MW. We see separate resonance regions for
  MW in figure 11(a), and the overlap of the resonance regions for
  MW in figure 11(b). This indicates that stochasticity appears for the single AE with large amplitude. The overlap of the resonance regions also accounts for the dominant amplitude of the n = 3 mode for
  MW as shown in figure 5(a).
Figure 11. Particle trajectories in the phase space of normalized major radius  and energy E (keV) for beam deposition power (a) 6.25 MW and (b) 15.6 MW. Particle orbits are followed with the electromagnetic perturbations of a single TAE with toroidal mode number n = 3, and
  and E are recorded when the particle passes the mid-plane from bottom to top. The amplitude and frequency of the TAE are fixed. The particles are co-going to the plasma current with the same magnetic moment which gives
  for E = 70 keV. Only the particles trapped by the TAE are plotted in the figure.
Download figure:
Standard image High-resolution image
4. Discussion and summary
In this paper, we investigated the fast ion pressure profile flattened by multiple AEs for various neutral beam deposition powers with a multi-phase simulation, which is a combination of classical simulation and hybrid simulation for energetic particles interacting with a magnetohydrodynamic fluid. Monotonic degradation of fast ion confinement and fast ion profile stiffness were found with increasing beam deposition power. The confinement degradation and the profile stiffness are caused by a sudden increase in fast ion transport flux brought about by AEs for the fast ion pressure gradient above a critical value. The critical pressure gradient and the corresponding beam deposition power depend on the radial location. The fast ion pressure gradient stays moderately above the critical value, and the profiles of the fast ion pressure and the fast ion transport flux spread radially outward from the inner region, where the beam is injected. We found that the square root of the MHD fluctuation energy is proportional to the beam deposition power. We analyzed the time evolutions of the fast ion energy flux profiles, and found that intermittent avalanches take place with the contributions from the multiple eigenmodes. The surface of section plots demonstrated that the resonance overlap of multiple eigenmodes accounts for the sudden increase in fast ion transport with increasing beam power. TAEs with n = 1–5 are observed for all the runs including the lowest beam deposition power. This indicates that the critical gradient and the critical beam power for the profile stiffness are substantially higher than the marginal stability threshold. The overlap of the resonance regions of a single TAE was also found for the largest beam power.
Some of the results summarized above are similar to the observations in DIII-D experiments [6] that studied discharges that are similar but not identical to the discharges analyzed here. Similarities include: (1) sudden increase in fast ion transport above a critical beam power, (2) phase-space dependence of the critical beam power, (3) linear dependence of AE amplitude on beam power, and (4) intermittency in fast ion transport. On the other hand, we found a qualitative difference between the DIII-D experiments and the simulations. In the DIII-D experiments, the fast ion profiles do not change above a critical beam power. This profile resiliency is not observed in the simulations presented in this paper. This difference can be attributed to fast ion transport in the edge region. The fast ion transport does not reach the plasma edge where particles are lost, because the resonance overlap does not cover the whole phase space. There may be differences in the fast ion transport in the edge region and in the particle loss condition between simulation and experiment. In the experiments, charge exchange with neutral particles and micro turbulence [38] might affect fast ion transport and losses in the edge region. A careful comparison of the fast ion transport in the edge region and the particle loss condition between simulation and experiment will be needed to understand the difference for the profile resiliency.
Acknowledgments
Numerical computations were performed at the Helios of the International Fusion Energy Center, the Plasma Simulator of the National Institute for Fusion Science, and the K Computer of the RIKEN Advanced Institute for Computational Science (Project ID: hp120212). This work was partly supported by MEXT as a priority issue to be tackeled by using Post 'K' Computer, JSPS KAKENHI Grant Number 15K06652, and the JSPS-NRF-NSFC A3 Foresight Program in the field of Plasma Physics (NRF: No. 2012K2A2A6000443, NSFC: No.11261140328).
Appendix.: Derivation of fast ion energy flux
The time evolution of the fast ion distribution function  in a conservative form is given by
where  ,
,  , and
, and  are
are  , grad-B, and curvature drifts, respectively. We multiply equation (A.1) by
  and focus on the terms with
  and
and  for the fast ion energy flux brought about by AEs:
We multiply equation (A.2) by fast ion mass mh and integrate in velocity space to obtain
The LHS of equation (A.3) is the time derivative of fast ion kinetic energy density. The fast ion energy flux F(r) is given by integrating the RHS term inside the bracket ![$\left[~\right]$](https://content.cld.iop.org/journals/0029-5515/56/11/112008/revision1/nfaa1ea6ieqn085.gif) on a magnetic surface labeled with r,
on a magnetic surface labeled with r,
where  is the Jacobian, and
  is a unit normal vector to the magnetic surface. The net energy flux arises from the combinations of the fast ion moments (
 ) and
) and  and
and  with the same toroidal mode number n. We can define the fast ion energy flux brought about by the electromagnetic fluctuations with toroidal mode number n (equation (8)) by
where  and
and  , and the subscript n indicates the toroidal mode number.