
Abstract
A detailed investigation of the high-temperature thermoelectric properties of the ternary clathrate of type-I Ba8ZnxGe46−x for the range 7.2 ⩽ x ⩽ 7.8 is presented. Electrical resistivity, Seebeck coefficient, thermal conductivity and Hall-effect measurements clearly demonstrate that the maximum ZT-value can be expected for the composition Ba8Zn7.7Ge38.3, which reaches ZT ∼ 0.46 at a temperature of 730 K. Furthermore, the influence on the thermoelectric properties was studied for partial substitution of Zn by one Ni-atom (Ba8NiyZnxGe46−x−y with ynom = 1, and 6.5 ⩽ x ⩽ 7.2) or by three Ni-atoms per unit cell (Ba8NiyZnxGe46−x−y with ynom = 3 and x = 1 to 3). Whereas a small amount of Ni increases the figure of merit ZT to 0.65 at 800 K, a higher Ni-content reduces the thermoelectric performance. Hall-effect measurements reveal that this improvement is essentially due to an increased charge carrier mobility.
Export citation and abstract BibTeX RIS
1. Introduction
The efficiency of thermoelectric materials for energy conversion depends on the figure of merit ZT = S2T/ρλ, where S is the Seebeck coefficient, T the temperature, ρ the electrical resistivity and λ the thermal conductivity. For a long time ZT = 1 was considered as a benchmark for applicability of new materials in addition to all the technical requirements such as temperature stability, mechanical stability and, use of nonhazardous and cheap materials. Several concepts, e.g. nanoscaling [1, 2], the PGEC (phonon glass-electron crystal)-concept [3] or the introduction of resonant levels in the density of states near the Fermi-level [4], offered a road map for further improvements of ZT. Current state-of-the-art thermoelectric materials exhibit maximum ZT-values beyond ZT = 1 [5–8].
Intermetallic clathrate compounds are generally regarded as PGECs. Hitherto the Ge-based type-I compounds (K4Ge23−x-type, Pm
 ; K guest atoms in a Ge-framework) have been studied most intensively and the results, summarized in recent reviews [9, 10], demonstrated the potential for future thermoelectric applications of these materials. In addition to the low thermal conductivity, the ability to modify the charge carrier density using a wide range of elements substituting for framework atoms, which in a simple-minded approach can be explained, applying the Zintl-concept [11–13], raises interest in detailed investigations of clathrates. Despite several shortcomings of this concept, it offers for most clathrate-I compounds remarkably good compliance with experimental results and band structure calculations. Assuming a complete charge transfer from the more electropositive guest atoms to the more electronegative framework atoms results in an excess of 16 e−/unit cell for the hypothetical compound Ba8Ge46. These excess electrons can be compensated either by vacancy formation in the framework structure, e.g. Ba8Ge43□3 or by substitution of Ge-atoms by group III elements or by transition metal elements. Zn and Ni, the elements used here for replacement of Ge, are considered to compensate for two and four electrons per substituted atom, respectively. Consequently, the compound Ba8Zn8Ge38 is considered as a charge-balanced Zintl-phase exhibiting semiconducting properties. Our previous study on the clathrate-I formation, phase relations, and physical properties in the ternary Ba–Zn–Ge system indeed revealed a solubility limit at 800 °C close to this composition [14]. Careful evaluation of x-ray single crystal diffraction of samples with different Zn-content elucidated that two mechanisms, vacancy formation and substitution, take place simultaneously below a Zn-content of six atoms per unit cell. The influence of the Zn-content on thermoelectric properties below 300 K was demonstrated [14, 15] by measurements of electrical resistivity, Seebeck coefficient, and in [15] also Hall-resistivity, and it was clearly established that an increasing Zn-content drives the compound close to a metal-to-insulator transition. The best thermoelectric performance in both studies was found for the samples with highest Zn-content, Ba8Zn7.7Ge38.3 ZT300K = 0.09 [14] and Ba7.95Zn7.83Ge38.17 ZT300K = 0.06 [15], respectively. Melnychenko et al [14] estimated a ZT-value of 0.42 at 700 K for the composition Ba8Zn7.7Ge38.3 using the experimental thermopower data at 700 K together with careful extrapolations of room temperature data for resistivity and thermal conductivity. Interestingly a single crystal of Ba8Zn8Ge38 grown by a self-flux method clearly exhibited semiconducting electrical resistivity [16], but still, like all other compounds investigated in this system, had a negative value of the Seebeck coefficient at room temperature. In contrast to this, for the clathrate-I phase Ba8NixGe46−x detailed investigations on the Ni-incorporation and phase relations are still absent, although the phase formation was already reported by Cordier and Woll in 1991 [17]. Nevertheless, both, n-type compounds [18–20] as well as p-type compounds [18] have been synthesized successfully in this system, but hitherto the solubility limit of Ni in the clathrate framework and the composition, at which the n/p-transition takes place, has not been clearly defined.
Although the authors of [15] proposed a more detailed analysis of the thermoelectric properties of Ba8ZnxGe46−x close to x = 8 above 300 K, this investigation has not been carried out yet. Thus, the scope of this work is to present a detailed investigation of the thermoelectric properties in the ternary Ba–Zn–Ge clathrate solution close to the metal-to-insulator transition. Furthermore, we will study the influence on transport properties and the thermoelectric figure of merit by additional Ni, Zn co-substitution in Ba8NiyZnxGe46−x−y for nominal Ni-contents of y = 1 and 3 atoms per unit cell and for varying Zn contents of 6.5 ⩽ x ⩽ 7.2 and 1 ⩽ x ⩽ 3, respectively.
2. Experimental details
Elemental ingots (Ba 99.9 and Ge, Ni, Zn 99.99 mass%) were used for sample preparations. In all cases a similar procedure was adopted: firstly, six master alloys of 3 to 5 g were synthesized, (Ba8Zn7Ge39 and Ba8Zn8.2Ge37.8, Ba8Ni1Zn6.5Ge38.5 and Ba8Ni1Zn7.2Ge37.8, Ba8Ni3Zn1Ge42 and Ba8Ni3Zn3Ge40) and secondly, mixing proper ratios of these end members produced various compositions in between. In all cases additional 3 mass% Ba (103 mass% of the stoichiometric amount) were used to compensate evaporation losses during the arc melting process (the experimental weight loss was exclusively attributed to Ba). After melting proper amounts of Ba and Ge or Ba, Ni and Ge in an electrical arc furnace, the samples were mixed with Zn and sealed in quartz tubes under vacuum. The mixture was then heated up to 1000 °C, kept there for 1 h allowing the alloys to melt and afterwards cooled down to room temperature by switching off the furnace. The resulting pieces were crushed to a particle size below ∼1 mm in an argon-filled glove box and transferred to WC-lined ball mill containers with WC-balls of a high-energy planetary mill (Vario Pulverisette 4). Subsequently the fine powders were hot pressed in graphite dies under argon at 800 or 900 °C at a pressure of 56 MPa in a HP W 200/250-2200-200-KS (FCT Systeme GmbH). Densities of the hot pressed samples (about 2 g each) were determined using Archimedes' principle.
All samples were characterized by x-ray powder diffraction (XPD) employing a Guinier–Huber Imaging plate system with CuKα1-radiation as well as by electron probe microanalysis (EPMA) (Zeiss Supra 55VP, 20 kV, EDX-detector (Oxford Instr.)). Lattice parameters were determined by XPD using Ge as an internal standard. The Rietveld refinement with the program FullProf [21] was used for qualitative and quantitative phase characterization.
Electrical resistivity, Seebeck coefficient and thermal conductivity measurements in the temperature range from 4.2 to 300 K were performed on homemade equipment (described in detail in [22]) or on a QD PPMS-system. Measurements of electrical resistivity and Seebeck coefficients above room temperature up to 825 K were carried out on an ULVAC ZEM 3-system. Thermal conductivity was evaluated on data collected in an ANTER Flashline 3000 unit in the same temperature range. For Hall-effect measurements from 4 to 300 K we used a QD PPMS-system. Measurement errors for the electrical resistivity and the Seebeck coefficient are <5% and for the thermal conductivity <10%.
3. Results and discussion
3.1. Chemical and structural characterization
In total a set of 20 samples has been prepared with varying compositions. Details on EDX compositions, lattice parameters, absolute and relative densities for the samples Ba8ZnxGe46−x are presented in table 1, for samples Ba8NiyZnxGe46−x−y with ynom = 1 are listed in table 2, and for Ba8NiyZnxGe46−x−y with ynom = 3 in table 3. The Rietveld analysis of the x-ray powder patterns revealed in all cases the formation of a clathrate-I phase with K4 Ge23−x-type (SG Pm
 . Refinements were performed using the crystallographic data reported for Ba8Zn7.7Ge38.3 [14]: in all cases Ba-atoms were assigned to the crystallographic sites 2a and 6c (at the centres of the pentagon–dodecahedra and the tetrakaidecahedra, respectively) and Ge-atoms to the framework positions 24k, 16i and 6d. In some cases minor impurities of less than 3% Ge or NiGe were detected. Neither XPD nor EPMA data indicated any sign of oxidation or incorporation of light impurity elements during the preparation process. As XPD cannot distinguish accurately between elements with similar x-ray scattering power (Ni, Zn and Ge), the absolute Ni- and Zn-content of all samples is based on EPMA data taking the sample Ba8Zn7.7Ge38.3 of an earlier work [14] as an EDX reference composition. In accordance with the detailed single crystal x-ray investigations reported earlier [14], revealing the absence of vacancies in the clathrate framework for Zn-contents larger than x = 6, our Rietveld refinements as well as EPMA did not give clear hints for the presence of vacancies. All samples, hot pressed at 900 °C, reveal a significantly higher density as compared with the samples hot pressed at 800 °C, but no significant influence on the thermoelectric properties was observed.
Table 1. EDX composition, lattice parameters and absolute and relative density of samples Ba8ZnxGe46−x.
| EPMA (at%) | Formula from EPMAa | Hot Press conditions | Density (g cm−3) | Relative densityb (%) | Lattice parameters (nm) | ||
|---|---|---|---|---|---|---|---|
| Ba | Zn | Ge | |||||
| 14.83 | 13.52 | 71.65 | Ba8Zn7.30Ge38.70 | 900 °C, 56 MPa | 5.83 | 99 | 1.076 24(2) |
| 14.85 | 13.57 | 71.58 | Ba8Zn7.33Ge38.67 | 900 °C, 56 MPa | 5.83 | 99 | 1.076 18(1) |
| 14.82 | 13.76 | 71.42 | Ba8Zn7.43Ge38.57 | 800 °C, 56 MPa | 5.77 | 98 | 1.076 37(2) |
| 14.72 | 14.11 | 71.17 | Ba8Zn7.62Ge38.38 | 900 °C, 56 MPa | 5.85 | 99 | 1.076 22(2) |
| 14.82 | 14.13 | 71.05 | Ba8Zn7.62Ge38.38 | 900 °C, 56 MPa | 5.84 | 99 | 1.076 31(2) |
| 14.90 | 14.22 | 70.88 | Ba8Zn7.68Ge38.32 | 800 °C, 56 MPa | 5.77 | 98 | 1.076 40(2) |
| 14.85 | 14.41 | 70.74 | Ba8Zn7.78Ge38.22 | 800 °C, 56 MPa | 5.78 | 98 | 1.076 60(2) |
aZn + Ge normalized to 46 atoms, Ba-atoms set to 8/unit cell. bmeasured density/x-ray density in %.
Table 2. Nominal, EDX composition, lattice parameters, absolute and relative density of samples Ba8NiyZnxGe46−x−y (with ynom = 1).
| Nominal composition | EPMA (at%) | Formula from EPMAa | Density (g cm−3) | Relative densityb (%) | Lattice parameters (nm) | |||
|---|---|---|---|---|---|---|---|---|
| Ba | Ni | Zn | Ge | |||||
| Ba8NiZn6.5Ge38.5 | 15.0 | 1.6 | 11.8 | 71.6 | Ba8Ni0.8Zn6.4Ge38.8 | 5.86 | 99 | 1.074 84(2) |
| Ba8NiZn6.6Ge38.4 | 15.3 | 1.5 | 11.3 | 71.9 | Ba8Ni0.8Zn6.1Ge39.1 | 5.84 | 99 | 1.075 02(2) |
| Ba8NiZn6.7Ge38.3 | 15.4 | 0.9 | 12.0 | 71.7 | Ba8Ni0.5Zn6.5Ge39.0 | 5.86 | 99 | 1.074 97(1) |
| Ba8NiZn6.8Ge38.2 | 15.2 | 1.0 | 11.9 | 71.9 | Ba8Ni0.5Zn6.5Ge39.0 | 5.85 | 99 | 1.075 10(2) |
| Ba8NiZn6.9Ge38.1 | 14.8 | 0.7 | 12.9 | 71.6 | Ba8Ni0.4Zn7.0Ge38.7 | 5.87 | 99 | 1.075 20(2) |
| Ba8NiZn6.9Ge38.1 | 15.0 | 1.0 | 13.2 | 70.8 | Ba8Ni0.5Zn7.1Ge38.4 | 5.87 | 99 | 1.075 41(2) |
| Ba8NiZn7.0Ge38.0 | 15.2 | 1.1 | 12.8 | 70.9 | Ba8Ni0.6Zn6.9Ge38.5 | 5.84 | 98 | 1.075 49(2) |
| Ba8NiZn7.1Ge37.9 | 14.7 | 0.9 | 12.8 | 71.6 | Ba8Ni0.5Zn6.9Ge38.6 | 5.87 | 99 | 1.075 31(4) |
aNi + Zn + Ge normalized to 46 atoms, Ba-atoms set to 8/unit cell. bmeasured density/x-ray density in %.
Table 3. Nominal, EDX composition, lattice parameters, absolute and relative density of samples Ba8NiyZnxGe46−x−y (with ynom = 3).
| Nominal composition | EPMA (at%) | Formula from EPMAa | Density (g cm−3) | Relative densityb (%) | Lattice parameter (nm) | |||
|---|---|---|---|---|---|---|---|---|
| Ba | Ni | Zn | Ge | |||||
| Ba8Ni3Zn1Ge42 | 14.8 | 5.4 | 2.2 | 77.6 | Ba8Ni2.9Zn1.2Ge41.9 | 5.87 | 98 | 1.068 89(2) |
| Ba8Ni3Zn1.5Ge41.5 | 14.8 | 5.2 | 2.8 | 77.2 | Ba8Ni2.8Zn1.5Ge41.7 | 5.86 | 98 | 1.069 42(2) |
| Ba8Ni3Zn2Ge41 | 14.5 | 5.2 | 4.4 | 75.9 | Ba8Ni2.8Zn2.4Ge40.8 | 5.86 | 98 | 1.070 17(2) |
| Ba8Ni3Zn2.5Ge40.5 | 15.1 | 4.3 | 6.0 | 74.6 | Ba8Ni2.3Zn3.2Ge40.5 | 5.88 | 99 | 1.070 57(2) |
| Ba8Ni3Zn3Ge40 | 14.9 | 4.7 | 6.9 | 73.5 | Ba8Ni2.4Zn3.6Ge40 | 5.88 | 99 | 1.071 05(2) |
aNi + Zn + Ge normalized to 46 atoms, Ba-atoms set to 8/unit cell. bmeasured density/x-ray density in %.
In order to illustrate the chemical compositions of all samples investigated in this work, a Gibbs triangle was drawn among its constituents 'Ba8Ge46', 'Ba8Zn46' and 'Ba8Ni46' (figure 1). The red triangles represent the composition of the ternary samples Ba8ZnxGe46−x. The red line indicates the Zintl limit, assuming a zero valence for Ni and 2 for Zn, respectively.

Figure 1. Gibbs triangle indicating the composition of all samples investigated in this work. The empty symbols represent the nominal composition; filled symbols represent the EPMA-results. The red line outlines the charge-balanced compositions in terms of the Zintl-concept.
Download figure:
Standard imageEPMA clearly demonstrates that none of the Ni-containing samples preserved the nominal composition. The nominal compositions are indicated in figure 1 as unfilled symbols, whereas the filled symbols represent the real composition extracted from EPMA. Except for Ba8Ni2.4Zn3.6Ge40, which is located beyond the Zintl-limit, none of the samples is surpassing this boarder line. For the series of samples Ba8NiyZnxGe46−x−y with ynom = 3 a significant decrease in the amount of Ni-atoms per unit cell is found for the two samples with the highest Zn-content (table 3). This difference is also evidenced by the change of lattice parameters plotted versus Zn-content (figure 2). Whereas the lattice constants a for the three samples with lower Zn-content exhibit a linear increase with increasing amount of zinc (displayed by a solid line in figure 2) and the number of Ni-atoms/u.c. remains almost constant, cell constants a of the two samples with nominal composition Ba8Ni3Zn2.5Ge40.5 and Ba8Ni3Zn3Ge40 are significantly dropping away from this linear trend due to their lower Ni-content (see also figure 1). In general the Ni-content is decreasing with increasing Zn-content, but this behaviour is not strictly maintained throughout the whole series of samples. The microstructure of the representative sample Ba8Ni2.4Zn3.6Ge40 was investigated examining the surface of a broken piece by the secondary electron detector of the SEM at 5 kV. The image is shown in the inset of figure 2 and reveals a wide distribution of particle sizes from larger than 2 µm down to a few hundreds of nanometres.
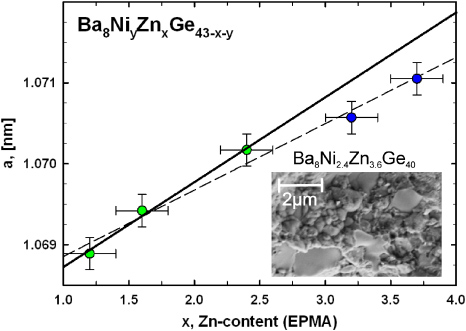
Figure 2. Lattice parameter a as a function of the Zn-content for the samples Ba8NiyZnxGe46−x−y (with ynom = 3). The black solid line shows a linear fit to three samples coloured green and the dashed line is a linear fit to all data points.
Download figure:
Standard image3.2. Thermoelectric properties
3.2.1. Thermoelectric properties of Ba8ZnxGe46−x with 7.3 ⩽ x ⩽ 7.8
The electrical resistivities, ρ, of samples Ba8ZnxGe46−x with x = 7.33, 7.62 and 7.78 were measured in the temperature range from 4 to 300 K with a QD PPMS-system. Figure 3 records the electrical resistivities normalized to their values at 300 K. The change in ρ(T) from metallic-like (for x = 7.33, 7.62) to semiconducting nature (for x = 7.78) can be clearly seen. The electrical resistivity as a function of temperature of the samples Ba8Zn7.33Ge38.67 and Ba8Zn7.62Ge38.38 below 300 K can be described in terms of the Bloch–Grüneisen model applicable for simple metals, resulting in residual resistivities of ρ0 = 327 µΩ cm, and ρ0 = 475 µΩ cm and Debye-temperatures of θD = 220 K and θD = 250 K, respectively. θD for both samples is close to θD = 225 K extracted from heat capacity measurements on Ba8Zn7.7Ge38.3 [14]. Figure 4 presents the electrical resistivity data above room temperature. The resistivity is increasing with increasing Zn-content. Not only are the absolute values changing, but also the temperature dependence is changing from a more or less linear to a more complex behaviour. Whereas the resistivity does not modify too much between 7.3 and 7.62 Zn-atoms per unit cell, there is a dramatic increase for higher Zn-contents. Taking also into account the room-temperature value of 750 mΩ cm for Ba8Zn8Ge38 revealed by Christensen and Iversen [16], the resistivity at 300 K increases by a factor of more than 1300 for substituting only 0.7 Ge-atoms/u.c. by Zn. This small change in composition is severely affecting the electrical resistivity, evidencing the proximity to a metal-to-insulator transition, close to the Zintl-balanced composition Ba8Zn8Ge38.

Figure 3. Normalized electrical resistivity for samples Ba8ZnxGe46−x for 4.2–300 K.
Download figure:
Standard image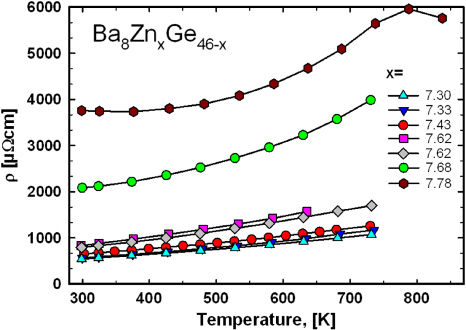
Figure 4. Electrical resistivity for samples Ba8ZnxGe46−x for 300–750 K.
Download figure:
Standard imageThe corresponding Seebeck coefficients, S, are plotted in figure 5. Also, here an increase in the Zn-content is accompanied by an increase in the absolute S-values. All samples exhibit an almost linear temperature dependence from 300 to 700 K. The electrical resistivity as well as the Seebeck coefficient of Ba8Zn7.78Ge38.22 shows a maximum close to 800 K.
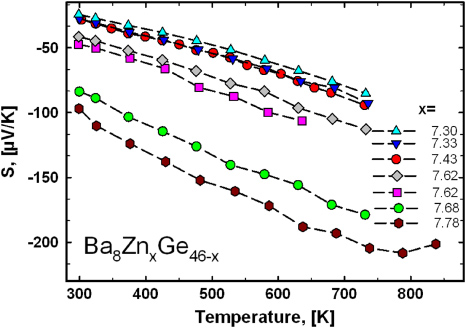
Figure 5. Seebeck coefficient for samples Ba8ZnxGe46−x for 300–750 K.
Download figure:
Standard imageThermal conductivity was measured for samples with x = 7.33, 7.62 and 7.78 from 300 to 830 K revealing little change with temperature (figure 6). The total thermal conductivity (λtot) is decreasing with increasing Zn-content, which can be mainly attributed to a reduction in the electron contribution (λe). The Wiedemann–Franz relation was employed to estimate λe using the electrical resistivity data (with L = 2.44 × 10⁻⁸ W Ω K−2). As expected for a small change in composition the phonon thermal conductivity (λph) for the samples with x = 7.33 and 7.62 is practically similar. Only for Ba8Zn7.78Ge38.22 was a significantly higher λph observed. There are two possible explanations: either (i) the Wiedemann–Franz law, in a strict sense only valid for a free electron gas, does not hold any more, as the resistivity data of this sample clearly reveal a non-metallic-like behaviour (see figures 3 and 4), and/or (ii) λph is increased due to a reduced scattering of phonons by electrons, as the absolute charge carrier density of this sample is the smallest (see figure 7). The theoretical lower limit of the lattice thermal conductivity according to Cahill and Pohl [23] was calculated taking a Debye-temperature of 225 K, gained from earlier heat capacity measurements [14] and is shown as a dashed black line in figure 6.
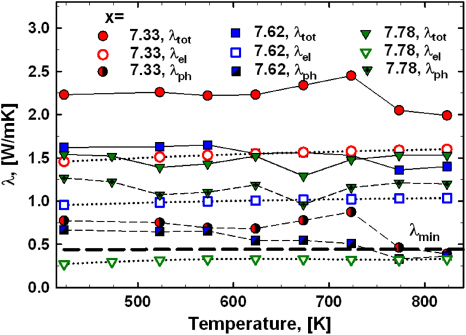
Figure 6. Thermal conductivity for samples Ba8ZnxGe46−x for 423–823 K. The black dashed line indicates the minimum thermal conductivity according to the formalism developed by Cahill and Pohl [23] using a Debye-temperature of 225 K [14].
Download figure:
Standard image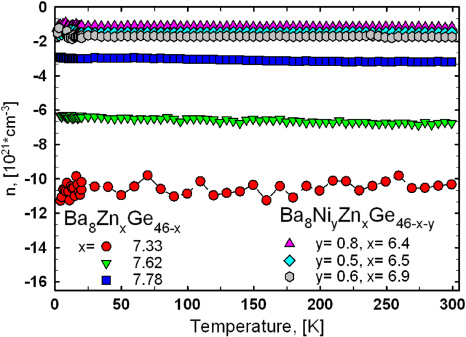
Figure 7. Temperature-dependent charge carrier concentration of selected samples Ba8ZnxGe46−x and Ba8NiyZnxGe46−x−y.
Download figure:
Standard imageHall-effect measurements were performed for three samples with a Zn-content of 7.33, 7.62 and 7.78, respectively. In agreement with the Seebeck coefficients and with results reported previously [15], all samples indicate electrons as the predominant charge carriers. All three samples reveal almost temperature-independent charge carrier densities, and, as expected, a decrease in the absolute value with increasing Zn-content leading from −10.3 × 1021 cm−3 for Ba8Zn7.33Ge38.67 to −3.2 × 1021 cm−3 for Ba8Zn7.78Ge38.22 (figure 7). Although Alleno et al [15] also observed a carrier concentration invariant with temperature for the sample Ba8Zn7.83Ge38.17, the absolute value of −2.5 × 1021 cm−3 is slightly smaller than the values measured within this work.
The charge carrier mobility, μ, of the selected samples is shown in figure 8. The mobility was calculated from the relation μ = σ/ne, with μ being the mobility, σ the electrical conductivity, n the charge carrier density, and e the carrier charge (in this case the electron charge). Due to the different behaviour in electrical resistivity (see figure 3) different scenarios are found for the samples with lower Zn-content in contrast to the one with xZn = 7.78. A detailed analysis reveals a temperature independent mobility, μ(T), below 100 K, which is, assuming non-degeneracy for the charge carriers and a distribution function given by Maxwell–Boltzmann statistics, usually attributed to neutral impurity scattering in semiconductors [24]. In the temperature range from 100 to 300 K for both samples (xZn = 7.33, 7.62) a decrease in the mobility close to a T−1/2-behaviour (indicated by a black solid line in figure 8) is observed. This temperature dependence is expected in the case of alloy scattering, which occurs whenever different atoms in semiconductor compounds are not arranged periodically in the crystal structure [24]. Yan et al observed a similar behaviour for Ba8Cu5Si18Ge23 [25]. Room temperature values of μ are well within the range of other Ba–Ge-based clathrate compounds listed in [9].
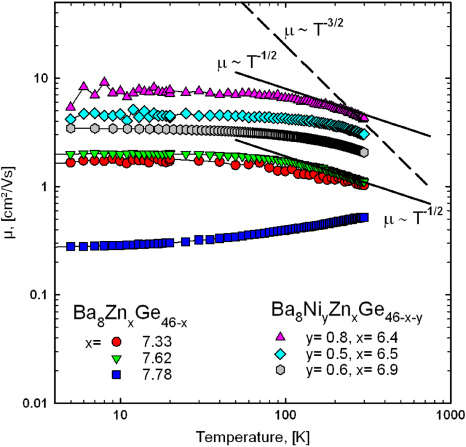
Figure 8. Temperature-dependent Hall-mobility of selected samples Ba8ZnxGe46−x and Ba8NiyZnxGe46−x−y. The black lines indicate different μ(T)-behaviours for alloy scattering (T−1/2, solid) and acoustic phonon scattering (T−3/2, dashed).
Download figure:
Standard imageThe electron effective mass can be derived from equation (1), usually valid for a single parabolic band at high n and/or low T [26],

where n is the charge carrier density, T is the temperature and m* is the effective carrier mass. An evaluation revealed a significant difference in behaviour for samples with a Zn-content of 7.33, and 7.62 in contrast to that with 7.78. Whereas the calculated values of the effective mass for the former samples are almost similar (7me for Zn7.33 and 6.8me for Zn7.62), m* for Zn7.78 appears significantly increased (10.5me). This observation indicates that the assumption of a single parabolic band is not valid in the case of Ba8ZnxGe46−x, which was already demonstrated for Ba8AuxGe46−x [27]. Furthermore, a comprehensive compilation of effective masses [9] clearly reveals that p-type compounds, in general, exhibit larger m*-values than n-type clathrates. As Ba8Zn7.78Ge38.22 is located close to the n/p-transition, an enhanced effective mass can be observed. The Pisarenko plot (figure 9) shows the Seebeck coefficients at 300 K as a function of the charge carrier concentration; the dashed lines indicate the predicted values for a single parabolic band behaviour for 6.8me and 10.5me according to equation (1).
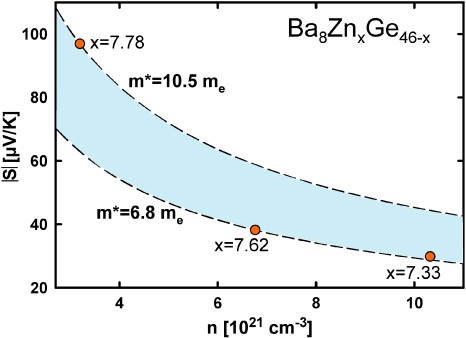
Figure 9. Pisarenko plot showing the measured Seebeck coefficients at 300 K of the samples Ba8ZnxGe46−x as a function of the charge carrier density. The dashed lines correspond to the calculation of S according to equation (1) with m* being 6.8me and 10.5me, respectively.
Download figure:
Standard imageIn order to evaluate in detail the thermoelectric potential of the ternary clathrate-I Ba8ZnxGe46−x, electrical resistivity and Seebeck coefficient data at 300 K and 730 K were plotted as a function of the Zn-content and least-squares fits were applied (figure 10). In addition to the data gained within this work, electrical resistivities and Seebeck coefficients reported earlier [14, 16] were used. As these Seebeck coefficients [14, 16] were not evaluated up to 730 K, simple linear extrapolations to the measured data were used to estimate the values. From figure 5 one can see, that the S-values up to 730 K follow an almost linear temperature dependence, thus the extrapolated values from literature data should not deviate too much from the real values. Electrical resistivity data, unfortunately, do not exhibit a simple T-dependence, thus no extrapolated data were used in this case, but the same exponential function used for the data at 300 K was fitted to the data at 730 K.
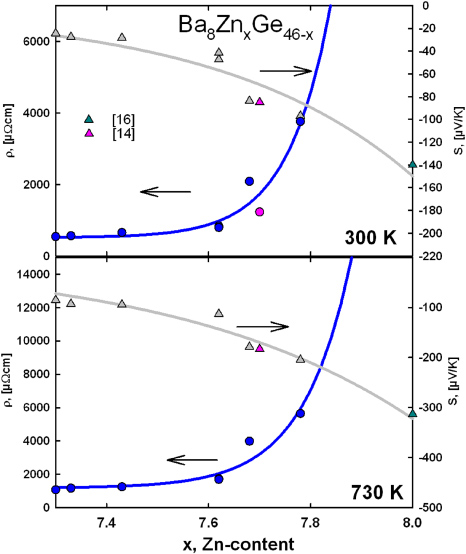
Figure 10. Dependence of electrical resistivity (circles) and Seebeck coefficients (triangles) on the Zn-content at 300 and 730 K. The solid lines represent least-squares fits to the measured data.
Download figure:
Standard imageThe power factor (PF) at 730 K was calculated using the fit-values, with PF = S2/ρ, where S is the Seebeck coefficient and ρ the electrical resistivity. In order to estimate then the dimensionless thermoelectric figure of merit ZT = PF × T/λtot, where T is the temperature and λtot the total thermal conductivity, the electronic contribution to the thermal conductivity was calculated via the Wiedemann–Franz law and the phonon contribution was assumed to be 0.85 W mK−1. This value is derived taking the average of all three λph-values (for xZn = 7.33, 7.62 and 7.78) at 730 K (see figure 6). The results are shown in figure 10 depicting the dependence of PF and ZT on the zinc content in Ba8ZnxGe46−x. Both curves exhibit a maximum, which for ZT is shifted to a higher Zn-content, attributed to the beneficial influence of a further decrease in the electron thermal conductivity. The maximum value of the thermoelectric figure of merit in the ternary clathrate-I system Ba8ZnxGe46−x is expected to be 0.46 at 730 K for x being close to 7.7 (figure 11). In figure 12 the ZT-values of the measured samples (x = 7.33, 7.62 and 7.78) are plotted as a function of temperature. ZT is increasing with temperature and the results are in sound agreement with the estimated values, demonstrating that an estimation using the procedure described above can serve as a helpful tool to find the optimum composition with respect to the thermoelectric performance. It should be noted that obviously the maximum TE performance has already been found for the Ba8ZnxGe46−x system. Results of the physical property measurements are summarized in table 4.
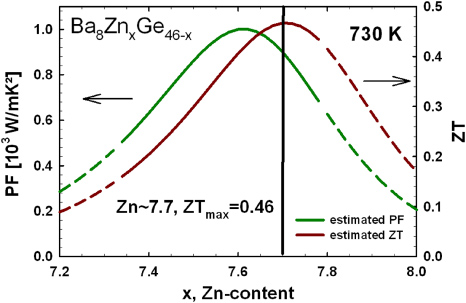
Figure 11. Estimated PF and thermoelectric figure of merit as a function of the Zn-content for Ba8ZnxGe46−x calculated from the fit functions of figure 10, and using the Wiedemann–Franz law for λe and an average λph = 0.85 W mK−1. The dashed parts of the lines indicate the extrapolated regions.
Download figure:
Standard image
Figure 12. Temperature dependence of the thermoelectric figure of merit ZT for samples Ba8ZnxGe46−x with x = 7.33, 7.62, and 7.78.
Download figure:
Standard imageTable 4. Composition, thermoelectric properties (ρ, S, λ) at 700 K, room-temperature charge carrier densities (n), band gap widths (Eg), and Debye-temperatures (θD) of all samples.
| Formula from EPMAa | ρ700K (μΩ cm) | S700K (μV K−1) | λ700K (W mK−1) | ZT700K | n300K (1021 cm−3) | Eg b (K) | Eg c (K) | θD b (K) |
|---|---|---|---|---|---|---|---|---|
| Ba8ZnxGe46−x | ||||||||
| Ba8Zn7.30Ge38.70 | 1027 | −80 | — | — | — | na | na | na |
| Ba8Zn7.33Ge38.67 | 1110 | −84 | 2.2 | 0.20 | 10.32 | na | na | na |
| Ba8Zn7.43Ge38.57 | 1210 | −88 | — | — | — | na | na | na |
| Ba8Zn7.62Ge38.38 | 1627 | −108 | 1.4 | 0.34 | 6.75 | na | na | na |
| Ba8Zn7.62Ge38.38 | — | — | — | — | — | na | na | na |
| Ba8Zn7.68Ge38.32 | 3739 | −174 | — | — | — | na | na | na |
| Ba8Zn7.78Ge38.22 | 5913 | −206 | 1.5 | 0.35 | 3.19 | na | na | na |
| Ba8NiyZnxGe46−x−y (with ynom = 1) | ||||||||
| Ba8Ni0.8Zn6.4Ge38.8 | 3420 | −170 | 1.5 | 0.39 | 1.16 | 4040 | na | 299 |
| Ba8Ni0.8Zn6.1Ge39.1 | 3722 | −183 | 1.4 | 0.46 | — | 4027 | na | 299 |
| Ba8Ni0.5Zn6.5Ge39.0 | 4135 | −179 | 1.2 | 0.46 | — | 4512 | na | 300 |
| Ba8Ni0.5Zn6.5Ge39.0 | 4041 | −186 | 1.4 | 0.44 | 1.47 | 4128 | na | 300 |
| Ba8Ni0.4Zn7.0Ge38.7 | 4280 | −190 | 1.9 | 0.32 | — | 4328 | na | 299 |
| Ba8Ni0.5Zn7.1Ge38.4 | 3575 | −173 | 1.2 | 0.49 | — | 4082 | na | 300 |
| Ba8NiZn7.0Ge38.0 | 4040 | −178 | 1.0 | 0.55 | 1.74 | 4355 | na | 280 |
| Ba8Ni0.5Zn6.9Ge38.6 | 4676 | −190 | 1.8 | 0.30 | — | 4230 | na | 320 |
| Ba8NiyZnxGe46−x−y (with ynom = 3) | ||||||||
| Ba8Ni2.9Zn1.2Ge41.9 | 2624 | −121 | 1.9 | 0.24 | — | 4311 | 2086 | 336 |
| Ba8Ni2.8Zn1.5Ge41.7 | 3228 | −142 | 1.9 | 0.23 | — | 3927 | 2155 | 236 |
| Ba8Ni2.8Zn2.4Ge40.8 | 4740 | −133 | 1.9 | 0.12 | — | 3588 | 1926 | 380 |
| Ba8Ni2.3Zn3.2Ge40.5 | 4884 | −164 | 1.5 | 0.24 | — | 3873 | 2406 | 216 |
| Ba8Ni2.4Zn3.6Ge40 | 4354 | −165 | 1.2 | 0.35 | — | 3913 | 2530 | 211 |
aZn + Ge + Ni normalized to 46 atoms, Ba-atoms set to 8/unit cell. bFit-results applying the two-band model to ρ(T). cEg calculated using formula (3). na—not applicable.
3.2.2. Thermoelectric properties of Ba8NiyZnxGe46−x−y with ynom = 1
The electrical resistivity of all samples was measured in a temperature range from 4.2 to 800 K (figure 13) and in general shows a metallic-like behaviour. In several cases a flattening of the slope of the resistivity curve at temperatures above 650 K is observed (figure 13), which might indicate the proximity of the system to a metal-to-insulator transition. A suitable description for ρ(T) throughout the whole temperature range investigated can be derived from a two-band model developed and described in detail in [28, 29]. The model assumes a constant density of states (N0), where the valence band and the conduction band are separated by a gap of width Eg. The Fermi energy (EF) is located slightly above the band edge of the conduction band, which guarantees predominantly electron-like transport (an illustration of this assumption is shown in figure 14). This scenario is confirmed by theoretical calculations for a few ternary Ge/Si-based clathrates incorporating elements such as Cu [30], Zn [31, 32], Ag [29] and Au [33]. The two-band model is based on a temperature-dependent charge carrier density, which is combined with the Bloch–Grüneisen formula. In order to describe deviations from linearity also at moderate temperatures according to the theory of Mott and Jones a T3-term was added. Details on the fitting procedure are given in [34] for all samples, and results are listed in table 4. The fit to the most representative sample Ba8Ni0.8Zn6.4Ge38.8 is shown in figure 14, resulting in a band gap of 4040 K (0.35 eV) and a Debye-temperature θD = 300 K. In general, band gaps of all samples are in the range 4030 (0.35 eV) to 4500 K (0.39 eV) and θD gained from the fits are all close to 300 K. A closer inspection of the low-temperature behaviour revealed a logarithmic increase in the resistivity below 20 K (figure 15). A similar behaviour was also reported for Ba8Ni3.5Ge42.1□0.4 [20]. This unexpected increase of ρ(T) towards low temperatures might be due to some localization phenomena, corroborated by the fact that this feature appears more pronounced for the samples with the largest overall resistivities. Although localized systems can be frequently described in terms of Mott's hopping conductivity [35], an analysis of the data according to this model (right panel figure 15) clearly demonstrates that this is not the case for these compounds.
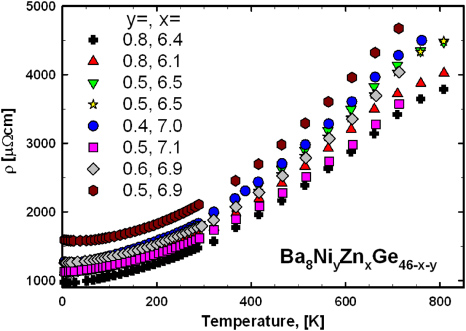
Figure 13. Temperature dependence of the electrical resistivity of Ba8NiyZnxGe46−x−y.
Download figure:
Standard image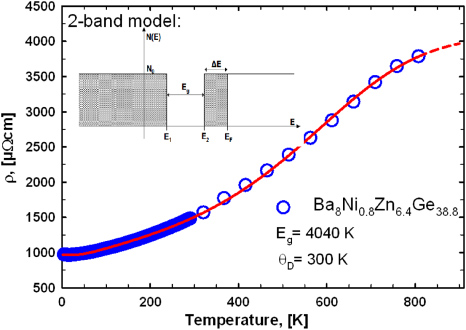
Figure 14. Electrical resistivity of the sample Ba8Ni0.8Zn6.4Ge38.8. The red line is showing the fit to the two-band model. Resulting band gap and Debye-temperature are given. The inset shows the electron density of states assumed within this model.
Download figure:
Standard image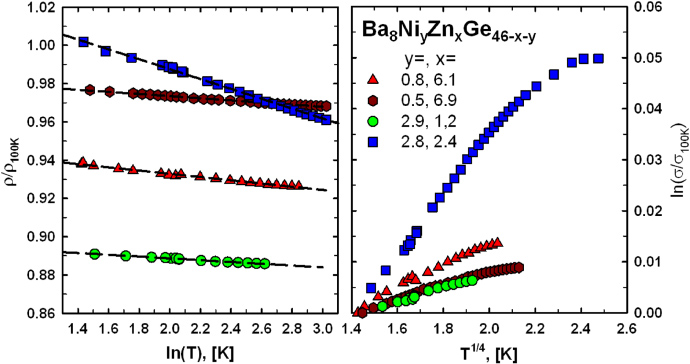
Figure 15. Normalized low-temperature electrical resistivity as a function of ln(T) (left panel), and normalized conductivity as a function of T1/4 (right panel) for selected samples.
Download figure:
Standard imageSeebeck values of all samples are negative throughout the whole temperature range investigated (4.2–800 K, figure 16), revealing n-type conductivity. In similarity to the electrical resistivity, increasing absolute values of the Seebeck coefficient of most samples as a function of temperature exhibit a slight flattening above 650 K, whereas an almost linear slope is observed at lower temperatures. The samples Ba8Ni0.4Zn7.0Ge38.7 and Ba8Ni0.5Zn6.9Ge38.6, revealing the maximum electrical resistivity of this set of samples, also have the most negative Seebeck values.
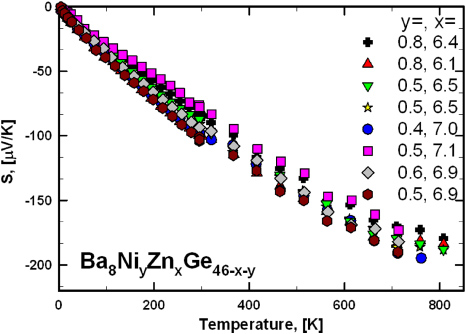
Figure 16. Seebeck coefficients as a function of temperature in the range 4.2–800 K for Ba8NiyZnxGe46−x−y.
Download figure:
Standard imageThe temperature-dependent thermal conductivity, λ, from 4.2 to 670 K is displayed in figure 17. Common to all samples investigated is a low-temperature maximum of the thermal conductivity typically observed for crystalline materials with low defect concentrations. Nevertheless the absolute values of λ are rather low, predominantly due to the rattling effect, a well-known feature of cage compounds considered as PGEC-materials (phonon glass – electron crystal) [3]. A detailed study of the vibrational dynamics of the type-I Ba–Zn–Ge clathrate indeed revealed eigenmodes of Ba-atoms significantly contributing to the phonon spectral density at low energies (below 14 meV) [36]. In general, the position and magnitude of the low-temperature maximum of λ(T) depends on a subtle interplay of various interaction mechanisms and parameters. In order to disentangle these effects, determining the phonon contribution of the thermal conductivity, the low-temperature data were fitted to the Callaway model [37]. Applying the Wiedemann–Franz law allows one to separate the electron and phonon contribution of the thermal conductivity. Within the Callaway model the relaxation time of scattering processes can be described as a reciprocal sum
 of different scattering mechanisms:

with U denoting scattering by Umklapp processes, D by defects, B by boundaries, and el–ph scattering by electrons. A detailed analysis presented in [34] indeed revealed a much smaller influence of defect and boundary scattering for the sample Ba8Ni0.8Zn6.4Ge38.8 compared with the other samples. Figure 18 shows a least-squares fit of the Callaway model to the sample Ba8Ni0.8Zn6.4Ge38.8. An additional T3-term accounts for radiation losses inherent of the steady-state heat flow method. The minimal thermal conductivity, λmin (dashed line in figure 18), was estimated from the model of Cahill and Pohl [23], employing a Debye-temperature θD = 300 K, resulting in a room-temperature value of 5.7 mW cm−1 K−1, which is roughly half of the observed phonon contribution.

Figure 17. Temperature-dependent thermal conductivity, λ, in the range 4.2–670 K for Ba8NiyZnxGe46−x−y.
Download figure:
Standard image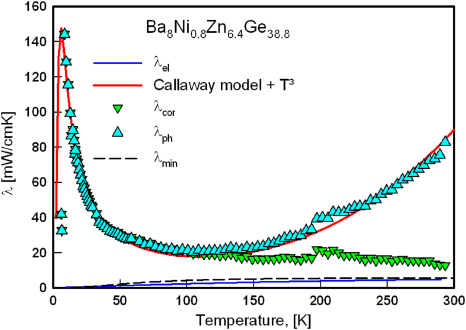
Figure 18. Low-temperature thermal conductivity of the sample Ba8Ni0.8Zn6.4Ge38.8. Phonon (λph) and electron (λel) are plotted. λcor denotes for the phonon thermal conductivity corrected by the radiation losses. The least-squares fit according to the model of Callaway and von Baeyer [37] is displayed as a red solid line. λmin was calculated according to the formalism of [23] using a Debye-temperature of 300 K.
Download figure:
Standard imageHall-effect measurements were carried out for three different samples, namely Ba8Ni0.8Zn6.4Ge38.8, Ba8Ni0.5Zn6.5Ge39.0 and Ba8Ni0.6Zn6.9Ge38.5. In agreement with the negative Seebeck coefficients the Hall data refer to electrons as the main charge carriers, and to an almost temperature-independent charge carrier density from 10 to 300 K, typical for metal-like behaviour (figure 7). Although the room temperature electrical resistivity is increasing from Ba8Ni0.8Zn6.4Ge38.8 (1257 µΩ cm) via Ba8Ni0.5Zn6.5Ge39.0 (1400 µΩ cm) to Ba8Ni0.6Zn6.9Ge38.5 (1758 µΩ cm), the charge carrier density is increasing as well in the same sequence. In comparison with the results for the ternary clathrate-I Ba8ZnxGe46−x the charge carrier density n is significantly reduced and does not vary too much with composition. Whereas for the ternary compounds an increase in the Zn-content by ∼0.4 atoms/unit cell leads to a reduction of n from −10.3 × 10²¹ to −3.2 × 1021 cm−3, compositional differences of the same order of magnitude in Ba8NiyZnxGe46−x−y with ynom = 1 cause almost no change in the carrier concentration. All samples, however, reveal a decrease in the charge carrier mobility with increasing temperature (figure 8). As the room-temperature mobility is decreasing from Ba8Ni0.8Zn6.4Ge38.8 and Ba8Ni0.5Zn6.5Ge39.0 to Ba8Ni0.6Zn6.9Ge38.5, the effective electron masses, calculated according to equation (1), exhibit a converse trend: m*(Ba8Ni0.8Zn6.4Ge38.8) = 4.4me, m*(Ba8Ni0.5Zn6.5Ge39.0) = 5.9me, m*(Ba8Ni0.6Zn6.9 Ge38.5) = 6.2me. Adding a small amount of Ni to the compound enhances substantially the mobility μ of the charge carriers and the effective mass is slightly smaller. Nevertheless all three samples exhibit a similar μ(T) behaviour as observed for the ternary samples Ba8Zn7.33Ge38.67 and Ba8Zn7.62Ge38.38 indicating that the same scattering mechanisms are present. At low temperatures the T-dependence is governed by neutral impurity scattering and above 100 K a T−1/2-dependence is observed, attributed to alloy scattering (shown by a black line in figure 8). At temperatures close to 300 K the decrease in the Hall-mobility is even more pronounced, indicating that another mechanism, the acoustic phonon scattering (μ ∝ T−3/2, displayed by the dashed black line in figure 8), is dominating the electron transport [24].
The thermoelectric figure of merit ZT as a function of temperature for all samples is displayed in figure 19. In general ZT is increasing with temperature, but taking into account the uncertainties and error bars of all data sets used for the evaluation of the thermoelectric figure of merit, it is difficult to gain a clear conclusion on the compositional dependence. The main reason for the lower ZT of some samples is the slightly higher thermal conductivity.
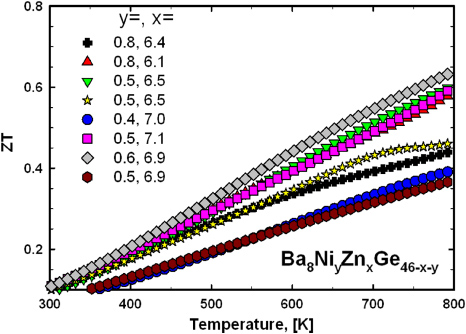
Figure 19. Thermoelectric figure of merit ZT as a function of temperature for Ba8NiyZnxGe46−x−y.
Download figure:
Standard imageThe improvement of the absolute values of ZT (0.65 at 800 K) in comparison with the ternary Ba8ZnxGe46−x clathrates (ZT = 0.40 at 800 K for Ba8Zn7.78Ge38.22) can be attributed to both a slight increase in the PF (S2/ρ) and a smaller thermal conductivity. All results of the physical property measurements as well as the fitting results (two-band model) are listed in table 4.
3.2.3. Thermoelectric properties of Ba8NiyZnxGe46−x−y with ynom = 3
The temperature dependence of the electrical resistivity of all samples was investigated in the temperature range from 300 to 850 K (figure 20). All samples of this series exhibit a pronounced maximum shifting towards lower temperatures with increasing resistivity. As the temperature regions of the rise and descent of resistivity are sufficiently determined within the investigated range, the two-band model, including a Mott–Jones term described in section 3.2.2, can be applied. Results infer that the band gap is of the same order of magnitude as for the samples Ba8NiyZnxGe46−x−y with ynom = 1, but in most cases it is well below 4000 K (0.34 eV). The size of the band gap increases as the absolute resistivity decreases and the maximum is shifted to higher temperatures: Ba8Ni2.8Zn2.4Ge40.8 with a gap of 3590 K (0.31 eV), Ba8Ni2.3Zn3.2Ge40.5 3870 K (0.33 eV), Ba8Ni2.4Zn3.6Ge40 3910 K (0.34 eV), Ba8Ni2.8Zn1.5Ge41.7 3930 K (0.34 eV) and Ba8Ni2.9Zn1.2Ge41.9 with a gap of 4310 K (0.37 eV), respectively. It is interesting to note that according to the fit, the Fermi-level of this set of samples is located much closer to the band gap compared with Ba8NiyZnxGe46−x−y with ynom = 1, which seems to be the main reason, why a maximum of ρ(T) is found already at temperatures around 500 to 600 K, whereas for the other two series of samples investigated in this work no features like this can be explored below ∼800 K. The Debye-temperatures extracted from the fits show larger scatter and range as compared with the samples with smaller Ni-content (table 4) between 211 K (Ba8Ni2.4Zn3.6Ge40) and 380 K (Ba8Ni2.8Zn2.4Ge40.8).
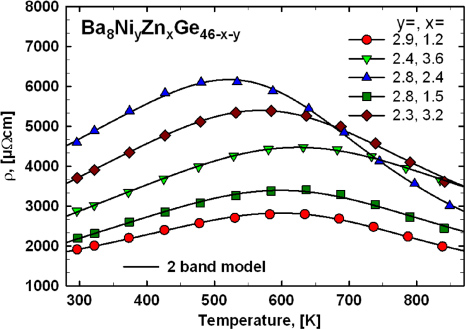
Figure 20. Temperature dependence of the electrical resistivity for the samples Ba8NiyZnxGe46−x−y (with ynom = 3). The solid black lines display fits according to the two-band model described in the text.
Download figure:
Standard imageFor the two samples with the largest (Ba8Ni2.8Zn2.4Ge40.8) and smallest (Ba8Ni2.9Zn1.2Ge41.9) electrical resistivities, data were also measured down to 4.2 K. The results for the entire temperature range investigated are plotted in figure 21. The two-band model shows very good agreement with the measured data; only the logarithmic rise observed below 40 K (similar to the observations in the series Ba8NiyZnxGe46−x−y (with ynom = 1)) cannot be described. This increase in resistivity is much more pronounced for Ba8Ni2.8Zn2.4Ge40.8, whereas the electrical resistivity of Ba8Ni2.9Zn1.2Ge41.9 increases only by less than 10 µΩ cm within the temperature range below 15 K. Ba8Ni2.8Zn2.4Ge40.8 exhibits a more dramatic change: starting at 40 K the resistivity increases by more than 100 µΩ cm to 4.2 K (figure 15).
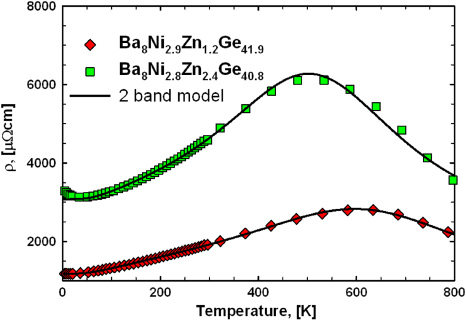
Figure 21. Electrical resistivity as a function of temperature from 4.2 to 800 K for the samples Ba8Ni2.9Zn1.2Ge41.9 and Ba8Ni2.8Zn2.4Ge40.8. The black solid line shows the fit results to the two-band model.
Download figure:
Standard imageSeebeck coefficients (S) of all samples were measured from 300 to 850 K and are displayed in figure 22. Similarly for electrical resistivity the Seebeck data also exhibit maxima, but the corresponding temperature is shifted to lower values. At 300 K the absolute values of the Seebeck coefficient of the various samples are increasing in the same sequence as the electrical resistivity does and exhibit negative values in the whole temperature range investigated.

Figure 22. Seebeck coefficients as a function of temperature for Ba8NiyZnxGe46−x−y (with ynom = 3).
Download figure:
Standard imageAccording to [38], a maximum in the Seebeck coefficient (Smax) can be used to estimate the band gap of semiconductors:

Eg is the band gap, e the elementary charge and Tmax is the temperature at the maximum of S. An analysis of the data using equation (3) reveals significantly smaller band gaps compared with the fitting results of the electrical resistivity. Whereas the Seebeck values suggest band gaps in the range 1926–2530 K (0.17–0.22 eV), the two-band model applied to the resistivity data revealed band gaps with an almost two times larger width (see also table 4). At least, also within this analysis the sample Ba8Ni2.8Zn2.4Ge40.8 exhibits the smallest gap width.
The thermal conductivity of all samples was investigated in the temperature range from 420 to 820 K. The results are shown in figure 23. All samples show a rather uncommon increase in the total thermal conductivity λtot with temperature, whereas the ternary clathrates Ba8ZnxGe46−x and the quaternary series Ba8NiyZnxGe46−x−y with ynom = 1 exhibit an almost constant thermal conductivity above room temperature. Another interesting observation is that λtot of the two samples with the lowest Ni-content, Ba8Ni2.4Zn3.6Ge40 and Ba8Ni2.3Zn3.2Ge40.5, is significantly lower than for the other samples. Separating the phonon (λph) and electron (λel) contributions applying the Wiedemann–Franz law (see figure 23) indicates that the increase in λ(T) can be partially attributed to an increase in λel, as the electrical resistivity is decreasing after passing through a maximum. Interestingly, the remaining part of the thermal conductivity, denoted in figure 23 as λph, still exhibits an increase at elevated temperatures. As the phonon thermal conductivity, in general, should decrease with increasing temperature, this additional contribution is presumably caused by a bipolar effect. This bipolar thermodiffusion effect causes an additional contribution to the electronic thermal conductivity, whenever there are different types of charge carriers present in a certain material [39]. The presence of a sufficiently large amount of holes as charge carriers at temperatures above 500 K is also established by the decrease of both, electrical resistivity and Seebeck coefficient above this temperature.
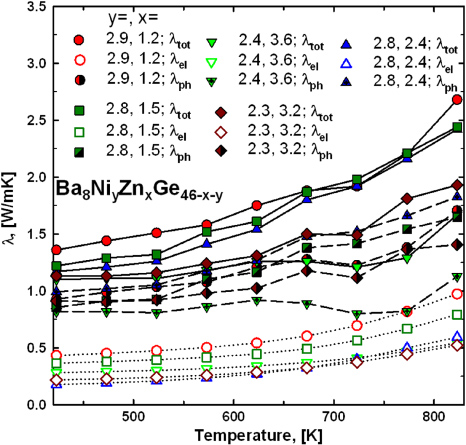
Figure 23. Thermal conductivity as a function of temperature for Ba8NiyZnxGe46−x−y (with ynom = 3). The electron contribution λel was calculated via the Wiedemann–Franz law (open symbols).
Download figure:
Standard imageThe thermoelectric figure of merit ZT as a function of temperature, shown in figure 24, also exhibits a maximum, which follows the drop in the absolute Seebeck coefficients at higher temperatures and the increase in the thermal conductivity, as both cannot be compensated by the decrease in the electrical resistivity. Interestingly the sample Ba8Ni2.4Zn3.6Ge40 with a small Ni-content reaches the highest ZT of 0.41 at 570 K. Although this value is not higher than the maximum ZT in Ba8ZnxGe46−x, the thermoelectric figure of merit at this temperature is slightly improved, as ZT for the ternary samples does not exceed values of 0.3 at 570 K. Thermoelectric properties at 700 K and band gaps as well as Debye-temperatures of all samples are listed in table 4.

Figure 24. Thermoelectric figure of merit ZT as a function of temperature for Ba8NiyZnxGe46−x−y (with ynom = 3). Lines represent the calculated ZT according to least-squares fits to ρ, S and λ.
Download figure:
Standard image4. Conclusions
The thermoelectric properties of Ba8ZnxGe46−x were investigated in detail close to the charge-balanced composition Ba8Zn8Ge38. A shift from metallic-like to semiconducting behaviour was observed for an increasing Zn-content. An evaluation of the thermoelectric potential as a function of the composition was performed, and revealed a maximum ZT of 0.46 at 730 K for the most favourable composition Ba8Zn7.7Ge38.3. A small amount of Ni incorporated into the clathrate-I framework can significantly improve the ZT to 0.65 at 800 K, as the additional nickel slightly enhances the PF. Hall-effect measurements revealed an increase in mobility and a slight decrease in the effective mass caused by the small amount of Ni inside the structure. Nevertheless, the incorporation of 2.5 to 2.9 atoms of Ni/u.c. did not further improve the thermoelectric figure of merit as the Seebeck coefficients |S| significantly drop down above 500 to 600 K, while the thermal conductivity increases. In all three series of samples only n-type conductivity is observed.
Comparing the results for the three sets of samples of the present investigation with the literature data, where ZT-values exceeding 1 are reported for Ba8Ga16Ge30 single crystalline [40] and Ba8Ni0.31Zn0.52Ga13.06Ge32.2 polycrystalline samples [41], reveals one interesting result. Whereas the thermal conductivity of all samples is close to 1.5 W mK−1 in all cases, the Ga-containing samples exhibit a much smaller electrical resistivity (<2000 µΩ cm at 700 K), but only slightly smaller absolute Seebeck coefficients of ∼−150 µV K−1 at 700 K. In contrast to these results recent publications on single crystalline Ba8Ga16Sn30 type VIII clathrates doped with Al [42] or Cu [43] reaching ZTs of 1.2 (for Ba8Ga10Al6Sn30 at 500 K) and 1.35 (for Ba8Ga16−xCuxSn30 with x = 0.033 at 540 K), respectively, demonstrated that a lower thermal conductivity (∼0.8 W mK−1) and high S-values (−300 µV K−1) are well feasible to achieve a good thermoelectric performance even for samples with resistivities higher than 5000 µΩ cm at 600 K.
Thus, further substitution to either enhance the electrical conductivity while keeping the Seebeck coefficients and thermal conductivity almost constant or to reduce the thermal conductivity via introducing even more disorder to the framework is required to drive the thermoelectric potential of Ba8ZnxGe46−x into an interesting range.