


ABSTRACT
We present the results of a search for high proper motion white dwarfs in the deep survey of the Canada–France–Hawaii Telescope Legacy Survey (CFHTLS). The CFHTLS Deep Survey covers 4 deg2 in five filters (u*, g', r', i', and z'). For the first and the fourth fields, we use data for a 5 year baseline from 2004 to 2009. For the second and the third fields, we have a 4 year baseline from 2004 to 2008. Proper motion selection is used to distinguish cool high-velocity white dwarfs from distant objects with similar blue colors such as compact faint galaxies and quasars. We discovered 44 white dwarf candidates brighter than g' = 24 on the basis of their spectral energy distribution and reduced proper motions. We found one white dwarf candidate with effective temperature less than 4000 K. From its estimated tangential velocity of 31 km s−1 and a distance of 124 pc, it appears to be located in the thin or thick disk of the Galaxy. We also find five candidates having Teff between 4000 K and 5000 K. One candidate in D2 with effective temperature of 5000 K and tangential velocity of 190 km s−1 indicates that it could be in the thick disk or in the halo. The other four candidates are likely located in the thin disk because of their estimated distances and tangential velocity.
Export citation and abstract BibTeX RIS
1. INTRODUCTION
High proper motion objects can be used to investigate the stellar populations in, and the formation of, the Galaxy. A deep survey allows for detection of low-luminosity objects, such as red dwarfs, subdwarfs, white dwarfs, and ultracool white dwarfs. We focus on the ultracool white dwarf with the effective temperature (Teff) below ∼4000 K search in this paper.
White dwarfs are the last stage of stellar evolution for the majority of stars, and the age of the Galaxy can be constrained by the coolest white dwarfs (Leggett et al. 1998; Hansen et al. 2004, 2007; Harris et al. 2006; Richer et al. 2006; Kilic et al. 2010). The old halo white dwarfs are the only way to get at the high-mass end of the Population II initial mass function. This is very important and can tell us about early chemical enrichment processes in the Galaxy.
White dwarf models (Bergeron et al. 1995a; Hansen 1998, 1999; Saumon & Jacobson 1999) suggest that cool white dwarfs (Teff below ∼5000 K) with hydrogen-rich atmospheres would exhibit strong collisionally induced opacity in the red and near-IR. Because of this, old H-rich white dwarfs are blue in optical colors with Teff below about 4000 K. From the cooling track (Richer et al. 2000), 12 Gyr, 0.5 solar mass white dwarfs can be detected at Mv ∼ 17.0. Richer et al. (2006) found this blue hook feature in the color–magnitude diagram (CMD) of NGC 6397. The observations show general agreement with white dwarf cooling models. Collision-induced absorption makes the ultracool white dwarfs detectable (Bergeron et al. 1994; Hambly et al. 1997; Harris et al. 1999, 2001, 2008; Oppenheimer et al. 2001; Gates et al. 2004; Farihi 2004; Richer et al. 2006; Hansen et al. 2007; Vidrih et al. 2007).
The number of ultracool white dwarfs (Teff below ∼4000 K) known with high tangential velocity (VT > 160 km s−1) is around 50 (Liebert et al. 1988; Harris et al. 2001, 2008; Gates et al. 2004; Vidrih et al. 2007; Hall et al. 2008; Rowell et al. 2008). Munn et al. (2004) provide proper motions with an accuracy of 3.5 mas  using the Sloan Digital Sky Survey (SDSS) data and USNO-B. Based on the SDSS and USNO-B data, Harris et al. (2006) have discovered around 6000 cool white dwarfs. Kilic et al. (2010) study 126 cool white dwarfs obtained from SDSS to derive a Galactic disk age of 8 Gyr, and a few ultracool white dwarfs may have ages about 12–13 Gyr. Moreover, about 10,000 white dwarf candidates have been presented from the SuperCOSMOS Sky Survey (Rowell & Hambly 2011). Pan-STARRS1 also finds 47 white dwarf candidates based on a 2 year baseline proper motion and five colors in 12 Medium–Deep Survey fields (Tonry et al. 2012). The field of view of one Medium–Deep Field is approximately 7 deg2.
The current investigation is a search for high proper motion objects using Canada–France–Hawaii Telescope (CFHT) data in order to identify halo white dwarf candidates. The limiting magnitude reaches 24, about 2 mag fainter than SDSS. Limboz et al. (2008) have found 28 white dwarf candidates in the same fields from colors alone, and 8 of them have been confirmed by spectroscopy. Among our 44 white dwarf candidates, 6 of them are in the white dwarf list of Table 2 in Limboz et al. (2008) and 2 of them are spectroscopically confirmed.
The observations and data reduction are presented in Section 2. The method of selecting the candidates is presented in Section 3. We discuss the results in Section 4. The conclusions are presented in Section 5.
2. OBSERVATIONS AND IMAGE PROCESSING
The data were collected using MegaCam at CFHT and are mostly the same images used for the CFHTLS (Canada–France–Hawaii Telescope Legacy Survey) deep survey. The survey covers 4 deg2 (D1, D2, D3, and D4) with five filters, u*, g', r', i', and z'. The MEGACAM camera contains 36 CCDs with 2048 × 4612 pixels, and the pixel size is 0.185 arcsec. The deep survey was completed in 2008. We obtained one more epoch in 2009 for the D1 and D4 fields using just g'—a single filter was used because we just wanted proper motions. We use the data in g' from 2004 and 2008 as two epochs in D2 and D3 for proper motion detection.
The MegaCam image stacking pipeline is used for the image processing. Details of the pipeline are described in Gwyn (2008). The pipeline includes the Elixir pipeline (Magnier & Cuillandre 2004) for world coordinate system (WCS), SWarp (Bertin et al. 2002) for the image stacking, and SExtractor (Bertin & Arnouts 1996) for the catalog generation. We have transferred magnitudes obtained from CFHT to the SDSS system for better comparison with that survey.
For the astrometric calibration, stars and compact galaxies with well-defined centers are selected first in each frame. This catalog is cleaned of cosmic rays and extended objects. The catalogs are shifted in R.A. and decl. with respect to one another until the best match between the two catalogs is found. Typically, 20–50 sources per CCD are found with this initial matching. As the accuracy of the WCS improves, the observed and reference catalogs are compared again to increase the number of matching sources. A larger number of matching sources makes the astrometric solution more robust against possible errors (proper motions, spurious detections, etc.) in either catalog. The positional accuracy for the stacked images (one epoch) in astrometry is 0 04 (Gwyn 2008).
The differential atmospheric refraction is potentially an issue for the astrometric accuracy. To test its influence, we compared the proper motion of objects obtained by CFHT with USNOB1 in the colors g' − r' and B − R. We selected objects brighter than 18th mag in g' and having proper motion and color information in USNOB1. In the D1, D2, D3, and D4 fields, we cross-identified 120, 201, 173, and 328 objects, respectively. The standard deviations of the difference in proper motion for these objects in the two catalogs in the four fields are 7.5 mas yr−1, 6.2 mas yr−1, 6.0 mas yr−1, and 7.4 mas yr−1. There is no obvious trend along with the color. It should be noted that 75% of the tested objects in CFHT have larger proper motion than those provided by USNOB1.
Figure 1 shows the typical position dispersion as a function of magnitude for two epochs for the four fields. The position dispersion is calculated from selected non-moving objects. Objects that move less than 2σ in the two epochs are taken as non-moving objects (this means 2σ in Figure 3.) In this case, objects with small proper motion would be selected to calculate the typical position dispersion. For objects brighter than 22nd mag, we set a bin size of 1 mag for accumulating enough stars to obtain the typical standard deviation. For objects fainter than 22nd mag, the bin size is set to be 0.1 mag. We use the position dispersion to be the proper motion error for all objects. The position dispersion is dependent on magnitude. The position dispersion is relatively small in the magnitudes of 22–24 mag. The white dwarf candidates are also presented in Figure 1. We list the position dispersion of candidates in two epochs in Table 1.

Figure 1. Position dispersion for different fields in two epochs. The dispersions for candidates are marked as red squares.
Download figure:
Standard image High-resolution imageTable 1. The Position Dispersion of Candidates in Two Epochs
| R.A. | Decl. | Magnitude (g) | Dispersion (R.A.) | Dispersion (Decl.) |
|---|---|---|---|---|
| (J2000) | (J2000) | (mag) | (mas) | (mas) |
| 02 24 09.66 | −04 03 44.0 | 22.754 ± 0.0140 | 40 | 37 |
| 02 24 28.46 | −04 43 36.2 | 21.913 ± 0.0090 | 44 | 38 |
| 02 24 46.44 | −04 33 44.7 | 20.781 ± 0.0030 | 43 | 37 |
| 02 24 47.31 | −04 35 51.8 | 22.127 ± 0.0090 | 48 | 39 |
| 02 24 48.55 | −04 52 01.3 | 22.077 ± 0.0090 | 44 | 34 |
| 02 25 13.50 | −04 53 29.0 | 22.648 ± 0.0150 | 40 | 33 |
| 02 25 14.10 | −04 29 54.6 | 23.557 ± 0.0390 | 41 | 33 |
| 02 25 18.71 | −04 38 01.1 | 21.656 ± 0.0060 | 45 | 37 |
| 02 25 46.22 | −04 31 32.4 | 21.736 ± 0.0080 | 44 | 38 |
| 02 25 58.19 | −04 02 36.5 | 19.543 ± 0.0010 | 42 | 39 |
| 02 26 02.16 | −04 42 33.8 | 22.462 ± 0.0120 | 45 | 36 |
| 02 26 07.54 | −04 59 13.3 | 23.303 ± 0.0260 | 36 | 33 |
| 02 27 34.27 | −04 50 56.7 | 23.251 ± 0.0260 | 37 | 34 |
| 02 27 46.39 | −04 21 09.3 | 19.838 ± 0.0010 | 41 | 37 |
| 09 58 33.50 | 02 07 35.5 | 21.947 ± 0.0120 | 27 | 27 |
| 09 59 09.57 | 02 35 38.2 | 20.885 ± 0.0040 | 26 | 25 |
| 09 59 19.86 | 01 45 07.1 | 20.570 ± 0.0030 | 26 | 25 |
| 09 59 28.44 | 01 49 00.5 | 21.287 ± 0.0060 | 26 | 25 |
| 09 59 41.62 | 02 07 00.1 | 20.197 ± 0.0020 | 25 | 27 |
| 10 00 00.84 | 02 31 02.5 | 23.897 ± 0.0680 | 33 | 32 |
| 10 00 05.64 | 01 58 59.0 | 19.994 ± 0.0020 | 26 | 27 |
| 10 00 10.59 | 02 11 45.0 | 21.761 ± 0.0090 | 27 | 27 |
| 10 00 34.08 | 01 48 14.5 | 22.253 ± 0.0150 | 23 | 25 |
| 10 00 48.47 | 02 33 56.2 | 20.816 ± 0.0040 | 26 | 24 |
| 10 00 49.66 | 02 22 17.0 | 19.325 ± 0.0010 | 25 | 26 |
| 14 17 24.09 | 52 52 27.7 | 19.385 ± 0.0010 | 59 | 33 |
| 14 18 00.77 | 52 24 39.2 | 19.471 ± 0.0010 | 60 | 33 |
| 14 18 23.00 | 53 07 21.9 | 22.265 ± 0.0160 | 51 | 32 |
| 14 19 00.85 | 52 43 54.7 | 21.515 ± 0.0080 | 60 | 30 |
| 14 21 49.42 | 52 49 20.6 | 21.697 ± 0.0080 | 59 | 31 |
| 22 13 33.83 | −17 57 16.1 | 22.892 ± 0.0210 | 41 | 39 |
| 22 13 51.98 | −17 28 05.8 | 22.303 ± 0.0160 | 45 | 35 |
| 22 13 53.39 | −17 52 03.0 | 20.855 ± 0.0040 | 44 | 36 |
| 22 14 01.79 | −17 39 07.6 | 21.771 ± 0.0070 | 46 | 39 |
| 22 14 20.53 | −17 57 21.2 | 21.326 ± 0.0060 | 45 | 37 |
| 22 14 42.46 | −18 06 46.0 | 22.238 ± 0.0110 | 48 | 39 |
| 22 14 49.48 | −18 10 06.8 | 20.058 ± 0.0010 | 44 | 37 |
| 22 15 22.40 | −18 13 01.5 | 22.433 ± 0.0120 | 45 | 35 |
| 22 15 23.40 | −17 44 31.0 | 22.751 ± 0.0190 | 43 | 38 |
| 22 15 27.01 | −17 33 53.2 | 23.074 ± 0.0240 | 39 | 37 |
| 22 15 34.95 | −17 20 42.3 | 22.565 ± 0.0140 | 43 | 41 |
| 22 15 46.33 | −17 22 15.0 | 23.080 ± 0.0250 | 39 | 37 |
| 22 17 07.09 | −17 49 18.3 | 19.513 ± 0.0010 | 43 | 36 |
| 22 17 07.17 | −17 44 09.1 | 22.435 ± 0.0160 | 45 | 36 |
Download table as: ASCIITypeset image
The astrometric accuracy for all objects (including moving objects) of the proper motion between two epochs is 40 mas for D1 and 47 mas for D4 over a 5 year baseline in g' band. For D2 and D3, the astrometric accuracy is 27 mas and 37 mas, respectively, in a 4 year baseline at g' = 24. The photometric error is 0.1 mag at g' = 24.
3. CANDIDATE SELECTION
Around 0.2 million objects appeared in each epoch in 1 deg2 in g' band of the CFHT survey. We excluded cosmic rays and galaxies roughly by using flux radius. The half-light radius is the radius containing half of the object's flux. Schultheis et al. (2006) and Limboz et al. (2008) used the half-light radius obtained by SExtractor (Bertin & Arnouts 1996) to separate stars and galaxies. The half-light radii of galaxies or extended sources are larger than those of stars. Figure 2 shows an example of the half-light radius for D1 in 2004. The magnitude here is aperture magnitude in the g band in the CFHT system. We select stars having half-light radii between 2.2 and 3 shown as the solid lines in Figure 2. Stars in different fields and in different filters have slightly different values of half-light radius. However, for faint objects, it is hard to separate point-like sources and extended sources by their half-light radius. We only use this method for reducing the number of objects. About 0.1 million objects remained as stars in each square degree in the g' band.
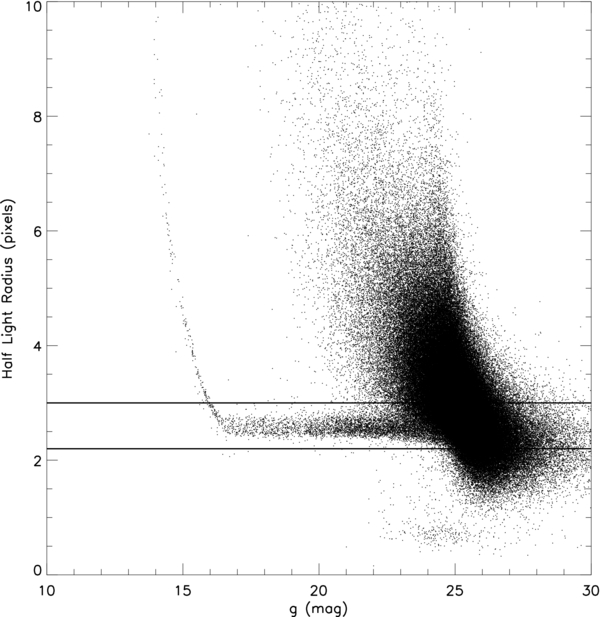
Figure 2. Example of the half-light radius for D1 in 2004. The magnitude here is aperture magnitude in the g band in the CFHT system. We select stars having a half-light radius between 2.2 and 3 pixels (solid lines).
Download figure:
Standard image High-resolution imageWhite dwarf candidate selection is based on the proper motion, the spectral energy distribution (SED), and the locus in the reduced proper motion diagram (RPMD). Stars appearing in two epochs and five bands were selected. We also compared the loci of candidates with a cooling track in the color–color diagrams. Finally, we checked the images of white dwarf candidates by eye and compared them with previous studies. Candidates that have been contaminated by surrounding objects and have been identified as QSOs or galaxies are excluded from the final candidate list. In the end, we have selected 44 white dwarf candidates.
3.1. Proper Motion
High proper motion candidates were selected by the object moving greater than four standard deviations over two epochs. We cross-identified objects in the two epochs. A radius of 10 pixels (1.8 arcsec) is used to match stars. This sets the upper limit of the proper motion object selection. If an object moves more than 10 pixels over the two epochs, we would not find it. The object would be considered two objects. A limiting magnitude of 24 is set. For the SED fitting, we only accept objects observed in all five filters.
Figure 3 shows an example in D1 of the positional differences in x and y for each star in the two epochs. The radius of the circle is 4σ of a Gaussian fit to the proper motion distribution. We select objects located outside the 4σ circle. This means that, for example, in the D1 field we selected objects that moved more than 0.87 pixel (0160, 4σ) in 5 years as the first level of selection. The radii of the 4σ circles in the four fields are between ∼27 mas yr−1 and ∼37 mas yr−1. Four sigma values for all the fields are shown in Table 2. The baselines for D1 and D4 are 5 years, so the 4σ limits are larger than in D2 and D3, which have 4 year baselines. The number of objects that moved more than 4σ over the two epochs and are brighter than 24 mag and appeared in all five filters are 109, 127, 82, and 157, respectively, for four fields.
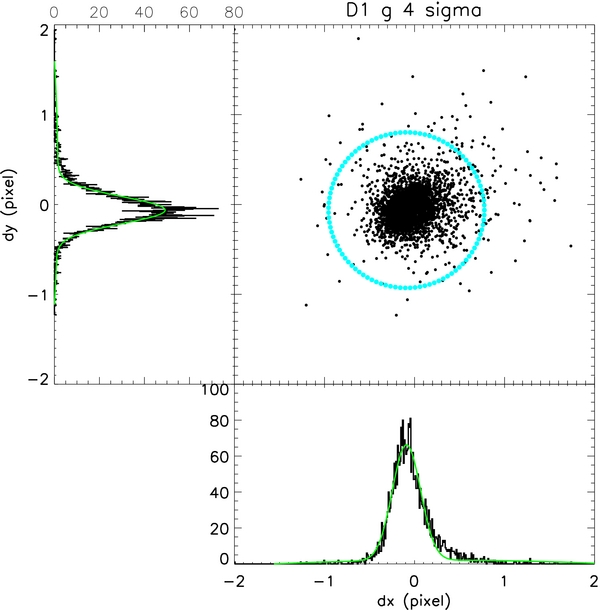
Figure 3. Gaussian fitting of the moving of objects in D1. The circle has a radius of 0.87 pixels. The radii of 4σ circles for D2, D3, and D4 are 0.58, 0.81, and 1.02 pixels, respectively.
Download figure:
Standard image High-resolution imageTable 2. Observation Information
| Star Field | R.A. and Decl. | Year of the | Four Sigma | Number of Objects Moving |
|---|---|---|---|---|
| J2000 | Observation | in Two Epochs (arcsec) | More Than 4σ | |
| D1 | 02:26:00 | 2004 and 2009 | 0.160 | 109 |
| −04:30:00 | (5 years) | |||
| D2 | 10:00:29 | 2004 and 2008 | 0.107 | 127 |
| +02:12:21 | (4 years) | |||
| D3 | 14:17:54 | 2004 and 2008 | 0.149 | 82 |
| +52:30:31 | (4 years) | |||
| D4 | 22:15:31 | 2004 and 2009 | 0.188 | 157 |
| −17:44:05 | (5 years) |
Download table as: ASCIITypeset image
3.2. Spectral Energy Distribution
In order to classify the proper motion selected candidates, we fit their magnitudes in five bands, u', g, r, i, and z, with the SEDs of white dwarfs, subdwarfs, and main-sequence stars. The SED models are from Bergeron et al. (1995b), Holberg & Bergeron (2006), Kowalski & Saumon (2006), Tremblay et al. (2011), and Bergeron et al. (2011) for white dwarfs, West et al. (2004), Adelman-McCarthy et al. (2007), and Adelman-McCarthy et al. (2008) for subdwarfs, and Covey et al. (2007) for the main sequence.
We used only pure hydrogen atmosphere white dwarf (DA-type) models with 0.6 solar masses. The Teff range in the white dwarf models is from 1500 K to 110,000 K, and log g is from 8.040 to 7.168. For the Teff less than 5500 K, the grid size is 250 K. For the Teff greater than 5500 k, the grid point is 500 K. The ages of the white dwarfs cover a range from 1.47 × 10¹⁰ to 2.47 × 10⁴ years. For the main-sequence models, we used synthetic SDSS/Two Micron All Sky Survey photometry for A0 to M6 in Table 3 from Covey et al. (2007). The subdwarf template is taken from the subdwarf list in Table 2 in West et al. (2004); however, this table does not have u* information. Adelman-McCarthy et al. (2007) and Adelman-McCarthy et al. (2008) provide complete magnitudes for these subdwarfs for all five filters. Therefore, we take these magnitudes as the subdwarf templates.
We determine a minimum chi-square (χ2) for each proper motion selected star magnitude in all five filters and SED models that contain 57 different temperatures for white dwarfs, 17 subdwarf templates, and 28 different spectral types of main-sequence stars. The templates do not include all types of stars. We take stars having fitting probability greater than 99.7% confidence level. The SEDs are normalized by shifting the observed g' to the synthetic g' or the observed r' to the synthetic r'. We accept a better fitting (smaller χ2) between g' and r' for the shifting and then apply the appropriate observed colors for the other filters. We also select objects having propagated errors on different two colors (u* − g', g' − r', r' − i', and i' − z') less than 0.5 mag. Many objects fit well in g', r', and i' bands, but some of them do not fit well in the u* band. We reject objects having a difference between observed u* and the synthetic u* greater than 0.5 mag. With these selection criteria, most of the selected white dwarf candidates lie along the cooling sequences in the color–color diagrams and are located in the white dwarf region in the RPMD. Figure 4 is the SED fitting with pure hydrogen models of different temperature white dwarf candidates.
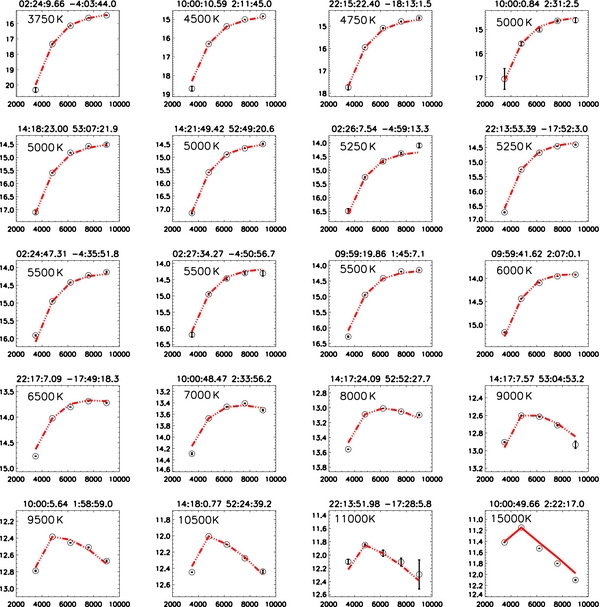
Figure 4. SED fitting with pure hydrogen model (Bergeron et al. 1995b, 2011; Holberg & Bergeron 2006; Kowalski & Saumon 2006; Tremblay et al. 2011) of selected white dwarf candidates with different Teff. The x-axis is wavelength and the y-axis is the absolute magnitude obtained from the model.
Download figure:
Standard image High-resolution imageWe use five bands to fit the SED and to obtain the temperature. It is difficult to have precise values from the five-band SED fitting only. The temperature error listed in Table 3 is derived form SED fitting. There are some temperature ranges having confidence levels greater than 99.7%. The ranges are quite large for hotter white dwarf candidates, but for cool white dwarfs, the ranges narrow down.
Table 3. White Dwarf Candidates Assuming 0.6 M☉
| R.A. | Decl. | μ R.A. | μ Decl. | u | g | r | i | z | Teff | Synthetic g | Distance | Vtan |
|---|---|---|---|---|---|---|---|---|---|---|---|---|
| (J2000) | (J2000) | (mas yr−1) | (mas yr−1) | (mag) | (mag) | (mag) | (mag) | (mag) | (K) | (mag) | (pc) | (km s−1) |
| 02 24 09.66 | −04 03 44.0 | 32 | −42 | 25.740 ± 0.1367 | 22.754 ± 0.0140 | 21.559 ± 0.0126 | 21.054 ± 0.0089 | 20.886 ± 0.0175 | 3750 |
17.281 | 124 |
31 |
| 02 24 28.46 | −04 43 36.2 | 18 | −23 | 23.078 ± 0.0238 | 21.913 ± 0.0090 | 21.476 ± 0.0150 | 21.284 ± 0.0153 | 21.154 ± 0.0299 | 6000 |
14.486 | 306 |
43 |
| 02 24 46.44 | −04 33 44.7 | −37 | 0 | 21.666 ± 0.0050 | 20.781 ± 0.0030 | 20.460 ± 0.0047 | 20.314 ± 0.0047 | 20.331 ± 0.0105 | 6000 |
14.370 | 192 |
34 |
| 02 24 47.31 | −04 35 51.8 | 33 | −19 | 23.088 ± 0.0181 | 22.127 ± 0.0090 | 21.599 ± 0.0134 | 21.396 ± 0.0126 | 21.306 ± 0.0261 | 5500 |
14.949 | 273 |
50 |
| 02 24 48.55 | −04 52 01.3 | −36 | 21 | 22.957 ± 0.0173 | 22.077 ± 0.0090 | 21.810 ± 0.0164 | 21.647 ± 0.0159 | 21.598 ± 0.0327 | 6500 |
14.009 | 411 |
82 |
| 02 25 13.50 | −04 53 29.0 | −31 | 32 | 23.536 ± 0.0280 | 22.648 ± 0.0150 | 22.240 ± 0.0243 | 22.096 ± 0.0239 | 21.870 ± 0.0432 | 6000 |
14.435 | 439 |
94 |
| 02 25 14.10 | −04 29 54.6 | 6 | −29 | 24.152 ± 0.0552 | 23.557 ± 0.0390 | 23.180 ± 0.0632 | 22.881 ± 0.0519 | 23.313 ± 0.1682 | 6500 |
14.021 | 808 |
114 |
| 02 25 18.71 | −04 38 01.1 | 12 | 32 | 22.980 ± 0.0169 | 21.656 ± 0.0060 | 21.138 ± 0.0096 | 20.887 ± 0.0090 | 20.818 ± 0.0192 | 5500 |
14.940 | 220 |
35 |
| 02 25 46.22 | −04 31 32.4 | −3 | 39 | 22.611 ± 0.0154 | 21.736 ± 0.0080 | 21.489 ± 0.0147 | 21.314 ± 0.0136 | 21.279 ± 0.0285 | 6500 |
13.989 | 354 |
67 |
| a 02 25 58.19 | −04 02 36.5 | 32 b (34) | 28 (18) | 19.994 ± 0.0012 | 19.543 ± 0.0010 | 19.813 ± 0.0026 | 20.046 ± 0.0038 | 20.331 ± 0.0102 | 11000 |
11.851 | 345 |
70 |
| 02 26 02.16 | −04 42 33.8 | 30 | −24 | 23.497 ± 0.0298 | 22.462 ± 0.0120 | 21.917 ± 0.0178 | 21.666 ± 0.0160 | 21.503 ± 0.0333 | 5500 |
14.949 | 318 |
60 |
| 02 26 07.54 | −04 59 13.3 | 47 | −22 | 24.538 ± 0.0866 | 23.303 ± 0.0260 | 22.721 ± 0.0416 | 22.437 ± 0.0377 | 22.145 ± 0.0659 | 5250 |
15.256 | 407 |
101 |
| 02 27 34.27 | −04 50 56.7 | −40 | 9 | 24.494 ± 0.0701 | 23.251 ± 0.0260 | 22.767 ± 0.0415 | 22.598 ± 0.0390 | 22.608 ± 0.0846 | 5500 |
14.949 | 458 |
91 |
| a 02 27 46.39 | −04 21 09.3 | 30 | 8 | 19.899 ± 0.0012 | 19.838 ± 0.0010 | 20.003 ± 0.0031 | 20.154 ± 0.0041 | 20.384 ± 0.0108 | 17000 |
10.886 | 617 |
90 |
| 09 58 33.50 | 02 07 35.5 | 10 | 28 | 22.727 ± 0.0459 | 21.947 ± 0.0120 | 21.735 ± 0.0134 | 21.686 ± 0.0141 | 21.708 ± 0.0347 | 7000 |
13.687 | 449 |
65 |
| 09 59 09.57 | 02 35 38.2 | 20 (36) | −26 (−24) | 21.734 ± 0.0178 | 20.885 ± 0.0040 | 20.670 ± 0.0048 | 20.643 ± 0.0051 | 20.698 ± 0.0127 | 7000 |
13.689 | 275 |
44 |
| 09 59 19.86 | 01 45 07.1 | 14 (−2) | 25 (10) | 21.903 ± 0.0209 | 20.570 ± 0.0030 | 20.032 ± 0.0027 | 19.815 ± 0.0025 | 19.771 ± 0.0058 | 5500 |
14.949 | 133 |
19 |
| 09 59 28.44 | 01 49 00.5 | −21 | −20 | 21.868 ± 0.0206 | 21.287 ± 0.0060 | 21.329 ± 0.0092 | 21.390 ± 0.0101 | 21.483 ± 0.0284 | 9000 |
12.602 | 546 |
74 |
| 09 59 41.62 | 02 07 00.1 | −37 (−36) | −8 (−4) | 20.923 ± 0.0085 | 20.197 ± 0.0020 | 19.857 ± 0.0023 | 19.717 ± 0.0023 | 19.683 ± 0.0055 | 6000 |
14.389 | 145 |
27 |
| 10 00 00.84 | 02 31 02.5 | 61 | −54 | 25.361 ± 0.4335 | 23.897 ± 0.0680 | 23.314 ± 0.0561 | 22.949 ± 0.0431 | 22.921 ± 0.1044 | 5000 |
15.468 | 485 |
190 |
| a 10 00 05.64 | 01 58 59.0 | −53 (−72) | −6 (8) | 20.400 ± 0.0074 | 19.994 ± 0.0020 | 20.066 ± 0.0030 | 20.120 ± 0.0038 | 20.284 ± 0.0112 | 9500 |
12.348 | 338 |
87 |
| 10 00 10.59 | 02 11 45.0 | −17 | −46 | 24.149 ± 0.1244 | 21.761 ± 0.0090 | 20.823 ± 0.0056 | 20.457 ± 0.0043 | 20.286 ± 0.0096 | 4500 |
16.313 | 123 |
29 |
| 10 00 34.08 | 01 48 14.5 | −27 | −16 | 22.875 ± 0.0553 | 22.253 ± 0.0150 | 21.901 ± 0.0153 | 21.857 ± 0.0160 | 21.711 ± 0.0354 | 6500 |
14.021 | 443 |
69 |
| 10 00 48.47 | 02 33 56.2 | −28 | 17 | 21.437 ± 0.0154 | 20.816 ± 0.0040 | 20.614 ± 0.0048 | 20.554 ± 0.0049 | 20.673 ± 0.0132 | 7000 |
13.676 | 268 |
43 |
| a 10 00 49.66 | 02 22 17.0 | −34 (−36) | 1 (6) | 19.594 ± 0.0029 | 19.325 ± 0.0010 | 19.703 ± 0.0020 | 19.976 ± 0.0029 | 20.276 ± 0.0093 | 15000 |
11.152 | 431 |
71 |
| a 14 17 24.09 | 52 52 27.7 | −64 (−54) | 46 (42) | 19.855 ± 0.0021 | 19.385 ± 0.0010 | 19.306 ± 0.0013 | 19.348 ± 0.0018 | 19.394 ± 0.0089 | 8000 |
13.089 | 182 |
69 |
| a 14 18 00.77 | 52 24 39.2 | −33 (−14) | −41 (−46) | 19.913 ± 0.0025 | 19.471 ± 0.0010 | 19.572 ± 0.0020 | 19.741 ± 0.0030 | 19.906 ± 0.0173 | 10500 |
12.006 | 311 |
80 |
| 14 18 23.00 | 53 07 21.9 | −34 | −32 | 23.772 ± 0.0590 | 22.265 ± 0.0160 | 21.498 ± 0.0111 | 21.247 ± 0.0113 | 21.189 ± 0.0507 | 5000 |
15.590 | 216 |
48 |
| 14 19 00.85 | 52 43 54.7 | −54 | 8 | 22.228 ± 0.0195 | 21.515 ± 0.0080 | 21.530 ± 0.0108 | 21.658 ± 0.0159 | 21.814 ± 0.0898 | 9500 |
12.384 | 670 |
175 |
| 14 21 49.42 | 52 49 20.6 | 40 | −51 | 23.263 ± 0.0347 | 21.697 ± 0.0080 | 21.006 ± 0.0063 | 20.764 ± 0.0066 | 20.596 ± 0.0277 | 5000 |
15.576 | 168 |
53 |
| 22 13 33.83 | −17 57 16.1 | −10 | −35 | 23.427 ± 0.0682 | 22.892 ± 0.0210 | 22.707 ± 0.0501 | 22.729 ± 0.0586 | 22.712 ± 0.1577 | 7000 |
13.671 | 699 |
122 |
| 22 13 51.98 | −17 28 05.8 | −17 | −41 | 22.553 ± 0.0350 | 22.303 ± 0.0160 | 22.425 ± 0.0467 | 22.558 ± 0.0595 | 22.744 ± 0.2186 | 11000 |
11.855 | 1229 |
262 |
| 22 13 53.39 | −17 52 03.0 | −31 | −40 | 22.315 ± 0.0183 | 20.855 ± 0.0040 | 20.281 ± 0.0057 | 20.061 ± 0.0052 | 20.006 ± 0.0145 | 5250 |
15.219 | 134 |
32 |
| 22 14 01.79 | −17 39 07.6 | 37 | −11 | 22.545 ± 0.0279 | 21.771 ± 0.0070 | 21.477 ± 0.0140 | 21.359 ± 0.0138 | 21.326 ± 0.0398 | 6500 |
14.021 | 355 |
67 |
| 22 14 20.53 | −17 57 21.2 | −45 | −6 | 21.776 ± 0.0150 | 21.326 ± 0.0060 | 21.517 ± 0.0171 | 21.650 ± 0.0229 | 21.944 ± 0.0903 | 11000 |
11.851 | 785 |
175 |
| 22 14 42.46 | −18 06 46.0 | −39 | −16 | 23.160 ± 0.0441 | 22.238 ± 0.0110 | 21.957 ± 0.0222 | 21.803 ± 0.0210 | 21.983 ± 0.0728 | 6500 |
14.023 | 440 |
90 |
| 22 14 49.48 | −18 10 06.8 | −36 | 35 | 21.218 ± 0.0076 | 20.058 ± 0.0010 | 19.498 ± 0.0028 | 19.271 ± 0.0023 | 19.174 ± 0.0064 | 5500 |
14.949 | 105 |
25 |
| 22 15 22.40 | −18 13 01.5 | 23 | −31 | 24.224 ± 0.1162 | 22.433 ± 0.0120 | 21.573 ± 0.0172 | 21.274 ± 0.0155 | 21.119 ± 0.0375 | 4750 |
15.947 | 198 |
37 |
| 22 15 23.40 | −17 44 31.0 | 27 | 26 | 23.299 ± 0.0591 | 22.751 ± 0.0190 | 22.839 ± 0.0520 | 22.681 ± 0.0487 | 23.142 ± 0.2322 | 8500 |
12.837 | 961 |
172 |
| 22 15 27.01 | −17 33 53.2 | −48 | −10 | 23.659 ± 0.0778 | 23.074 ± 0.0240 | 22.847 ± 0.0505 | 22.547 ± 0.0412 | 22.865 ± 0.1707 | 6500 |
13.969 | 662 |
157 |
| 22 15 34.95 | −17 20 42.3 | 33 | 16 | 23.066 ± 0.0453 | 22.565 ± 0.0140 | 22.155 ± 0.0265 | 22.116 ± 0.0283 | 22.410 ± 0.1073 | 6500 |
14.152 | 482 |
86 |
| 22 15 46.33 | −17 22 15.0 | −43 | 26 | 23.862 ± 0.1020 | 23.080 ± 0.0250 | 22.934 ± 0.0571 | 22.687 ± 0.0503 | 22.511 ± 0.1254 | 7000 |
13.619 | 780 |
189 |
| 22 17 07.09 | −17 49 18.3 | 34 (−20) | −10 (14) | 20.256 ± 0.0034 | 19.513 ± 0.0010 | 19.294 ± 0.0023 | 19.180 ± 0.0023 | 19.213 ± 0.0069 | 6500 |
13.962 | 129 |
22 |
| 22 17 07.17 | −17 44 09.1 | 11 | −39 | 23.499 ± 0.0702 | 22.435 ± 0.0160 | 22.001 ± 0.0282 | 21.768 ± 0.0237 | 21.690 ± 0.0667 | 5500 |
14.949 | 314 |
62 |
Notes. aCandidates appear in the white dwarf list of Limboz et al. (2008). bValues inside parentheses are proper motions derived by USNO-B1.0 (Monet et al. 2003).
3.3. Reduced Proper Motion Diagram
The RPMD is similar to a CMD but is distance independent. The x-axis in the RPMD is observed color. The y-axis in this diagram is H = m + 5log μ + 5 = M + 5log vt − 3.379, where μ is the proper motion in seconds of arc per year, m is the apparent magnitude, M is the absolute magnitude, and vt is the tangential velocity in km s−1. White dwarfs, subdwarfs, and main-sequence stars would be separated if the astrometry and photometry were accurate and sufficiently precise in this diagram.
Figure 5 shows all objects in the four fields moving faster than three standard deviations. There are two groups in the diagram. A gap separates the white dwarfs and normal stars. The bottom left of the figure is the white dwarf region, and the top right is the region of main-sequence and subdwarf stars. All white dwarf candidates selected by their proper motion and SED are marked in different symbols by different Teff. Diamonds, triangles, and asterisks represent white dwarf candidates with Teff greater than 5500 K, Teff between 4000 K and 5500 K, and Teff less than 4000 K. These candidates are all isolated. Two dashed lines and the solid line show different Vtan of 20 km s−1, 40 km s−1, and 160 km s−1. These three lines are derived from one of the reduced proper motion equations, H = M + 5log vt − 3.379, as mentioned above. The coolest white dwarf candidate is marked as a blue asterisk located around the gap. Kilic et al. (2006) suggest that objects bluer than g − i = 0 or Hg > 15.136 + 2.727(g − i) should include all white dwarfs. In this region, they also found white dwarfs, white dwarf plus M dwarf binaries, subdwarfs, and QSOs identified by spectroscopic observations. We have 126 objects located in the white dwarf region in the RPMD. We only select stars with colors consistent with the DA model.
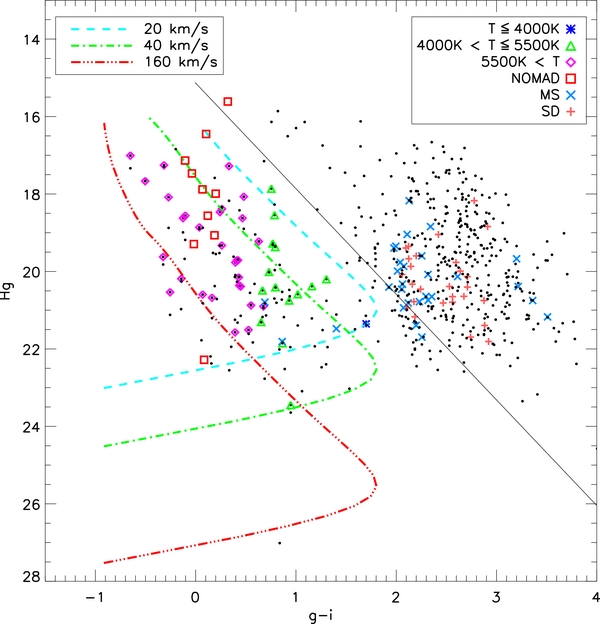
Figure 5. Reduced proper motion diagram for all candidates based on the 0.6 solar mass white dwarf model. Kilic et al. (2006) suggest that objects bluer than g − i = 0 or Hg > 15.136 + 2.727(g − i) (solid line) should include all white dwarfs. Candidates with different Teff regions are shown as different symbols. There are nine candidates that have proper motion values in the USNO-B1.0 catalog. Red squares present the loci of nine candidates with proper motion values provided by USNO-B1.0.
Download figure:
Standard image High-resolution image3.4. Color–Color Diagram
There is an overlap between the cooler end (∼8000 K) of white dwarfs and the main-sequence star locus (Fan 1999). However, cool white dwarfs with hydrogen-rich atmospheres exhibit strong collisionally induced opacity in the red and near-IR. Old hydrogen-rich white dwarfs are blue in optical colors. When the Teff is about 3000 K, the g − r color turns toward the blue at (u − g, g − r) ∼ (3.2, 1.5). The r − i color turns bluer around a Teff of 4000 K. We compare the loci of white dwarf candidates with the cooling sequences in various color–color diagrams. Different Teff are marked with different symbols in the figures. Dashed lines in these color–color diagrams are synthetic cooling sequences (Bergeron et al. 1995b; Tremblay et al. 2011). We found one white dwarf candidate having a photometric Teff ⩽ 4000 K, 14 candidates with 4000 K < Teff ⩽ 5500 K, and 29 candidates with Teff > 5500 K, shown with the asterisk, triangles, and diamonds, respectively, in Figures 6–8. Most candidates lie along the cooling sequences. Several candidates are offset in (i − z) because of their large photometric errors.
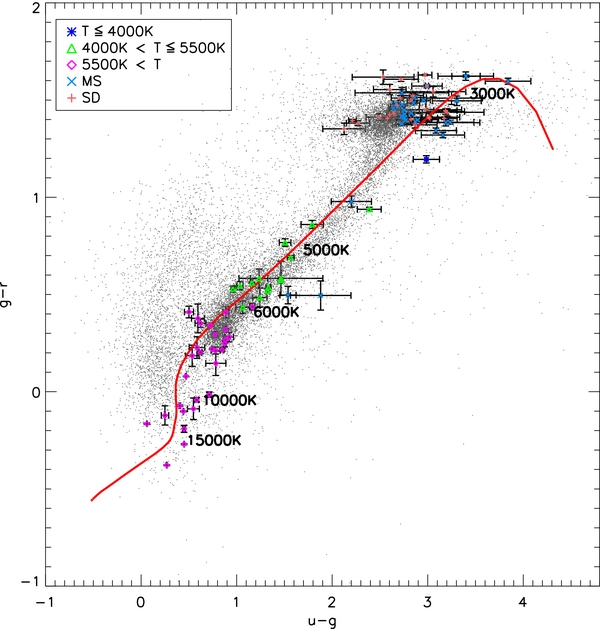
Figure 6. Color–color diagram (u − g, g − r) of stars in 4 deg2. When the Teff is about 3000 K, the g − r color turns toward the blue at (u − g, g − r) ∼ (3.2, 1.5). Different Teff of white dwarf candidates are marked with different symbols, which are the same as in Figure 5. The solid line in the color–color diagram is a synthetic DA cooling sequence (Bergeron et al. 1995b, 2011; Holberg & Bergeron 2006; Kowalski & Saumon 2006; Tremblay et al. 2011). The loci of 3000 K (3.22, 1.51), 5000 K (1.54, 0.71), 6000 K (0.81, 0.38), 10,000 K (0.37, −0.07), and 15,000 K (0.26, −0.27) are shown near the cooling sequence.
Download figure:
Standard image High-resolution image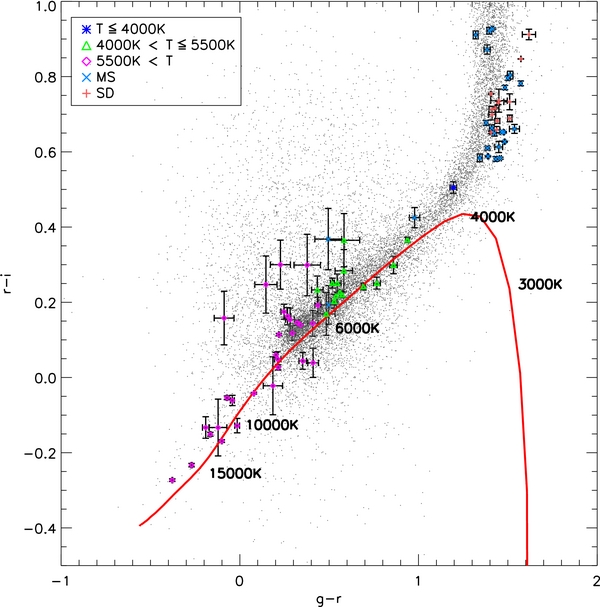
Figure 7. Color–color diagram (g − r, r − i) of stars in 4 deg2. The r − i color turns to bluer around a Teff of 4000 K. Different Teff are marked with different symbols, which are the same as in Figure 5. The solid line in the color–color diagram is a synthetic DA cooling sequence (Bergeron et al. 1995b, 2011; Holberg & Bergeron 2006; Kowalski & Saumon 2006; Tremblay et al. 2011). The loci of 3000 K (1.51, 0.24), 4000 K (1.15, 0.42), 6000 K (0.39, 0.12), 10,000 K (− 0.07, −0.14), and 15,000 K (− 0.27, −0.27) are shown near the cooling sequence.
Download figure:
Standard image High-resolution image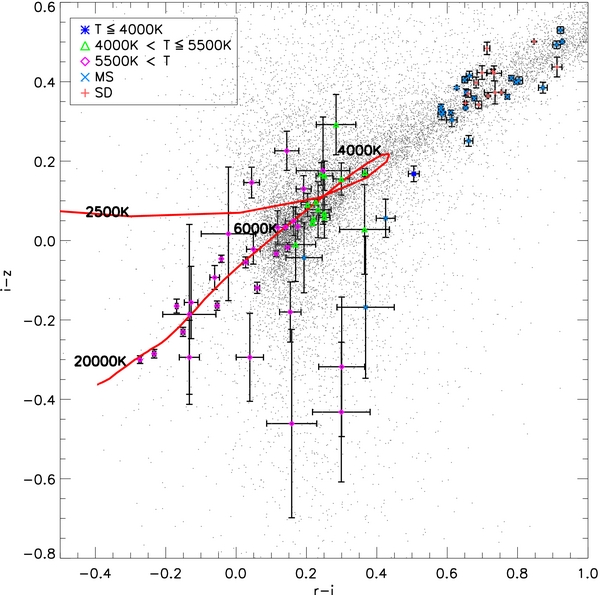
Figure 8. Color–color diagram (r − i, i − z) of stars in 4 deg2. Different Teff are marked with different symbols, which are the same as in Figure 5. The solid line in the color–color diagram is a synthetic DA cooling sequence (Bergeron et al. 1995b, 2011; Holberg & Bergeron 2006; Kowalski & Saumon 2006; Tremblay et al. 2011). The loci of 2500 K (− 0.30, 0.06), 4000 K (0.42, 0.22), 6000 K (0.12, 0.02), and 20,000 K (− 0.31, −0.32) are shown near the cooling sequence.
Download figure:
Standard image High-resolution image4. DISCUSSION
4.1. White Dwarf Candidates
We have found 44 white dwarf candidates that are brighter than g' ∼ 24 mag over 4 deg2 moving faster than 32 mas yr−1, 27 mas yr−1, 37 mas yr−1, and 38 mas yr−1 for D1, D2, D3, and D4, respectively. We list the detailed parameters of these candidates in Table 3. The Teff is obtained from the SED fitting with pure hydrogen models. The synthetic magnitude is the absolute magnitude provided by Tremblay et al. (2011). The distance of each candidate is derived from the distance modulus, which is calculated from the difference between the absolute magnitude and the apparent magnitude. The Vtan for each object is estimated from the distance and the proper motion baseline in years.
The central objects in Figure 9 have proper motions of 52 mas yr−1 and 81 mas yr−1 in D1 and D2, respectively. We overplot the contours of objects over two epochs, 2004 and 2009 for D1 and 2004 and 2008 for D2. The first epoch is shown as black, and the second epoch is shown as red. Every object except the central one is a reference star that is fixed. The white dwarf candidate in the upper panel in Figure 9 has the coolest Teff of 3750 K in our candidate list. The estimated distance and tangential velocity (Vt) are ∼124 pc and 31 km s−1, respectively. This object could be located in the disk. The lower one in Figure 9 has the highest proper motion of 81 mas yr−1 in the candidate list. The fastest-moving object has the estimated distance of ∼485 pc and Vt of 190 km s−1. This object could be located in the thick disk or in the halo because of the high Vt. Harris et al. (2006) used Vt > 160 km s−1 as a criterion to select halo white dwarfs.

Figure 9. Upper: the white dwarf candidate having the coolest Teff of 3750 K in our candidate list with the proper motion of 53 mas yr−1. Lower: the white dwarf candidate having the largest proper motion of 89 mas yr−1 in the candidate list. The black counter presents the first epoch (the year of 2004). The red counter presents the second epoch (2009 for D1 and 2008 for D2).
Download figure:
Standard image High-resolution imageWe only find one candidate with photometric Teff ⩽ 4000 K, and it could be located in the disk as we discussed above. We also find five candidates having Teff between 4000 K and 5000 K. Two candidates are in D2, two in D3, and one in D4. One of the candidates in D2 presented in the bottom of Figure 9 could be a thick disk object or a halo object. The other four candidates are likely located in the thin disk because of their estimated distances and Vt. One thing should be considered about the temperature derived. We only use pure hydrogen models for the SED fitting and the Teff estimated. However, white dwarfs with Teff below 4000 K are suspected of having mixed H/He atmospheres (Bergeron & Leggett 2002; Bergeron et al. 2005; Kilic et al. 2010).
4.2. Proper Motion in USNO-B1.0
We have cross-identified ∼7000 objects with proper motion information in the USNO-B1.0 catalog (Monet et al. 2003). The differences are within 20 mas yr−1 for most objects, especially for stars brighter than 20th mag. About 65% of objects have derived proper motion larger from CFHT than from USNO-B1.0 for magnitudes less than 24 in the g band. For objects with magnitudes brighter than 18 mag, around 70% of the objects have larger proper motions from CFHT. Figure 10 presents the proper motion differences between the CFHT and USNO-B1.0 catalog in four fields.

Figure 10. Differences of proper motion between the CFHT and USNO-B1.0 catalog in four fields.
Download figure:
Standard image High-resolution imageThere are nine candidates that have proper motion values in the USNO-B1.0 catalog. The candidates with proper motions are listed in Table 4. We use these values to plot their location in the RPMD (Figure 5). The values of g and (g − i) use our data. These nine candidates appear twice in Figure 5 with the same value in the x-axis. Red squares in Figure 5 show the loci of nine candidates with proper motion values provided by USNO-B1.0.
Table 4. White Dwarf Candidates with USNO-B1.0 Proper Motion
| R.A. | Decl. | μ R.A. (USNO-B1.0) | μ Decl. (USNO-B1.0) | μ R.A. (This Work) | μ Decl. (This Work) |
|---|---|---|---|---|---|
| (J2000) | (J2000) | (mas yr−1) | (mas yr−1) | (mas yr−1) | (mas yr−1) |
| 02 25 58.19 | −04 02 36.5 | 34 ± 9 | 18 ± 3 | 32 | 28 |
| 09 59 09.57 | 02 35 38.2 | 36 ± 3 | −24 ± −14 | 20 | −26 |
| 09 59 19.86 | 01 45 07.1 | −2 ± 12 | 10 ± 3 | 14 | 25 |
| 09 59 41.62 | 02 07 00.1 | −36 ± 7 | −4 ± 4 | −37 | −8 |
| 10 00 05.64 | 01 58 59.0 | −72 ± 8 | 8 ± 22 | −53 | −6 |
| 10 00 49.66 | 02 22 17.0 | −36 ± 2 | 6 ± 5 | −34 | 1 |
| 14 17 24.09 | 52 52 27.7 | −54 ± 4 | 42 ± 3 | −64 | 46 |
| 14 18 00.77 | 52 24 39.2 | −14 ± 3 | −46 ± 9 | −33 | −41 |
| 22 17 07.09 | −17 49 18.3 | −20 ± 10 | 14 ± 3 | 34 | −10 |
| 02 24 46.44 | −04 33 44.7 | 0 | 0 | −37 | 9 |
| 02 27 46.39 | −04 21 09.3 | 0 | 0 | 30 | 8 |
| 09 59 17.25 | 01 50 19.1 | 0 | 0 | −32 | −4 |
| 10 00 48.47 | 02 33 56.2 | 0 | 0 | −28 | 17 |
| 14 18 23.00 | 53 07 21.9 | 0 | 0 | −34 | −32 |
| 14 21 49.42 | 52 49 20.6 | 0 | 0 | 40 | −51 |
| 22 13 53.39 | −17 52 03.0 | 0 | 0 | −31 | −40 |
| 22 14 20.53 | −17 57 21.2 | 0 | 0 | −45 | −6 |
| 22 14 49.48 | −18 10 06.8 | 0 | 0 | −36 | 35 |
Download table as: ASCIITypeset image
Among the candidate list, there are eight candidates having proper motions of zero in the USNO-B1.0 catalog. These objects could be too faint to have detectable proper motion in USNO-B1.0. We show contours of two faint objects with g = 22.27 and g = 21.70 in Figure 11. The black contour presents the first epoch (the year of 2004). The red contour presents the second epoch (the year of 2008).

Figure 11. Contours of two white dwarf candidates with zero proper motion in the USNO-B1.0 catalog. The black counter presents the first epoch (the year of 2004). The red counter presents the second epoch (the year of 2008).
Download figure:
Standard image High-resolution image4.3. SDSS Cool White Dwarf Comparison
Kilic et al. (2010) present optical and near-infrared photometry and physical parameters of 125 cool white dwarfs in the SDSS. We use these spectroscopically identified white dwarfs to test our SED and reduced proper motion methods. With our methods, there are 86 objects classified as white dwarfs, 20 DC-type white dwarfs classified as K-type stars, and one DZA-type white dwarf considered as a G-type star. We reject 18 objects because they did not fit well in our model templates. The cool white dwarf catalog (Table 3 in Kilic et al. 2010) contains 28 DA-type white dwarfs. Among them, we have classified 24 objects as white dwarfs using our methods. We only use pure hydrogen models, so it is not surprising that our classification for DA-type is better than DC-type. Figure 12 shows the percentages of temperature difference between our pure hydrogen model results and the Teff provided by Kilic et al. (2010). Red squares present DA-type white dwarf loci, and purple diamonds show loci of DC-types. The temperature difference is less than 10% for DA white dwarfs. For cooler white dwarfs (Teff < 4500 K), Teff derived from pure hydrogen models are lower than the Teff derived by mixed H/He models (Kilic et al. 2010). This implies that the candidate we found with Teff ⩽ 4000 K could have higher Teff if it has a helium or mixed H/He atmosphere.
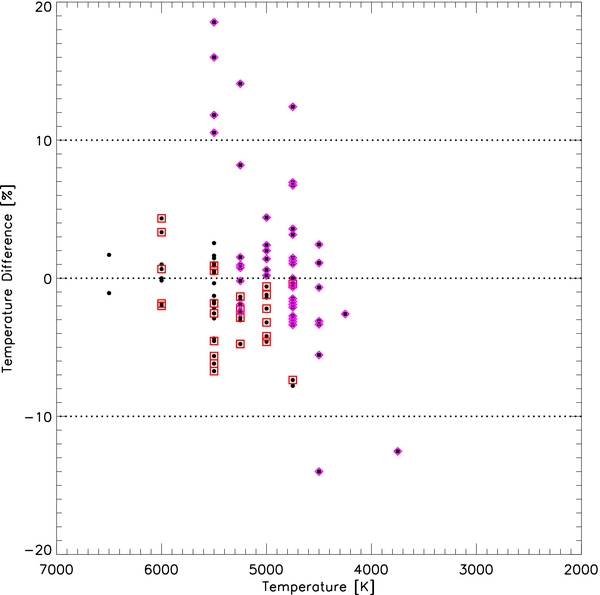
Figure 12. Percentage Teff difference between pure hydrogen models (Bergeron et al. 1995b, 2011; Holberg & Bergeron 2006; Kowalski & Saumon 2006; Tremblay et al. 2011) this paper used and Teff provided by Kilic et al. (2010) with the mixed H/He composition models on 125 SDSS cool white dwarf samples (Tables 1 and 3 in Kilic et al. 2010). The x-axis is the Teff derived from pure hydrogen models. Red squares present DA-type loci, and purple diamonds show loci of DC-types.
Download figure:
Standard image High-resolution image4.4. Sample Incompleteness and Luminosity Function
The completeness of the selected sample can be calculated by the V/Vmax method (Schmidt 1968; Chiu 1980), the ratio of the volume for each star with its actual distance and the volume of the maximum distance in the survey. The values of V/Vmax should be between 0 and 1. The mean of the ratio, 〈V/Vmax 〉, would be 0.5 for an ideal case with uniform distribution. The calculation of Vmax has been described for not only completeness but also white dwarf luminosity function (Schmidt 1968; Chiu 1980; Green 1980; Fleming et al. 1986; Wood & Oswalt 1998; Majewski & Siegel 2002; Geijo et al. 2006; De Gennaro et al. 2008; Rowell & Hambly 2011). A star can contribute the maximum volume Vmax in a survey, and 1/Vmax is a density estimator.
The Vmax can be derived by the expression

where β is the fraction of the covered sky in the survey, (ρ/ρ☉) is the stellar density profile along the line of sight between rmin and rmax , and the contributions of the maximum and minimum distances (rmin and rmax ) for an object to the sample are


where r is the distance to the object, μ is the proper motion, μl and μu are the lower and upper proper motion limits, mf and mb are the faint and bright magnitude limits in the survey, and m is the apparent magnitude.
Rowell & Hambly (2011) have a detailed discussion about the stellar density profiles. Most of our samples could be located in the thin and thick disks; we only consider the profile for the disk. Rowell & Hambly (2011) provide an exponential decay law, which can be described as (ρ/ρ☉) = exp (− |Z*|/H), where H is the scale height, and H = 250 pc for the thin disk (Mendez & Guzman 1998). The Galactic distance of the object, Z*, can be derived from the equation Z* = −|rsin (b) + Z☉|, where b is the Galactic latitude, r is the distance, and the Galactic plane distance of the Sun Z☉ = 20 pc (Reed 2006).
The value of the completeness test of 〈V/Vmax 〉 ± 1/(12N)1/2 for N = 44 samples is 0.117 ± 0.040.
We also use the Besançon model (Robin et al. 2003) to estimate the number of expected white dwarfs. For the thin disk, the expected number is around 50, about 10 for the thick disk and 0 or 1 for the halo per square degree. These expectations are for white dwarfs in g' band between 16.5 mag and 24 mag with the astrometric accuracy of 15 mas as 1σ. We only find 44 white dwarf candidates in four fields. (One field is 1 deg2.) The small number found and incompleteness are probably because our data set is relatively small and we only use DA-type models to fit all objects. We misidentify ∼16% of DC-type white dwarfs as K-type stars when we fit SDSS cool white dwarfs SED by using DA white dwarf models. We might lose a number of other types of white dwarfs.
We selected 39 white dwarf candidates with velocities greater than 30 km s−1 to calculate the space number density using the 1/Vmax method. Figure 13 shows the luminosity function for 48 candidates. The error for each 1/Vmax is calculated as 1/Vmax itself by assuming Poisson statistics,  . There are N objects in each bin, and the bin size is one bolometric magnitude. There is only one candidate in the faintest magnitude bin, 15.5–16.5. This makes its lower error go to zero. The red dashed line presents the white dwarfs with Vt greater than 30 km s−1 from the SuperCOSMOS Sky Survey provided by Rowell & Hambly (2011, Figure 15(a) in Rowell & Hambly 2011).
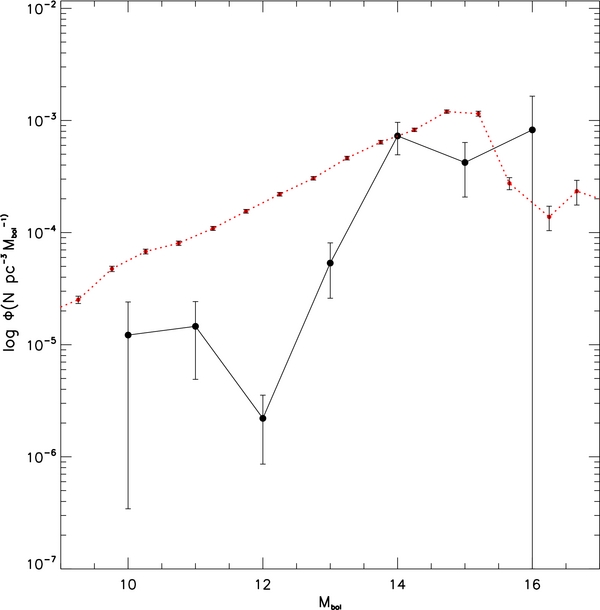
Figure 13. White dwarf luminosity function for 40 selected candidates with Vt greater than 30 km s−1. Red dashed line presents the white dwarfs with Vt greater than 30 km s−1 from the SuperCOSMOS Sky Survey provided by Rowell & Hambly (2011).
Download figure:
Standard image High-resolution imageThe space density is calculated as  . Rowell & Hambly (2011) find a thin disk density of
  in the solar neighborhood using the same method for white dwarfs in the catalog of the SuperCOSMOS Sky Survey. Our value is in agreement with theirs. In other studies about the local disk density, Harris et al. (2006) obtain a value of
  , and Leggett et al. (1998) obtain a value of
  . Our incompleteness sample and small number of white dwarfs we found could be an issue. The 1/Vmax is better to use for more than 200 points. Wood & Oswalt (1998) suggest an intrinsic statistical uncertainty of roughly 50% for 50 point samples and 15% for 200 point samples for the space density.
Figures 14–16 present distributions of distance, velocity, and Teff with the magnitude for 44 white dwarf candidates. Most of the candidates are likely located in the thin and thick disks.
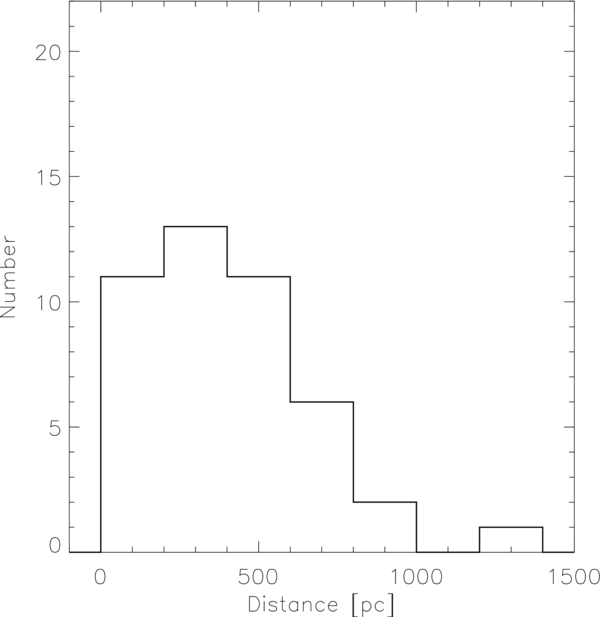
Figure 14. Histogram of distances for all white dwarf candidates.
Download figure:
Standard image High-resolution image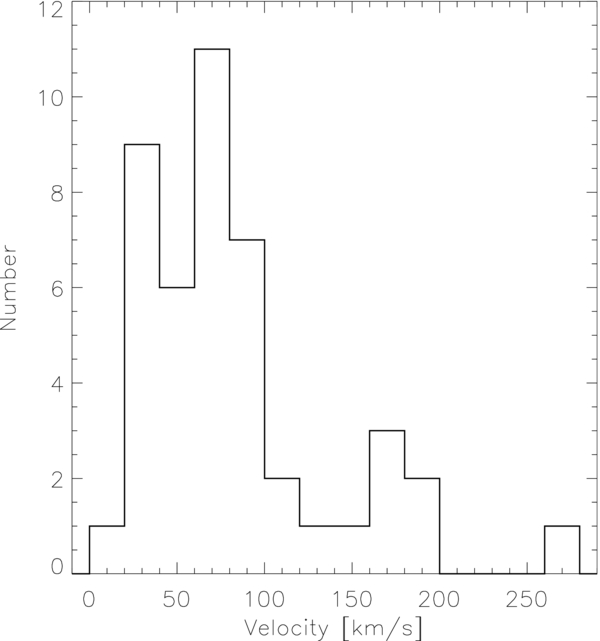
Figure 15. Histogram of tangential velocities for all white dwarf candidates.
Download figure:
Standard image High-resolution image
Figure 16. Histogram of Teff for all white dwarf candidates.
Download figure:
Standard image High-resolution image
5. CONCLUSIONS
We present the results of a search for cool white dwarfs in the CFHTLS. The CFHTLS Deep Survey covers 4 deg2 in five filters (u*, g', r', i', and z'). For the first and the fourth fields, we use data for a 5 year baseline from 2004 to 2009. For the second and the third fields, we have a 4 year baseline from 2004 to 2008. By using proper motions, SED fitting, and the RPMD, we have found 44 white dwarf candidates that are brighter than g' ∼ 24 mag over 4 deg2 and moving faster than 32 mas yr−1, 27 mas yr−1, 37 mas yr−1, and 38 mas yr−1 for D1, D2, D3, and D4, respectively.
We found one white dwarf candidate with Teff less than 4000 K. From its estimated velocity of 31 km s−1 and a distance of 124 pc, it appears to be located in the thin disk of the Galaxy. We also find five candidates having Teff between 4000 K and 5000 K. One candidate in D2 with Teff about 5000 K and tangential velocity of 190 km s−1 indicates that it could be in the thick disk or in the halo. The other four candidates are likely located in the thin disk because of their estimated distances and Vt.
The white dwarf space density of  is in agreement with the thin disk density in Rowell & Hambly (2011). In the RPMD (Figure 5), there are 126 objects located in the white dwarf region. We only identity 44 among them. The incompleteness in our sample would be improved by spectroscopic identification.
We thank an anonymous referee for valuable suggestions and comments. This work is supported by NSC 101-2119-M-008-007-MY3. Based on observations obtained with MegaPrime/MegaCam, a joint project of CFHT and CEA/DAPNIA, at the Canada–France–Hawaii Telescope (CFHT), which is operated by the National Research Council (NRC) of Canada, the Institut National des Science de l'Univers of the Centre National de la Recherche Scientifique (CNRS) of France, and the University of Hawaii. This work is based in part on data products produced at the Canadian Astronomy Data Centre as part of the Canada–France–Hawaii Telescope Legacy Survey, a collaborative project of NRC and CNRS.