


ABSTRACT
We report the synthesis of carbon dioxide on an amorphous carbon-13 substrate coated with amorphous water ice from irradiation with 100 keV protons at 20 K and 120 K. The quantitative studies show that the CO2 is dispersed in the ice; its column density increases with ion fluence to a maximum value (in 1015 molecules cm−2) of ∼1 at 20 K and ∼3 at 120 K. The initial yield is 0.05 (0.1) CO2 per incident H+ at 20 (120) K. The CO2 destruction process, which limits the maximum column density, occurs with an effective cross section of ∼2.5 (4.1) × 10−17 cm2 at 20 (120) K. We discuss radiation-induced oxidation by reactions of radicals in water with the carbon surface and demonstrate that these reactions can be a significant source of condensed carbon dioxide in interstellar grains and in icy satellites in the outer solar system.
Export citation and abstract BibTeX RIS
1. INTRODUCTION
There is ample evidence for the common occurrence of solid CO2 on the icy satellites of the outer planets. Reflectance spectra of Galilean satellites (Europa, Callisto, and Ganymede) acquired by Galileo's Near-Infrared Mapping Spectrometer showed infrared features indicative of CO2 (Carlson et al. 1996; Hansen & McCord 2008; Hibbitts et al. 2000, 2003). More recently, Cassini's Visible and Infrared Mapping Spectrometer has revealed the presence of surficial CO2 in the icy regolith of the Saturnian moons Encealdus, Dione, Phoebe, Iapetus, and Hyperion (Brown et al. 2006; Buratti et al. 2005; Cruikshank et al. 2010). Additionally, Cassini's Ion Neutral Mass Spectrometer recently detected a CO2 exosphere at Rhea, which is thought to generated from sputtering of condensed CO2 (Teolis et al. 2010). Ground-based observations have also identified condensed CO2 via overtone absorptions at ∼2 μm on Ariel, Umbriel, and Titania, the moons of Uranus (Grundy et al. 2006) and on Neptune's Triton (Cruikshank et al. 1993). Radar measurements by the Mars Reconnaissance Orbiter (Phillips et al. 2011) have recently shown that solid CO2 levels in the Martian southern pole are 30 times higher than a previous estimate (Leighton & Murray 1966). CO2 has also been detected in the dust tails of various cometary nuclei (Feaga et al. 2007; Feldman et al. 2009; Ootsubo et al. 2010).
Solid CO2 has also been detected in the interstellar medium (ISM) by the Spitzer Space Telescope and the Infrared Space Observatory (Boogert et al. 2004; Gerakines et al. 1999; Gibb et al. 2004). Solid CO2 is a major constituent of the icy mantles coating the micron-sized dust grains in these clouds with abundance between 9% and 37% relative to water ice, the dominant component (Whittet et al. 2007). Furthermore, CO2 is detected in quiescent clouds such as Elias 16 (Whittet et al. 1998), or in clouds with an embedded protostar such as W33 A (Gibb et al. 2000), which collapse to form protoplanetary disks.
Understanding the origin of molecules, like CO2, in diverse environments such as the satellites of the outer planets or dense clouds in the ISM is a central quest in astrophysics, one that is advanced by complementing observations with modeling and laboratory experiments.
Several competing mechanisms have been proposed to explain the origin of CO2 on the icy moons. One hypothesis suggests that CO2 is endogenic, i.e., it was either incorporated in the regolith from direct accretion during its formation or formed via aqueous alteration of carbon-bearing materials present in the satellites' interior (Carlson et al. 2009). Alternatively, CO2 could also be exogenic, since carbonaceous materials required for CO2 synthesis could be delivered to these satellites by meteorites. This idea is supported by the enhancement in infrared absorption due to CO2 in the vicinity of fresh crater sites, for instance on Europa and Callisto (Hibbitts et al. 2000). Ionizing radiation (magnetospheric ions, solar photons, electrons) impinging on the surface of these satellites could produce CO2 by initiating chemical reactions between water molecules and carbonaceous material. In addition, CO2 may be produced by implantation of magnetospheric carbon ions into the icy regolith (Strazzulla 2011).
In the cold ISM, oxidation of the abundant solid CO could lead to the formation of observed CO2. The oxygen atoms needed for this process may have been accreted in the grain, especially in the dense clouds where radiation is sparse, or they may have resulted from the dissociation of neighboring molecules in the ice, such as O2 or H2O, by radiation such as Lyα, cosmic rays or stellar winds. In our recent work (Raut & Baragiola 2011), we found that the reaction of CO and cold O atoms is relatively inefficient at making CO2, mostly because oxygen reacts preferentially with O atoms to form O2 and O3. Furthermore, other laboratory studies have demonstrated that irradiation of solid CO (Loeffler et al. 2005) or mixtures of CO with water ice or solid O2 (Gerakines et al. 2001; Satorre et al. 2000) can produce CO2, but the maximum CO2: CO ratios obtained are much smaller than those observed in the ISM. On the other hand, grains on which CO2 is produced from CO + O reaction and CO radiolysis can, if heated, end up with high CO2: CO ratio due to the much higher volatility of CO as compared to CO2 (Raut & Baragiola 2011). Such heating may result from the energy deposited by fast heavy cosmic rays on the dust grains and induce selective desorption (Bringa & Johnson 2003; Leger et al. 1985).
Although little is known about the composition of the interstellar dust grains, spectroscopic evidence suggests a carbonaceous component. Specifically, the 2175 Å bump in the stellar extinction curves is thought to be caused by the UV absorption shown by many carbon-bearing species. Some possible candidates are small graphitic grains, ultraviolet light-processed hydrogenated amorphous carbon, hyper-fullerene carbon particles, and even poly-aromatic hydrocarbons (Draine 2003). These carbon-containing grains are coated with an ice mantle that is composed primarily of water ice, but also contain other molecules such as solid CO, O2, and CH3OH. Radiation processing of the oxygen-bearing ices could yield radicals such as O or OH that react with the carbonaceous dust to form interstellar CO and CO2. Such reactions cause mass loss or etching of carbon; this is a well-known effect that dates back to 1950s, when the degradation of carbonaceous material within frozen biological samples was observed under the electron microscope (Heide 1982; Talmon et al. 1979). Etching was attributed to oxidation; energetic electrons dissociate water molecules to form radicals (O, OH, HO2) that oxidized carbon into CO, CO2, and also formed various hydrocarbons and H2, which were seen to desorb from the samples. Recently, several groups have investigated etching for different carbon allotropes (graphite, amorphous carbon, carbon nanotubes) with focused electron and ion beams in the presence of ambient water vapor or other gases such as O2 (Krasheninnikov & Banhart 2007; Lee et al. 1999; Spinney et al. 2009; Yuzvinsky et al. 2005). These studies have explored etching as a tool to making nanostructures, which are important in integrated circuits and other electronic devices; less attention has been given to the reaction products of oxidative etching. Most of the experiments have been performed at room temperature, where CO and CO2 desorbed readily from the underlying carbon and were ultimately removed via vacuum pumps.
Seeking to understand CO2 abundance in extraterrestrial environments, several groups have investigated the formation of CO and CO2 upon irradiation of water-ice coatings on carbonaceous materials at low temperatures. In contrast to the carbon-etching experiments performed at room temperature, the ice coating can help trap the oxidation products such as CO and CO2. Mennella et al. reported CO and CO2 synthesis from irradiation with Lyα photons (Mennella et al. 2006) and energetic ions (Mennella et al. 2004) of thin ice films condensed on hydrogenated carbon grains. Similarly, Gomis & Strazzulla (2005) observed CO2 formation from irradiation of ice films deposited on top of different carbon-bearing substrates such as asphaltite and irradiated benzene. The results of these ion-impact studies differ in the temperature dependence and in the total production of CO and CO2, likely due to the use of different substrates (carbon grain size, porosity, degree of hydrogenation, etc.), and, at least in part, due to the neglect of interference effects in the infrared absorption measurements (Teolis et al. 2007).
To better understand the mechanisms for radiation-induced carbon oxidation, we undertook experiments with well-defined surfaces of amorphous 13C substrates cleaned by removing atmospheric contamination by Ar ion sputtering in ultrahigh vacuum. The irradiations were made with mass-analyzed 100 keV protons at 20 and 120 K, temperatures typical of interstellar ice grains and icy moons in the outer solar system, and characterization of the radiation effects was performed with reflection infrared absorption spectroscopy taking due account of interference effects (Teolis et al. 2007), together with microgravimetry.
2. EXPERIMENTAL SETUP
The experiments were performed in an ultrahigh vacuum chamber cryopumped to a base pressure of ∼10−10 Torr. It houses a quartz-crystal microbalance (QCM) cooled by a closed-cycle refrigerator. The QCM is coated with a 13C foil (∼50 nm thick, >98% isotopic purity) made by Arizona Carbon Foils using electron beam evaporation of carbon and condensation onto glass slides previously coated with a parting layer such as BaCl2. The foil separates from the glass slide and floats when immersed into HPLC-grade high-purity water. A small uniform section of the foil is layered on top of the polished gold electrode of the QCM. Placing the foil-coated quartz crystal under a heat lamp for several hours, followed by baking the QCM in a high-vacuum oven (∼10−6 Torr), removes liquid water trapped between the foil and the gold surface. Care was taken to ensure that the foil coverage over the active area of the QCM was uniform and smooth, since creases and tears in the foil cause non-uniform mass loading, affecting the performance of the QCM and decreasing the specular reflectance of the carbon-coated gold. The 13C-coated QCM is irradiated with 100 keV Ar+ ions to fluences of ∼1014 ions cm−2 to sputter-remove adventitious hydrocarbons that coat the foil during transfer to the vacuum system. The amount of material removed is <1.5% of the foil mass.
The use of isotopic 13C foil ensured two advantages. The solid13CO2 has an infrared absorption band at 2275 cm−1 (4.40 μm), shifted from the 2345 cm−1 (4.26 μm) band of solid 12CO2 that can accumulate in the film from spurious sources, such as gas from the accelerator beam line and gas desorbed from the walls of the vacuum chamber by thermal or particle-induced desorption. Furthermore, the absorption bands of solid13CO2 are shifted from those of residual gaseous 12CO2 present in the external path of the infrared beam, a perturbation that is present only when the quality of the dry air purge is not optimum.
Thin ice films were vapor-deposited at 20 and 120 K on top of the carbon foil. The column densities of the ice films, measured by the QCM, were 276 × 1015 H2O cm−2, corresponding to a thickness of ∼100 nm. We irradiated the films at their growth temperature at near normal incidence (9°) with 100 keV protons from an ion accelerator with a magnetic mass filter. At 100 keV, the 1.3 μm ion range for protons is much larger than the ∼0.1 μm ice thickness (Ziegler & Biersack 2006). In fact, the ions penetrate the 50 nm carbon layer and are implanted into the gold electrode of the QCM.
Infrared reflectance spectra R were collected under specular conditions at a 35° angle of incidence using a Thermo-Nicolet Nexus 670 spectrometer at 2 cm−1 resolution. The spectra were divided by the reflectance spectrum of the bare carbon–gold substrate Ro and converted to optical depth, −ln(R/Ro). Subtraction of straight baselines from the optical depth spectra, followed by integration in the absorption region, yields band areas. Dividing the band areas by the effective band strength A* gives the amount of CO2, η, produced in the sample. The qualifier effective implies that the value of band strength is not a unique property of the molecule in the solid phase, but rather depends on other factors such as geometry (reflectance versus transmission), refractive index, and thickness of the films (Teolis et al. 2007). Therefore, using band strengths published elsewhere can introduce error in estimates of η. Instead, we performed experiments where known quantities of 13CO2 in the range of 1–10 ML, as measured by the microbalance, were deposited on top of the carbon foil and then covered with ∼100 nm thick ice films. These experiments gave A* = (6.1 ± 0.6) × 10−17 cm mol−1, a value that corresponds to our experimental conditions and should not be used for films of a different thickness or for other reflectance geometries.
Mass loss due to sputtering of water ice by the proton bombardment is measured with the QCM. It can decrease the film thickness significantly at high fluences. To maintain the original film thickness of ∼100 nm, we deposited water ice to compensate for sputtering loss following irradiation steps above a fluence of ∼5× 10¹⁵ H+ cm−2. The importance of maintaining a constant film thickness is to avoid errors in quantifying CO2 levels using infrared spectroscopy, since, as mentioned earlier, A* depends on thickness due to interference effects.
In another experiment, we deposited 25 ML of 13CH4 on top of the 13C substrate at 20 K. We then covered the film with 267 ML of water ice and irradiated the film with 100 keV protons, while monitoring the consumption of methane and the production of 13CO2. We performed this experiment to compare CO2 production between ice-coated carbon grains and ice-coated solid CH4.
3. RESULTS
Figure 1 shows the evolution of the ν3 absorption feature of 13CO2 at 2275 cm−1 versus irradiation fluence for 100 nm thick H2O films deposited over the carbon substrate at 20 K and 120 K. The films were irradiated at the temperature of film growth. In some instances, the spectra curve at higher wavenumbers (∼2320 cm−1) due to the fluctuating presence of 12CO2 gas in the path of the infrared beam. The 13CO2 absorption is sufficiently redshifted from the 12CO2 absorption, such that changes in the continuum caused by fluctuations in the atmospheric CO2 levels do not interfere with the 13CO2 measurements. For comparison, we also show in Figure 1 the 13CO2 absorption in the infrared spectra of molecular clouds in the direction of protostars S140: IRS 1 and W 33A. The differences between interstellar CO2 spectra and laboratory spectra are discussed later (see Section 5).
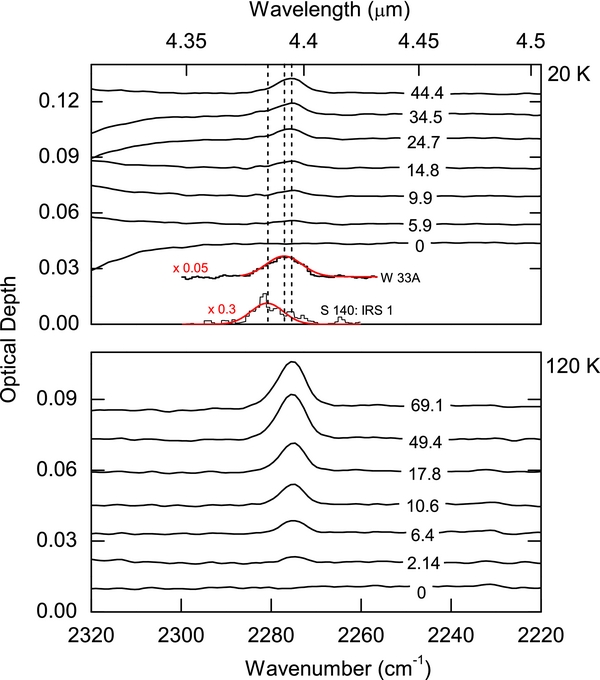
Figure 1. Optical depth in the region of the ν3 absorption of 13CO2 increases following irradiation of a 13C foil covered with ∼100 nm H2O with 100 keV protons at 20 and 120 K. The labels on the spectra are fluence in units of 1015 H+ cm−2. The spectra are shifted vertically for clarity. For comparison, we show the 13CO2 absorption detected toward S 140: IRS1 and W 33A by the Infrared Space Observatory. The red curves are Gaussian fits to the raw spectrum. Interstellar spectra are taken from Boogert et al. (2004). The dotted lines indicate the peak positions of the 13CO2 ν3 band obtained from different interstellar sources and for the laboratory spectra.
Download figure:
Standard image High-resolution imageThe fluence dependences of 13CO2 production at 20 and 120 K are shown in Figure 2. We observe that η has an initial linear growth with fluence and approaches steady-state values at ∼30 × 1015 H+ cm−2 at both temperatures. The onset of saturation is apparent in the data at 120 K and is suggested at 20 K. The saturation value ηs at 120 K is about 2.5 times larger than that at 20 K. Even at saturation fluences, we found no evidence of CO above our sensitivity of 1.4 × 10¹⁵ molecules cm−2, implying a CO/CO2 ratio less than 1.4 and 0.52 at 20 and 120 K, respectively.

Figure 2. Fluence dependence of the 13CO2 column density (η) estimated from the ν3 absorption band as 267 ML of H2O deposited on top of 13C foil is irradiated with 100 keV protons at 20 and 120 K. The lines are fits to the data which are discussed in the text. The dotted line labeled L indicates linear fluence dependence.
Download figure:
Standard image High-resolution imageFigure 3 shows normalized ν3 absorption spectra of 13CO2. Spectra in the top panel are from 1 ML of 13CO2 produced from 100 keV irradiation of an ice-coated carbon foil at 20 K. Heating the film to 140 K did not produce significant changes, except for a slight sharpening of the band. The CO2 produced from radiolysis remains trapped in the ice coat beyond 80 K, which is the desorption temperature for pure CO2 films. Spectra in the middle panel belong to 2 ML 13CO2 deposited on top of the carbon foil and coated with 267 ML of the ice layer at 20 K. Comparing the spectrum of the deposited film at 20 K with the spectra of an ion-irradiated sample shown in the top panel highlights additional structures at 2306 cm−1 and ∼2260 cm−1. These two features disappear above 100 K during ramping the film to desorption whereas the main CO2 is not observed above 150 K, consistent with previous desorption data (Malyk et al. 2007).
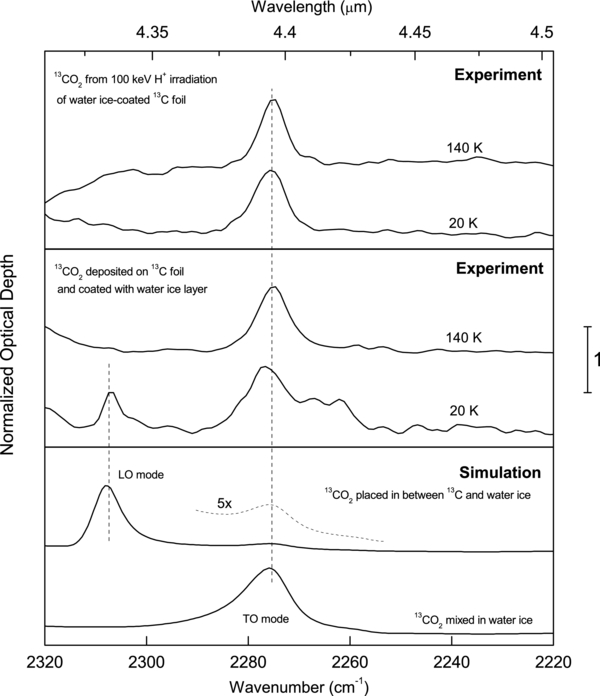
Figure 3. The ν3 absorption feature of 13CO2 for different films on a 50 nm 13C substrate. Top panel: ∼1 ML 13CO2 produced in ∼100 nm H2O layer over 13C foil by irradiation at 20 K and after heating to 140 K. Middle panel: ∼2 ML of 13CO2 deposit capped with 100 nm H2O at 20 K. The additional features at 2306 cm−1 and 2260 cm−1 disappear on heating to 140 K. Bottom panel: synthetic spectra for a film with 1% 13CO2 diluted in 100 nm H2O and for a ∼1 nm thick 13CO2 covered with 100 nm pure H2O. All spectra are normalized to maximum optical depth value and vertically shifted for clarity.
Download figure:
Standard image High-resolution imageThe bottom panel shows synthetic spectra generated with Fresnel's equations using optical constants of 13CO2, H2O, and amorphous carbon (aC; Teolis et al. 2007). One spectrum belongs to a 100 nm thick film with 1% CO2 mixed in water ice and is obtained using optical constants calculated with the effective medium theory (Born et al. 1999). The other spectrum is for a 1 nm layer of CO2, capped by 100 nm H2O. The synthetic spectra are generated using unpolarized light at 35° incidence and gold substrate. Comparing the experimental and the synthetic spectra yields information about the physical state of the radiolytic-generated CO2, which we will discuss below.
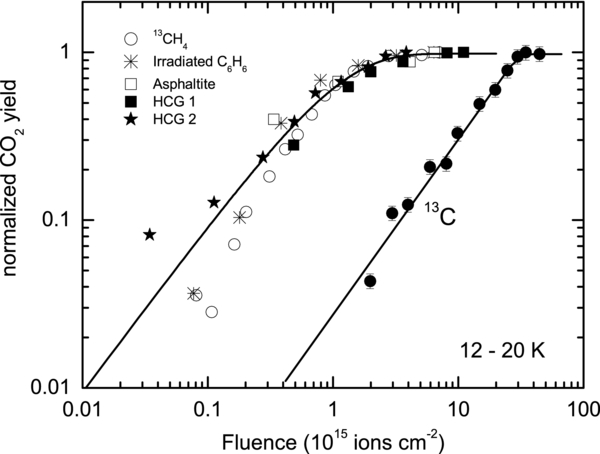
In Figure 4, we compare the fluence dependence of CO2 synthesis obtained from this work with data from several published experiments (Gomis & Strazzulla 2005; Mennella et al. 2004), where a variety of carbonaceous substrates are coated with thin ice films and irradiated with light ions with different energies. The CO2 is normalized to the maximum yield obtained in each experiment. Note the large fluence shift between data for carbon and hydrogenated carbon.
Figure 4. Comparison of fluence dependence of the normalized CO2 yield produced by ion irradiation of water-ice-coated carbon-bearing substrates. The hydrogenated carbon requires less fluence to produce CO2 compared to pure carbon. The CO2 production from ice-coated 13C and 13CH4 are our measurements. Data for asphaltite and C6H6 are from Gomis & Strazzulla (2005), while those for hydrogenated carbon grains (HCG 1 and 2) are from Mennella et al. (2004). The lines are to guide the eye.
Download figure:
Standard image High-resolution image
4. DISCUSSION
4.1. Physical State of Radiolytic CO2
As presented in Figure 3, the ν3 absorption band for a few monolayers of radiolytically generated 13CO2 (top panel) resembles that in the synthetic spectrum due to a film where CO2 is mixed in water ice (bottom panel). This match suggests that the CO2 produced from radiolysis does not form a CO2 layer that isolates the underlying carbon from the water-ice film. Rather, the radiolytically generated CO2 diffuses into the water layer even at 20 K. At this temperature, thermal diffusion is expected to be very slow but CO2 can migrate into the ice film by radiation-enhanced diffusion via ion-produced defects. At 120 K, both thermal and radiation-enhanced diffusion can be active.
The middle panel of Figure 3 shows that the ν3 band of the layered film is split into the longitudinal (LO) at 2306 cm−1 and transverse (TO) optical modes at 2275 cm−1 (Baratta & Palumbo 1998), the frequencies at which there is a peak in Im(−1/ε) = ε2/(ε12 + ε22) and Im(ε) = ε2 respectively, where ε = ε1 + iε2 is the dielectric constant (Harbecke et al. 1985).
The 2306 cm−1 band disappears during heating to 140 K when the CO2 mixes with water. A similar effect has been observed for CO diffusing into water ice upon heating (Palumbo 2006). The reason for this behavior is that diluting CO2 in water makes ε2 = ε1 and therefore Im(−1/ε) = ε2; that is, the LO absorption becomes negligible compared to that of TO. The change in the absorption spectrum upon mixing with water ice is confirmed by the synthetic spectra of the lower panel of Figure 3. Therefore, we conclude that the CO2 formed upon irradiation is dispersed in the water matrix and not absorbed on the substrate.
4.2. CO2 Synthesis and Destruction Mechanisms
The atomic constituents of the CO2 molecules are separate prior to irradiation. Therefore, CO2 formation requires oxidation of the carbon atoms by oxygen-bearing species produced by radiolysis of water near the ice/carbon interface. The energy deposited by the fast ions in water goes into making transient reactive species such as H, O, OH in their neutral, excited, and ionic forms, which react further via multiple pathways to form stable end-products such as H2, O2, HO2, HO3, and H2O2 (Spinks & Woods 1990). In principle, any oxygen-containing species can lead to oxidation of the carbon substrate. However, O2 does not react with carbon at low temperatures and the same is true for H2O2, as judged by the lack of CO2 formation when high-purity hydrogen peroxide was deposited on carbon grains at 16 K in a different, but related, experiment. We begin by examining possible reaction pathways that produce O-bearing radicals from radiolysis of water capable of oxidizing carbon at the substrate.
An impinging ion X can directly break a water molecule

or cause ionization resulting in electron emission

The electron and ionic H2O in (2) can further react with other water molecules


Additionally, the ions can also cause direct excitation of the water molecule
Reactions (6) and (7) leading to production of O atoms are ∼10% compared to reaction (5) (Slanger & Black 1982). This leads to a radiolyzed ice film more abundant in OH and H, compared to O atoms. The fate of the H and OH radicals is strongly influenced by diffusion, which is temperature dependent. H atoms can diffuse, even at low temperatures such as 20 K, and combine with OH to reform water or associate with another H to form H2 and escape the ice. In contrast, diffusion of OH is minimal at 20 K (Johnson 1997). OH radicals not consumed in reaction with H to reform water react to form hydrogen peroxide:

Though H2O2 is synthesized in our films via channel (8), its steady-state abundance, ∼0.3 × 10¹⁵ H2O2 cm−2 (derived from Loeffler et al. 2006), is below the detection limit. At higher temperatures, the OH diffuses away from the ion track, inhibiting H2O2 synthesis (Loeffler et al. 2006).
Near the carbon–water interface, OH radicals can also react with the carbon to form CO2 in steps via creation of an intermediate CO, since it is unlikely that two OH radicals are available to oxidize a single carbon atom at the same instant:
The H atoms in Equation (9) can recombine to form H2.
Additionally, CO2 synthesis can also occur via dissociative electron attachment (DEA), where secondary electrons emitted from the carbon during irradiation (Baragiola et al. 1979; Ritzau & Baragiola 1998) are temporarily captured by water, making short-lived anions that dissociate to make OH radicals:

The backward secondary electron yield from carbon foils due to 100 keV protons is ∼3 (Pauly et al. 2005; Ritzau & Baragiola 1998). Formation of DO2 and D2O2 in ice by DEA has been demonstrated in deuterated water ice irradiated with electrons of energy > 5 eV (Pan et al. 2004; Simpson 1997).
Once formed, a CO2 molecule can dissociate back to CO from a direct impact from ion X:

In addition, since the CO2 is embedded in a water-ice matrix, reactions between H2O and CO2 molecules initiated by ions can also lead to CO2 destruction. Carbonic acid is the dominant product observed in experiments where mixtures of CO2 and H2O are irradiated with keV ions, along with trace amounts of HCO, HCOOH, H2CO, CO3, and O3 (Hudson & Moore 2001; Strazzulla et al. 2005a, 2005b). However, we did not observe H2CO3 or other molecules in our experiment, indicating, as in the case of CO, that their concentrations were below the detection limits.
4.3. Rate Equation: Creation Yield, Destruction Cross Sections and Steady-state Values
The rate equation below describes the CO2 creation and destruction during ion irradiation:
where yc is the creation yield (CO2/proton) and σd is the net destruction cross section for CO2. The CO2 column density approaches a near-constant, steady-state value when yc ≈ σd × η. Integration of Equation (12) gives

The solid lines in Figure 2 are the fits of Equation (13) to data. The fit yields a steady-state CO2 value ηs = (2.8 ± 0.1) × 1015 CO2 cm−2 and an effective σd = (4.1 ± 0.3) × 10−17 cm2 at 120 K. The onset of saturation is not clear from the data at 20 K. Extrapolation of the fit suggests ηs ∼ 1.6 × 10¹⁵ CO2 cm−2 and σd ∼ 2.5 × 10⁻¹⁷ cm2. The initial creation yield yc (CO2/ion) = σd × ηs is 0.05 ± 0.01 and 0.1 ± 0.01 at 20 and 120 K, respectively. In the low-F limit, Equation (13) reduces to η (F) = yc F. The higher values of yc and ηs at 120 K are likely due to increased availability and mobility of the OH radicals. Previous studies (Loeffler et al. 2006) have shown that H2O2 production from ion irradiation in pure water-ice film decreases with increasing temperature. This is attributed to out-diffusion of OH radicals from the ion tracks. Since fewer OH radicals are consumed in H2O2 synthesis, more are available for C oxidation at 120 K via the reaction channels shown in Equation (9).
The production of CO, below our detectability limit, is seen in experiments with hydrogenated carbon grains having large surface areas and is roughly proportional to CO2 (Mennella et al. 2004). This means that CO and CO2 go through a conversion cycle without net loss. Satorre et al. (2000) have shown that, for a wide range of concentrations of CO2 in water and without a carbon substrate (i.e., yc = 0), the ratio of CO to CO2 reaches a constant value k at high fluences. Then, Equation (12) can be rewritten as
where σ12, σ21, and σ2c are the cross sections for converting CO into CO2, CO2 into CO, and CO2 into carbonic acid and other hydrocarbons (Hudson & Moore 2001; Strazzulla, et al. 2005a), respectively, where we have neglected back-conversion to CO, CO2. This implies that the effective destruction cross section for CO2

is small, 100 times smaller than σ21 in initially pure CO film irradiated with 200 keV protons (Loeffler et al. 2005), where carbonic acid cannot be produced. The increase in σd with temperature may be due to the easier escape of dissociation fragments of CO2 from the surrounding molecular environment (cage effect; Spinks & Woods 1990).
4.4. Absence of CO
Several groups have observed CO in the irradiation of mixtures of solid CO2 and H2O with energetic electrons, ions, and photons (Gerakines et al. 2001; Satorre et al. 2000; Strazzulla et al. 2005b; Zheng & Kaiser 2007). Our sensitivity to CO was determined in a separate experiment where we irradiated a mixed film of CO2: H2O (1: 4) with 100 keV protons at 20 K. We observed a steady-state CO: CO2 = 0.55 at high fluences in general agreement with previous experiments on irradiation of dilute mixture of CO + H2O and CO2 + H2O (Satorre et al. 2000).
Thus, as mentioned earlier, the lack of observation of CO in our films deposited on carbon implies that the column density is below our detection threshold of ∼1.4 × 10¹⁵ CO cm−2. Assuming that steady-state CO: CO2 = 0.55 in our films as well, we estimate upper limits on the CO column density to be 0.55 and 1.65 × 10¹⁵ mol cm−2 at 20 and 120 K, respectively. This CO column density is barely above the detection threshold in the 120 K experiments, but it is likely to be decreased by out-diffusion from the solid.
4.5. Comparison with Previous Studies
Mennella et al. (2004) have studied the formation CO2 from irradiation of water-ice-covered hydrogenated 10 nm carbon grains with 30 keV He+ ions at 16 and 77 K. In contrast to our study, they detected CO in their experiments. The saturation column densities for CO2 (15 ML) and CO (15–25 ML) that they report are much higher than our values, likely due to a much larger surface area in the grains. Also, the onset of CO2 saturation in their experiments occurred at nearly 10 times smaller fluence compared to our results. The production of CO2 showed no dependence on temperature, while they observed twice as much CO at 16 K than at 77 K. They suggested that the escape of CO at higher temperatures could explain their observed temperature dependence.
Gomis & Strazzulla (2005) extended the study of CO2 production using different carbon-bearing materials coated with water ice and irradiated with He+ and Ar+ ions of different energies. Despite varying conditions, the range of the maximum CO2 yield stayed on the order 3–6 ML. At the temperature of the experiments, 16 K, they detected much less CO (∼2.5 ML) than previous measurement of ∼15–25 ML at 12 K (Mennella et al. 2004).
Table 1 summarizes the results of the two preceding studies discussed above and this work. Here, we have considered only low-temperature studies and irradiations with fast ions where energy loss is dominated by inelastic electronic processes. In Figure 4, we compile the fluence dependence of CO2 production in the different experiments listed in Table 1. The CO2 column density has been normalized to the maximum yield obtained in each experiment. We note, in Figure 4, that our results with 25 ML of methane coated with ice have similar fluence dependence to the experiments by others with hydrogenated carbon, pre-irradiated benzene, and asphaltite. This clearly shows that the presence of hydrogen in the carbon substrate has a strong effect on CO2 production; nearly 10 times less fluence is required to produce CO2 from irradiation of water-ice-covered hydrogenated carbon when compared to pure carbon foil. This could be due to the weakening of the carbon bonds upon hydrogenation.
Table 1. Comparison of Experimental Parameters and Results among Several Experiments where Carbon-bearing Substrates were Covered with Thin Ice Films and Irradiated with Ions of Different Energies
| Substrate | Ice | T | d | Ion, E | θ | ηs | Reference |
|---|---|---|---|---|---|---|---|
| (K) | (nm) | (keV) | (1015 CO2 cm−2) | ||||
| 13C | H2O | 20 | 100 | H+, 100 | 9° | 1 | This work |
| HCG 1 | H2O | 12 | 35 | He+, 30 | 45° | 7a | MPB |
| HCG 2 | H218O | 16 | 57 | He+, 30 | 45° | 15a | MPB |
| C6H6 residue | H2O | 16 | 80 | He+, 200 | 45° | 6a | GS |
| Asphaltite | H2O | 16 | 80 | He+, 30 | 45° | 3.5a | GS |
| 13CH4 (25 ML) | H2O | 20 | 100 | H+, 100 | 9° | This work |
Notes. MPB: Mennella et al. (2004). GS: Gomis & Strazzulla (2005). aMPB and GS used band strength A = 7.6 × 10⁻¹⁷ cm mol−1 to derive CO2 column density.
Download table as: ASCIITypeset image
Our interpretation of the data differs from that of Gomis & Strazzulla (2005). These authors assumed that the saturation of the CO2 production with fluence is due to a limit in the number of C atoms that can be converted to CO2 at the water–carbon interface, due to adsorbed CO2 that restricts further oxidation. However, the lack of the LO band in the irradiation experiments shows that the CO2 diffuses into the ice rather than being absorbed on the carbon, where it might inhibit further oxidation. In our model, saturation of the CO2 column density is attributed to ion-induced dissociation of CO2, a process mentioned by Gomis & Strazzulla (2005) but not included in their model.
5. ASTROPHYSICAL IMPLICATIONS
These experiments show that carbon dioxide can be formed by radiolysis at the interface between water ice and carbon. Similar situations exist in the ISM, such as in the case of clouds with embedded protostars, and in the cold edges of protoplanetary disks, where carbonaceous dust grains coated with water ice are continually impacted by GeV cosmic rays or stellar winds. The maximum column density of CO2 that can be formed by this mechanism at one interface is of the order of a monolayer (as seen in our experiments at 20 K). Therefore, this mechanism is insufficient to explain the high amount of CO2 (∼10%–40% relative to water ice) observed toward different molecular clouds (Whittet et al. 1998), but should contribute to the total interstellar CO2 abundance. More CO2 would be formed if the incident radiation passes through multiple interfaces; such would be the case of nanoscale carbon particles dispersed in ice or of porous carbon grains containing embedded water. Additionally, since H2 is the most dominant gas in the ISM (Tielens 2005), it is likely that the carbonaceous grains are hydrogenated. Other studies suggest that more CO2 can form on hydrogenated grains at lower fluences.
The position of the ν3 absorption band observed in this study (2275.2 ± 0.5 cm−1) is in agreement with other measurements in ultra-high vacuum for 13CO2 diluted in water ice (Malyk et al. 2007). An upward shift to 2281 cm−1 holds for 13CO2 diluted in 13CO ice and produced by radiolysis at 16 K (Loeffler et al. 2005). The astrophysically important case is a CO matrix with natural isotopic abundance. Previous isotopic studies have shown that the shift due to a matrix of lighter C isotopes is small, ∼3 cm−1 (Falk 1987). A common interstellar environment is expected to be pure CO2 ice, where 13CO2 is naturally diluted in 12CO2, with ν3 peaking at 2281–2283 cm−1 (Falk 1987), depending on the phase, amorphous or crystalline. These three environments (pure CO2, CO2 diluted in CO, or water) are sufficient to explain the observations of absorption band positions of condensed 13CO2 in different molecular clouds (2275–2283 cm−1), without the need to invoke thermal processing or the presence of methanol or other species (Boogert et al. 2000). As an example, in Figure 1 we compare the ν3 absorption observed in the star-forming regions S 140: IRS1 and W 33A with that produced from radiolysis of carbon–water ice in our experiments. The peak position of the 13CO2 feature toward S 140:IRS1 is shifted compared to our laboratory spectrum, indicating that this molecule is not in water but possibly pure or in CO. In contrast, the peak of the 13CO2 feature toward W 33A is at 2277 cm−1, close to the laboratory value of CO2 diluted in water ice. We do not discuss line widths since they result from a convolution of intrinsic widths with a distribution of peak positions due to a population of environments along each line of sight.
We now consider the implications of our results on the observations of carbon dioxide on the icy moons of the outer solar system. We do not compare CO2: H2O ratios since they depend on the thickness of the water coverage and on the inhomogeneous composition of satellite surfaces. Since there are no reports of 13CO2 in icy satellites, we limit our discussions to 12CO2. The observed CO2 band position ranges from 2347 cm−1 (Phoebe and Iapetus; Buratti et al. 2005; Clark et al. 2005) to 2354.6 cm−1 (Hyperion; Cruikshank et al. 2010). The CO2 on Galilean satellites such as Callisto and Ganymede peaks at 2348.5–2349 cm−1 (Hibbitts et al. 2000, 2003). These frequencies are substantially higher than the range seen in interstellar ices, 2342–2346.2 cm−1 (Gerakines et al. 1999) and to the laboratory values for pure CO2, 2343.3 cm−1 (Baratta & Palumbo 1998; Falk 1987) as well as for CO2 mixed in water, 2340 cm−1 (Sandford & Allamandola 1990). Other studies show that the frequency of the ν3 band of CO2 adsorbed on metal oxide surfaces shifts upward. For instance, the peak position is at 2367 cm−1 for CO2 adsorbed on Al2O3 (Ramis et al. 1991) and 2351–2363 cm−1 on porous inorganic zeolites (Montanari & Busca 2008). The CO2 observed on the icy moons could be produced by the mechanism presented in this work and be readsorbed on mineral surfaces after diffusion or desorption followed by gravitational return. This absorbed state would have the observed band position.
The radiolytic interface process discussed here might also apply to synthesis of other molecules in extraterrestrial environments via combination of atoms of various solids embedded in ice.
We acknowledge financial support from NASA Cosmochemistry.