


ABSTRACT
We present the results of a mid-infrared survey of 11 outer Galaxy massive star-forming regions and 3 open clusters with data from the Wide-field Infrared Survey Explorer (WISE). Using a newly developed photometric scheme to identify young stellar objects and exclude extragalactic contamination, we have studied the distribution of young stars within each region. These data tend to support the hypothesis that latter generations may be triggered by the interaction of winds and radiation from the first burst of massive star formation with the molecular cloud material leftover from that earlier generation of stars. We dub this process the "fireworks hypothesis" since star formation by this mechanism would proceed rapidly and resemble a burst of fireworks. We have also analyzed small cutout WISE images of the structures around the edges of these massive star-forming regions. We observe large (1–3 pc size) pillar and trunk-like structures of diffuse emission nebulosity tracing excited polycyclic aromatic hydrocarbon molecules and small dust grains at the perimeter of the massive star-forming regions. These structures contain small clusters of emerging Class I and Class II sources, but some are forming only a single to a few new stars.
Export citation and abstract BibTeX RIS
1. INTRODUCTION
Massive star-forming regions are the powerhouses of galaxies. They form the high end of the observed mass distribution of stars and dominate the production of stars in general in galaxies (Bally et al. 2005). The massive stars produce strong stellar winds and supernovae that shape their surroundings and inject energy into the overall interstellar medium of the galaxy. The processes that operate within massive star-forming regions and shape their surrounding molecular clouds are not fully understood. These may be constructive in triggering new star formation or destructive of the clouds (Yorke 1986; Arthur et al. 2004). The principal reason for this lack of understanding is that such regions are in general farther from us than smaller, low-mass star-forming regions such as Taurus which can be studied in great detail. In addition, sensitive infrared mapping of entire clouds in the pre-Spitzer Space Telescope (Werner et al. 2004) and pre-WISE era was extremely challenging. The c2d (Evans et al. 2009) Spitzer survey of five molecular clouds within 300 pc of the Sun and GLIMPSE Spitzer survey of the inner Galaxy (|l| < 65° and |b| ≲ 1°; Benjamin et al. 2003, 2008) have shown the power of extended mid- to far-infrared surveys to uncover the extent of star formation beyond the narrow regions previously accessible.
Recent observations in the mid-infrared (mid-IR, 3–24 μm) with Spitzer have revealed that the young stellar objects (YSOs) in massive star-forming regions often show elongated and clumpy spatial distributions that may reflect structure in their parental molecular clouds (e.g., Lada et al. 1996; Allen et al. 2002; Teixeira et al. 2006; Gutermuth et al. 2009). Mapping the spatial distribution of the YSOs within these star-forming regions is an important means by which one can study the embedded clusters and reveal the physical processes that influence star formation in massive regions such as triggered star formation (Koenig et al. 2008). A common feature of these observations is the presence of young stars with disks and/or envelopes—either singly or in emerging clusters—at the heads of pillars of gas that point back toward the central O stars in the region. These pillars are formed via a capstone effect (Hester et al. 1996; Thompson et al. 2002). In this process, a dense clump of material is exposed when less dense material around it is photoevaporated away more rapidly. The gas and dust behind the clump is then shielded from ionizing radiation from the massive stars that power the H ii region, forming a pillar or trunk structure. These features have often been cited as locations where triggered star formation may take place via radiatively driven implosion (RDI; see, e.g., Sugitani & Ogura 1994). Recent papers draw conflict-ing conclusions about whether new star formation in these pillars is triggered or occurs passively (compare Smith et al. 2010 and Gritschneder et al. 2010, for example). To begin to resolve the situation, we need high-sensitivity infrared surveys of a wide variety of star formation sites where differences in YSO distribution according to environment can become statistically meaningful.
The Wide-field Infrared Survey Explorer (WISE; Wright et al. 2010; Jarrett et al. 2011) is a NASA medium-class Explorer mission, launched on 2009 December 14. WISE mapped the entire sky simultaneously in four infrared (IR) bands centered at 3.4, 4.6, 12, and 22 μm (W1, W2, W3, and W4, respectively) with 5σ point-source sensitivities of approximately 0.08, 0.1, 1, and 6 mJy, respectively, although significant areas of the survey are deeper than these limits. WISE is much less sensitive than even shallow Spitzer surveys and has two to three times worse spatial resolution. On the other hand, it covers the whole sky and is 100 times more sensitive than IRAS (Wright et al. 2010). Since WISE's observed bands are similar to those of Spitzer, we can replicate its techniques and observations, only now with access to fields of view as large as necessary, for as many regions as desired.
We extracted WISE observations of a set of nine star-forming regions from the list of Leisawitz et al. (1989) at ages up to 5 Myr and three slightly older (>10 Myr) open cluster regions NGC 659, NGC 663, and NGC 957 to conduct a survey of massive star-forming clusters, their evolution, and their environments. Leisawitz et al. (1989) used observations of the J = 1–0 rotational transition of 12CO to study the environment of 34 Milky Way open star clusters and constrain the timescales over which massive star formation sites evolve and disperse their parental giant molecular clouds. With the WISE data, we find and detect young stars by their infrared excess emission in these regions in order to systematically compare the development and progress of star formation over time. In Table 1, we list the properties of the regions selected for this study. While a single age or range of ages is listed for each region, we note that almost all will have some age spread, given the observation of clusters both in the evacuated H ii region cavities and also embedded in the surrounding gas and dust, possibly still in the process of forming stars. In general, the listed age refers to the central cluster of stars in each case. Since we use the swept-up or cleared-out shells of interstellar material in our analysis, a more relevant age would be the shell development timescale. However, that timescale is not always known. All the regions chosen are within 7 kpc of the Sun to give us a reasonable chance to resolve and detect the young stellar population. All contain known massive stars, or evidence for the actions of massive stars in the form of bright rims of dust emission in IRAS 12 and 25 μm maps. In particular, we use this sample of star-forming regions because their location in the outer Galaxy mitigates considerably the confusion from other regions along the line of sight and the quantity of Galactic dust extinction.
Table 1. Cluster Sample
| Cluster ID | Galactic Coordinates | d | Ref. for d | Age | Ref. for Age | |
|---|---|---|---|---|---|---|
| l | b | (kpc) | (Myr) | |||
| NGC 2175 | 190.20 | +0.42 | 2.6 | 1 | <1 | 2 |
| W 3 (IC 1795) | 133.72 | 1.22 | 2.0 | 3 | 1–5 | 4 |
| NGC 1893 | 173.59 | −1.70 | 3.6 | 5 | 1.5 | 5 |
| Bk 59 | 118.25 | +4.95 | 0.9 | 6 | 2 | 6 |
| NGC 7380 | 107.08 | −0.90 | 3.7 | 7 | 2 | 8 |
| W 4 (IC 1805) | 134.73 | 0.92 | 2.4 | 9 | 3 | 9 |
| NGC 281 | 123.13 | −6.24 | 2.6 | 10 | 3.5 | 11 |
| IC 1396 | 99.29 | +3.73 | 0.9 | 12 | 4 | 13 |
| Roslund 4 | 66.96 | −1.26 | 2.0 | 14 | 4 | 14 |
| NGC 1624 | 155.35 | +2.58 | 6.0 | 15 | 4 | 15 |
| W 5 (IC 1848) | 137.19 | 0.92 | 1.9 | 16 | <5 | 17 |
| NGC 957 | 136.34 | −2.66 | 2.2 | 18 | 10 | 18 |
| NGC 663 | 129.46 | −0.94 | 2.8 | 19 | 19 | 19 |
| NGC 659 | 129.34 | −1.51 | 3.5 | 19 | 22 | 19 |
References. (1) Wu et al. 2001; (2) Haikala 1995; (3) Xu et al. 2006; (4) Tieftrunk et al. 1997; (5) Prisinzano et al. 2011; (6) Majaess et al. 2008; (7) Wolff et al. 2007; (8) Massey et al. 1995; (9) Wolff et al. 2011; (10) Rygl et al. 2010; (11) Guetter & Turner 1997; (12) Contreras et al. 2002; (13) Sicilia-Aguilar et al. 2006; (14) Phelps 2003; (15) Sujatha & Babu 2006; (16) Hillwig et al. 2006; (17) Karr & Martin 2003; (18) Yadav et al. 2008; (19) Phelps & Janes 1994.
Download table as: ASCIITypeset image
2. OBSERVATIONS AND DATA REDUCTION: WISE IMAGING AND PHOTOMETRY
The WISE spacecraft conducted observations in a continuous scanning mode, using a scan mirror to freeze a single pointing on the detector to take an image. Individual images are integrated for 8.8 s in all four bands. The level 1b (l1b) images used in this study were processed using the WISE Science Data System,5 developed at the Infrared Processing and Analysis Center (IPAC), which ingests raw data, produces images, detects sources, and extracts photometry (Wright et al. 2010). Single images have a field of view of 47 arcmin and a plate scale of 2.75 arcsec pixel−1. We used the AWAIC software tool6 (version 3.7.6) to co-add the raw l1b frames and produce our own custom-sized images free from cosmic rays and other detector artifacts. AWAIC is a co-addition, mosaicking, and resolution enhancement tool for creating science quality products from image data in FITS format with World Coordinate System (WCS) information following the FITS-WCS standard in astronomy. AWAIC is used to produce the co-added ATLAS images in the WISE preliminary release. Distortion is corrected assuming it follows the simple imaging polynomial convention. The final images had a plate scale of 2.5 arcsec pixel−1 (Berkeley 59 and IC 1396), 1.375 arcsec pixel−1 (NGC 659, 957, 1624, 1893, 2175, 7380, Roslund 4), 2.73 arcsec pixel−1 (W 3/W 4/W 5), 2.75 arcsec pixel−1 (NGC 281, WISE bands 1–3), and 5.5 arcsec pixel−1 (NGC 281, WISE band 4).
We carried out our own point-source extraction and aperture photometry of all point sources on the final WISE mosaics in all bands with PhotVis version 1.10beta3 for the fields in this study as the WISE preliminary data release catalogs were of insufficient depth to detect all of the young stars in these regions and/or did not cover all of the fields considered. PhotVis is an IDL GUI-based photometry visualization tool (Gutermuth et al. 2004) that utilizes DAOPHOT modules ported to IDL in the IDL Astronomy User's Library (Landsman 1993). Radii of the apertures and inner and outer limits of the sky annuli were 5'', 7 5, and 25'', respectively, for bands 1 and 2. For bands 3 and 4, we used 75, 10'', and 25'', respectively. For comparison, the WISE point-spread function full width at half-maximum in bands W1–W4 is 61, 64, 65, and 120, respectively (Wright et al. 2010). We used these small apertures due to the level of crowding visible in these fields. The resulting photometry was calibrated by matching the source list in each band from each field to photometry from the WISE preliminary release catalog7 with a 3'' search radius, excluding objects flagged in the catalog as "D," "H," "O," or "P" artifacts. These flags refer to diffraction spikes, halos from bright sources, optical ghosts from bright sources, and persistent/latent artifacts, respectively. We calculated the median shift in photometric calibration necessary to match our aperture photometry to the online WISE Preliminary Release Catalog photometry. The mean (and 1σ spread) aperture corrections were 0.40 ± 0.05, 0.48 ± 0.05, 0.53 ± 0.05, and 1.15 ± 0.05 in bands 1, 2, 3, and 4, respectively. For the Roslund 4, IC 1396, and NGC 7380 fields, where the preliminary release catalog did not cover the field, we used data from the proprietary Operations Coadd extraction of the WISE data to derive the aperture corrections.
3. ANALYSIS
3.1. Source Classification
We have developed a scheme using WISE photometry to identify young stars from their mid-IR colors and magnitudes, in the same way as has been performed in studies using Spitzer photometry (for example, Gutermuth et al. 2008).
At ages 1–2 Myr, 60%–70% of young stars possess optically thick disks which boost their near- and mid-IR emission above the photospheric level (Strom et al. 1989; Haisch et al. 2001). By an age of 5 Myr, the fraction of low-mass stars (0.1–1.2 M☉) with optically thick disks drops to around 20%, while those with mass >1.2 M☉ exhibit almost no excess emission at wavelengths λ < 16 μm (Carpenter et al. 2006; Dahm & Hillenbrand 2007). No more than 10% of stars older than 10 Myr exhibit any near-IR and 3–8 μm excess emission from circumstellar disks (Strom et al. 1989).
Clearing of the inner parts of the disk by photoevaporation by the star or by planet formation produces stars that exhibit excess emission only at wavelengths >20 μm, the so-called transition disks. The absence or low level of excess emission from 1 to 10 μm and large excess beyond 20 μm has been modeled as arising from a truncated optically thick outer disk and a dissipated inner disk or a radial gap in the inner disk (for example, Calvet et al. 2005; D'Alessio et al. 2005). These "transition disks" may be created by binary systems; however, recent work by Pott et al. (2010) has shown that these may be rare occurrences and planet formation or brown dwarf companions may be responsible for the inner disk clearing (Andrews et al. 2011). The ages of transition disks are uncertain. Their appearance has been noted in young regions of the Taurus star-forming cloud by Luhman et al. (2010). Giant planet formation may be able to produce disk clearing on timescales <5 Myr. Photoevaporation of the disk may take a longer time to operate (for example, Alexander & Armitage 2009).
At a still later stage of evolution, debris disks appear. These are likely the result of disks replenished in small dust by collisions between planet-size bodies, and are thus formed by second generation dust, while transition disks are evolved primordial disks that have been cleaned in their inner parts (Currie et al. 2008; Kenyon & Bromley 2004). However, these disks have only weak excesses and are unlikely to be detected at the large distances (>1 kpc) surveyed in this paper as WISE cannot see optically thin debris disks for stars where the photosphere could not be detected by band 4 at 22 μm.
These properties of young stars make them possible to distinguish from field stars—which will have bluer spectral energy distributions (SEDs) in the infrared wavelength range—and crudely classify them by their colors. Even though young stars that have completely lost their circumstellar disks will be missed with this technique, clusters and stellar groups younger than 10 Myr are still identifiable in the mid-infrared by their disk frequency which is larger than in the old field population.
Classification of sources is performed using a multi-phase mid-IR colors method. The basis for this scheme is the work of Allen et al. (2004) and Hartmann et al. (2005) who first investigated the distributions of young stars in Spitzer color space. The scheme for identification of young stars is similar to those in Spitzer studies that use mid-IR colors to distinguish YSOs and mitigate contamination (e.g., Gutermuth et al. 2008, 2009). In the Appendix, we detail our adapted WISE method in full. In summary, we use the numerous available flux ratios, or colors, to identify and classify candidate YSOs and, to the extent possible, mitigate the effects of contamination and reddening. The scheme makes use of combined WISE and Two Micron All Sky Survey (2MASS; Skrutskie et al. 2006) data. We match the extracted WISE source lists for each field to the 2MASS JHKS point-source catalog. We match using a 3'' search radius and remove 2MASS objects with photometric quality flags D, E, F, or X in any band. These flags refer to the following: D—the signal-to-noise ratio <5; E—profile-fit photometry was very poor or did not converge; F—a reliable estimate of the photometric error could not be determined; and X—no valid brightness estimate could be extracted using any algorithm.
Contamination arises from non-YSO sources, including star-forming galaxies, broad-line active galactic nuclei (AGNs), unresolved knots of shock emission from outflows colliding with cold cloud material, planetary nebulae, and asymptotic giant branch (AGB) stars (both carbon-rich and oxygen-rich; Robitaille et al. 2008).
Once separated from the diskless photospheres (Class III pre-main-sequence stars and unrelated field stars) and the aforementioned contaminants, the YSOs are classified into the canonical categories of Class I YSOs (protostars with infalling envelopes, including flat spectrum objects) and Class II YSOs (pre-main-sequence stars with optically thick disks), with supplemental categories of "deeply embedded sources" (added to the Class I tallies) and "transition disks." Class I YSOs have rising or flat SEDs from 3.3 to 22 μm, while Class II YSOs have a falling SED slope (Lada 1987; Greene et al. 1994). Transition disks are objects with optically thick excess emission at long wavelengths and little to no excess at short wavelengths (Strom et al. 1989). As described in the Appendix, we require detections in WISE bands 1, 2, and 3 or 2MASS KS plus WISE bands 1 and 2 to eliminate background galaxies and classify sources as Class I or II YSOs. The transition disk category requires a detection in WISE bands 1, 2, and 4. We note that Class II YSOs viewed at high inclination will have similar SEDs to Class I YSOs. Edge-on Class I YSOs can have characteristics of Class 0 YSOs (an earlier evolutionary stage with a more massive infalling envelope and high internal extinction; André et al. 1993; Robitaille et al. 2006). We emphasize that all Class I, II, and transition disk objects found in this paper are YSO candidates, but hereafter refer to them simply as YSOs.
To calculate the rate of contamination in our YSO samples, we used three non-Galactic plane fields (the Boötes SDWFS field of Ashby et al. 2009 and two polar fields, all of ≈10 deg2). The combined range of these fields, including Poisson errors, is 1.4–2.9 Class I sources, 2.2–5.4 Class II sources, and 0.9–2.7 transition disk sources deg−2. This derived contamination rate is generally applicable, but likely overestimates the amount of contamination in regions of high near-IR extinction or heavy cirrus confusion. Without these foreground issues, extragalactic source confusion should be isotropic. We note that our scheme will not generally exclude all galaxies, but at the same time it will also overcompensate for contamination because faint YSOs will also be removed from consideration. A further step of looking for "extended source" status in the 2MASS catalog (which we do not perform here) will exclude most resolved galaxies, but those point-like at 2MASS resolution will remain contaminants. These typically consist of centrally concentrated star-forming galaxies at a redshift of 0.1–0.4 (D. L. Padgett et al. 2011, in preparation; Rebull et al. 2010).
Field Galactic AGB stars and Classical Be stars (CBe; Porter & Rivinius 2003) can also mimic the properties of young stars in surveys such as this one (Robitaille et al. 2008). With their weak infrared excesses above the photosphere, they often resemble "anemic" disks (Lada et al. 2006) with excess at all infrared wavelengths but at a level below that of optically thick T Tauri stars or Herbig AeBe star accretion disks. CBe stars are most commonly in the spectral type range O9 to B3 and thus will be bright but relatively rare. Similarly, Robitaille et al. (2008) estimated a rate of a few AGB stars per square degree at most from the GLIMPSE survey region in the inner Galaxy. Since our fields are in the outer Galaxy, the density of AGB stars will be lower. We expect ∼few contaminating AGB and CBe stars in each cluster studied.
In Table 2, we list the number of YSOs classified as Class I, II, and transition disks within a radius Rmax, defined as the by-eye radius that encloses the visible extent of the cluster (for NGC 659, 663, and 957) or the outer edge of the expanding shells as traced out by the bright 12 and 22 μm cirrus emission in the younger regions. The location and size of these radii Rmax are shown in Figure 1 as white dashed-line circles. The centers of these circles are adjusted by eye to match the observed mid-IR morphologies at 12 and 22 μm and are discussed in detail in Section 4. The W 5 region is divided into the clusters IC 1848 and W 5 East, with the coordinates given in the SIMBAD online database for HD 18326 for W 5 East. The W 4 region is divided into a region roughly centered on the cluster IC 1805, and another to its south to trace out the apparent second bubble of emission in this location. The Bk 59 region is divided into an eastern and a western bubble.
Download figure:
Standard image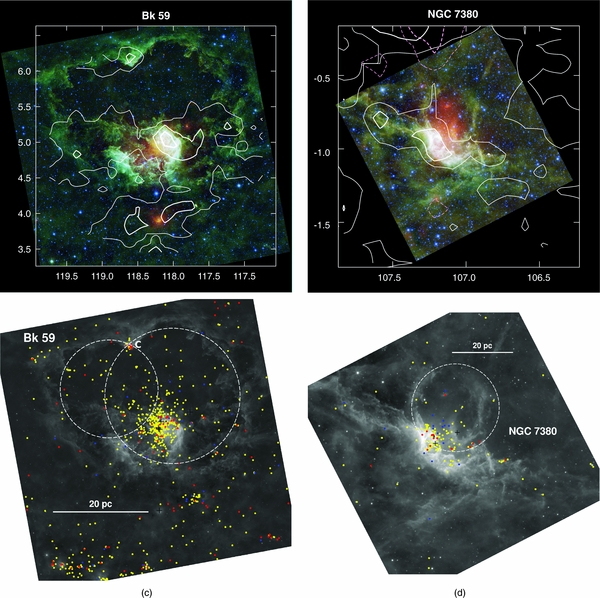
Download figure:
Standard image High-resolution image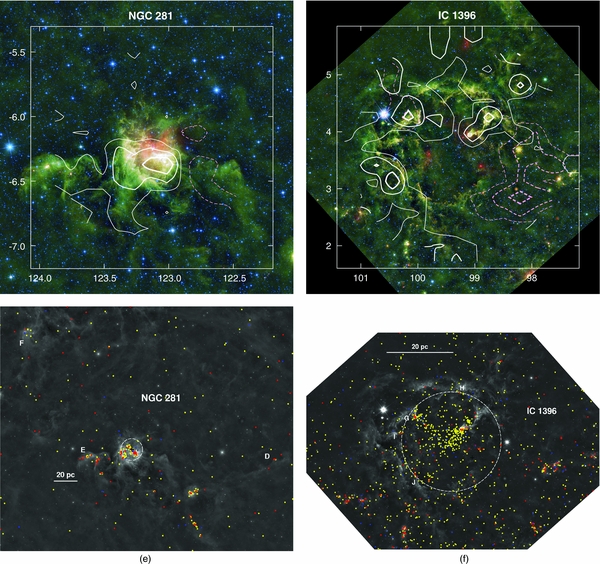
Download figure:
Standard image High-resolution image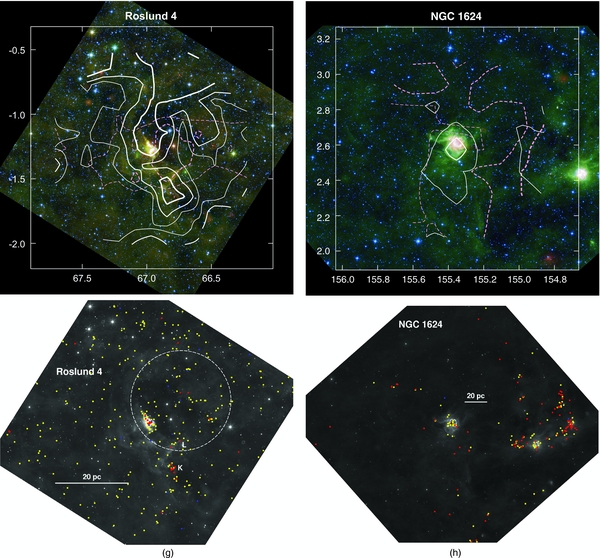
Download figure:
Standard image High-resolution image
Download figure:
Standard image High-resolution image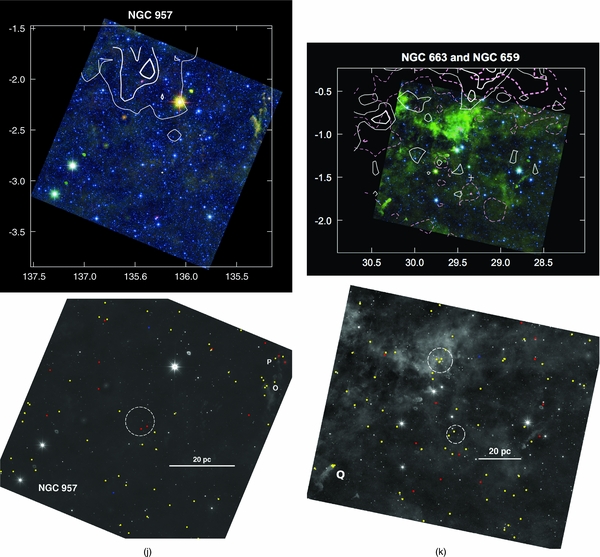
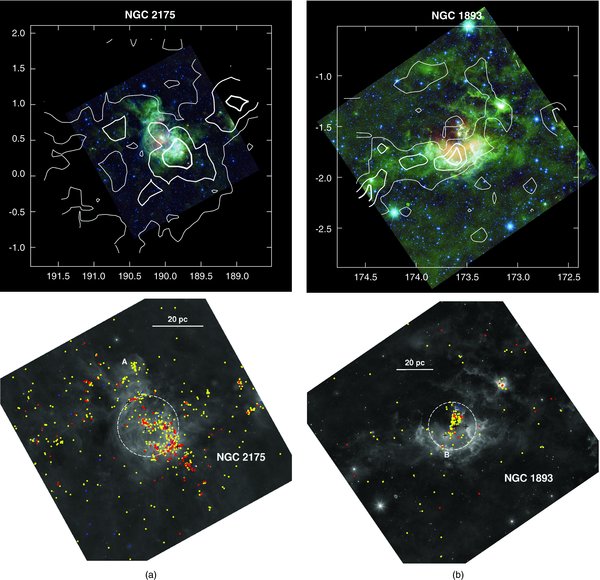
Figure 1. Survey results: for each region we display a color-composite of all four WISE bands, overlaid with the CO survey data of Leisawitz et al. (1989). All coordinate grids display Galactic latitude and longitude in degrees. We also show a WISE band 3 (12 μm) gray-scale image, overlaid with red, yellow, and blue points showing Class I, II, and transition disk YSOs, respectively. Black crosses show the locations of O stars found in the SIMBAD online database. White dashed circles mark Rmax, the by-eye radius of the cluster as listed in Table 2. Small white letters in individual panels highlight specific features or clusters and are described in the text in Section 3.4.
Download figure:
Standard image High-resolution imageTable 2. Derived Parameters
| Cluster ID | Galactic Coordinates | Rmax | N(I/II/TD) | 90% Completeness | ΣSFR | ||
|---|---|---|---|---|---|---|---|
| l | b | (arcmin) | (pc) | (M☉) | (10−6 M☉ yr−1) | ||
| NGC 2175 | 190.023 | 0.513 | 15.87 | 12.002 | 70/154/8 | 1.5 | 2500 |
| IC 1795 | 133.72 | 1.22 | 22.8 | 13.26 | 52/196/7 | 2.1 | 4600 |
| NGC 1893 | 173.59 | −1.66 | 12.42 | 13.006 | 14/89/5 | 7 | ⋅⋅⋅ |
| Bk 59 West | 118.04 | 5.43 | 54.14 | 14.174 | 46/434/18 | 0.7 | 1800 |
| Bk 59 East | 118.89 | 5.53 | 39.16 | 14.718 | 15/90/3 | 0.7 | 390 |
| NGC 7380 | 107.076 | −0.773 | 13.39 | 14.41 | 13/61/11 | 5.5 | ... |
| IC 1805 | 134.73 | 0.92 | 28.151 | 19.244 | 11/216/9 | 2.1 | 4300 |
| W 4 South | 135.03 | 0.462 | 32.195 | 22.0 | 8/103/4 | 2.1 | 2100 |
| NGC 281 | 123.125 | −6.254 | 12.27 | 9.28 | 21/63/7 | 4.0 | ... |
| IC 1396 | 99.294 | 3.704 | 57.04 | 14.933 | 50/407/26 | 0.95 | 2700 |
| Roslund 4 | 66.716 | −1.102 | 23.51 | 13.677 | 17/88/8 | 3 | 3800 |
| NGC 1624 | 155.35 | 2.62 | 1.738 | 3.033 | 2/12/0 | >7 | ... |
| IC 1848 | 137.19 | 0.92 | 31.08 | 18.08 | 42/383/9 | 2.1 | 7900 |
| W 5 East | 138.03 | 1.5 | 16.0 | 9.308 | 14/167/5 | 2.1 | 3400 |
| NGC 957 | 136.34 | −2.66 | 6.9 | 5.22 | 2/0/0 | 3.1 | ... |
| NGC 659 | 129.34 | −1.51 | 4.2 | 4.28 | 0/2/0 | 3.3 | ... |
| NGC 663 | 129.46 | −0.94 | 5.7 | 4.64 | 0/5/0 | 2.0 | ... |
Notes. Rmax is a by-eye estimated radius that encloses the YSOs associated with the cluster detected by WISE in our survey, adopting the distance listed in Table 1. N(I/II/TD) lists the number of Class I, II, and transition disk YSOs within that radius. W5 is split into two regions: IC 1848 and W5 East. The NGC 659 image includes NGC 663. ΣSFR is the estimated rate of recent star formation, calculated only for regions within 2 kpc.
Download table as: ASCIITypeset image
3.2. Completeness Limits
The mass completeness limit for our survey is dictated by our photometric completeness and the wide span of YSO mid-IR colors. The primary constraint in completeness for the samples of YSOs is the 12 μm detection limit, since this band has low sensitivity relative to WISE bands W1 and W2 and very bright background contamination from polycyclic aromatic hydrocarbon (PAH) feature emission. The additional YSOs found with the KS − [3.4] − [4.6] color–color diagram (see the Appendix) helps to mitigate the loss of the faintest YSOs. We find from matching the sample of detected YSOs in the W 5 region to that of Koenig et al. (2008), the WISE sample of YSOs is 90% complete to a magnitude of 12 in the 2MASS KS band. We are able to recover roughly 30% of the YSOs (Class I, Class II, and transition disk) found with Spitzer and listed by Koenig et al. (2008) with our WISE data. Using the evolutionary models of Siess et al. (2000), at age 2 Myr, at 2 kpc with extinction AV = 2 (characteristic of the H ii region cavity in W5; Hillwig et al. 2006), KS ∼12 equates to a limiting mass 3.75 M☉. However, since we are dealing in the majority with T Tauri and Herbig AeBe-like stars that possess infrared excess at near- and mid-infrared wavelengths, we must take into account the excess emission produced by the accretion disks around these stars. Meyer et al. (1997) demonstrate that T Tauri stars typically have a K-band excess between 0.1 and 1.1 mag. Taking a median value excess of ΔK = 0.65, the completeness limit converts to a mass of 2.0 M☉. We carry out the same estimation for each region in our sample and summarize the results in Table 2.
As a check on these results we also compared our data for IC 1396 to the work of Barentsen et al. (2011) and Sicilia-Aguilar et al. (2006), and our data for IC 1795 to the work of Roccatagliata et al. (2011). In IC 1396, we recover all of Barentsen et al.'s YSOs down to a computed mass of 1 M☉, and we are 90% complete in matching to Sicilia-Aguilar et al.'s sample to a KS magnitude of ≈13. With extinction AV = 2, this similarly converts to a mass ≈1 M☉ at 4 Myr in the models of Siess et al. (2000). In IC 1795 our 90% completeness limit (after applying the same WISE and 2MASS photometry requirements that we use to find YSOs) is at a Spitzer [3.6] magnitude of 10.5 when compared to the sample of Roccatagliata et al. Assuming a typical YSO KS − [3.6] excess of 1 mag and AV = 2, this limit converts to a mass between 2 and 3 M☉ at an age of 1 Myr, dependent on the level of KS-band excess. At an age of 3 Myr—the lower limit age derived by Roccatagliata et al.—the limit becomes 6 M☉, much higher than our quoted value. However, their sample included many diskless YSOs found through their Chandra X-ray emission, to which we are not sensitive in this work. We thus note that the completeness limits in Table 2 should only be used for a relative comparison between regions in the survey, given the strong positional dependence within regions of bright nebular background, extinction, and age, all of which influence the completeness calculation.
3.3. Confusion
The resolving power of the WISE telescope means that as we sample more and more distant regions, the likelihood that there will be multiple sources in the beam increases. At 1 kpc (the distance to the nearest regions in the sample), the 6'' resolution of bands 1–3 corresponds to a distance of about 0.03 pc, while the 12'' resolution at band 4 corresponds to 0.06 pc. In the Orion Nebula Cluster (ONC), with a volume density of 2 × 10⁴ pc−3, the peak spacing between cluster members is about 35, or about 0.007 pc, with a median nearest neighbor distance of 0.09 pc (using the full compilation of Rebull et al. 2006, supplied by the authors). This result implies that we are likely confused in the densest clustered regions in each field. However, the ONC sample extends down to stellar masses ∼0.04 M☉, while at best our survey completeness is 0.7 M☉ as given in Table 2, which will mitigate this effect somewhat. Of the 2500 sources with a listed mass in the data of Rebull et al. in the inner part of the ONC (R.A. = 83 5–842 and decl. = −64 to −45), we find that considering only sources with mass >0.7 M☉, the peak nearest neighbor distance is 0.16 pc. Considering only sources with mass >1.0 M☉, the peak nearest neighbor distance is 0.26 pc.
We urge caution prior to follow-up of the YSO lists presented in this paper. An additional source of contamination is from confusion caused by the change of resolution from short to long wavelengths (i.e., what was star A at W1 is star B at W4 22 μm). Star/galaxy superposition is also significant, as is star/nebula superposition. A star on top of a nebula can have a "fake" excess if the nebula gets steadily brighter in proximity to the star (since the background subtraction will then be wrong). For example, an object resembling a transition disk (a stellar SED at short wavelengths but an excess at 22 μm) could be mimicked by the combination of a foreground or cluster member stellar source and a background galaxy that only appears at the longest wavelength. A direct comparison of the WISE detected source list with the high-resolution (<1'') r'z' imaging data of Koenig & Allen (2011) in the W 5 region shows that at 2 kpc, 10% of sources are actually multiple. We also tested the results of our classification scheme by comparing the YSO catalog of Koenig et al. (2008) for the W 5 region from Spitzer with that produced by our WISE algorithm. Of 852 candidate YSOs identified by WISE that matched with Spitzer sources, 141 (so roughly 16%) appeared to be spuriously produced by the effects described above. In particular, the list of WISE transition disks was 90% contaminated by false detections. We thus consider all transition disks in regions beyond 1 kpc to be unreliable; however, due to their low numbers in each region this fact does not alter our analysis.
3.4. Star Formation Rates
In Table 2, we use the YSO counts to derive a star formation rate for the star-forming regions within 2 kpc. In each case we first extrapolate the number of YSOs to a full 0.1–100 M☉ initial mass function (IMF) using a standard Salpeter IMF (Salpeter 1955). We assume that the YSOs we have detected range in mass from our 90% completeness limit up to 8 M☉ (an approximate upper limit to the masses of Herbig AeBe stars; Hernández et al. 2006). Since we are only detecting stars with disks and are missing those young stars that have already lost their disks, this calculation gives the amount of recent star formation. Following the example of Heiderman et al. (2010) and Lada et al. (2010), we estimate the star formation rate by adopting an average mass of 0.5 M☉ (see, for example, Chabrier 2003) and a timescale of 2 Myr (the time between the formation and end of the Class II phase; see Evans et al. 2009). Thus, the star formation rate is

Although we could plausibly derive this parameter for all the regions surveyed, in the more distant clouds the lack of completeness combined with the likely different timescale for disk erosion in the more massive young stars makes the calculation more uncertain.
3.5. Region-by-region Source Distribution
We describe the regions we have surveyed in order of increasing age as listed in Table 1. In Figure 1, we show the results of the survey. For each region we plot two figures: a color composite of the four WISE bands, overlaid with the CO data from Leisawitz et al. (1989) and a grayscale WISE 12 μm image overlaid with the YSOs that we have classified for each region and known O and B stars from the literature.
The key observations in this sample are (1) a rough trend of decreasing Class I YSO content and decreasing CO emission in the central portions of each region, (2) ubiquitous presence of bright arcs and pillars of dust emission coincident with condensations of 12CO emission at the periphery, (3) clusters of Class II YSOs around the central O stars in the largest regions, and (4) smaller embedded clusters of YSOs in the peripheral dust arcs and pillars.
3.5.1. NGC 2175
NGC 2175 (H ii region S252, distance 2.6 kpc, age <1 Myr; Wu et al. 2001; Haikala 1995) appears by its morphology to be a young region as measured by the large number of Class I objects that we detect: 30.2% of all YSOs found within Rmax are Class I. It also lacks a cleared out cavity around the central O star HD 42088 and its cluster. The Class I objects in the southwestern portion of the region are projected onto filamentary structures, dark at 12 and 22 μm and visible in projection against a large CO cloud. These filaments were also imaged in high resolution CS(J = 2–1) by Carpenter et al. (1995) who found very dense cores of molecular gas there. Our CO contour map shows a strong concentration of CO emission behind the main cluster and shows the emission extends across the YSO groups. UBVRI observations by Pişmiş (1970) and Haikala (1995) showed that the small cluster to the north at l, b = 190.12, 1.04 ("NGC 2175small," marked with an "A" in Figure 1) is older: 6–10 Myr versus <1 Myr for the main part of the cluster. Our observations are consistent with this age difference, as we detect no Class I YSOs in this subregion of NGC 2175. Recently, Bonatto & Bica (2011) estimated a much nearer distance of 1.4 kpc and found a wide spread in age across NGC 2175 and the constituent clusters of 0.2–10 Myr. While they adopted 5 Myr as an age for the bulk of stars in the region, we argue that the high number of Class I stars found in this region (the highest total of any in this present survey) suggests a younger age, even accounting for the bright 12 and 22 μm nebular emission which will tend to suppress the detection of Class II sources more than Class Is. While there is certainly an age spread among the clusters in the region, the size of this spread may be accentuated in their survey by large and variable levels of extinction and disk excess among their YSO sample.
3.5.2. W 3 (IC 1795)
The W 3 region (Westerhout 1958) contains the cluster IC 1795. Its distance has been estimated at 1.95 kpc by Xu et al. (2006) using maser parallax measurements. Oey et al. (2005) and Roccatagliata et al. (2011) have found that the cluster IC 1795 itself has an age in the range of 3–5 Myr, while the surrounding embedded clusters and ultra-compact H ii regions are likely <1 Myr in age (for example, Tieftrunk et al. 1997). In our images and YSO survey, W 3 appears to be the youngest portion of the W 3/W 4/W 5 complex, based on several dense clusters of YSOs and its large population of Class I objects (20.4% of the YSOs within Rmax) seen projected against a molecular cloud and bright diffuse emission at 12 and 22 μm. For this region, we use the CO data from the Galactic survey of Dame et al. (2001). In addition, the detection of maser emission by Xu et al. (2006) is a key signature of embedded massive star formation. Many dark filaments are seen within W 3 in the 12 μm WISE band. Our analysis reveals that they all appear to contain chains of Class I and II objects.
3.5.3. NGC 1893
NGC 1893 and the H ii region S236 (age 1.5 Myr) at 3.6 ± 0.2 kpc are at roughly twice the distance of W 3/W 4/W 5 (Prisinzano et al. 2011) and so our completeness in YSO detections is much poorer; we estimate that our survey is 90% complete to a depth of 7 M☉. However, we can still make out a similar morphology to that seen in W 5 where a central cluster containing Class II objects extends northeast to pillars of gas containing new young clusters of YSOs. The remaining material around the cluster to the south and west, visible both in extended 12 and 22 μm emission and in the CO contours, appears to contain little new star formation. A small cluster of Class II stars and a Class I star is visible in projection against the CO emission at l, b = 173.7, −1.84 (marked "B" in Figure 1). Prisinzano et al. (2011) combined VRIJHK, Spitzer, and Chandra X-ray observations to detect 1061 Class II and 5 Class 0/I YSOs in the region. Of the 15 WISE Class I candidates within Rmax, 11 are listed as Class II by Prisinzano et al. (2011), 3 are Class 0/I, and 1 lies outside of their surveyed field. Of our 89 WISE Class II sources within Rmax, 83 are found in their Class II list. The remaining six WISE Class II YSOs lie outside their field of view. Thus, although our WISE classifications are not in perfect alignment with those of Prisinzano et al., we are in general agreement with the designations of these stars as YSOs.
3.5.4. Berkeley 59
The Berkeley 59 cluster (distance 0.9 kpc, age 2 Myr; Majaess et al. 2008) lies in the center of the Westerhout 1 region (Westerhout 1958) and is similar in one regard to the H ii region W 5 in that it shows a large central cluster around the powering O stars and a cleared out cavity with an emerging cluster of YSOs on the periphery (to the north, marked "C" in Figure 1). However, it strongly differs from W 5 in that there is still a very bright interior region of 12 μm emission surrounding the central cluster. This bright region also coincides with a peak in the CO contour map of the region. However, the exact three-dimensional spatial relationship between the cluster and cloud is unclear. For example, the bright 12 μm emission could simply be the illuminated surface of a molecular cloud on the far side of the cluster. The YSOs in the main cluster do not extend to the emerging cluster to the north in Bk 59, and there appears to be a deficit of YSOs in between the main cluster and the northern edge. The peripheral cluster is also coincident with a peak in CO emission at l, b = 118.6, 6.11.
3.5.5. NGC 7380
NGC 7380 and its H ii region S142 (age 2 Myr; Massey et al. 1995) are at a similar distance to NGC 1893 (3.7 kpc versus 3.6 kpc, respectively; Wolff et al. 2007), and we estimate a 90% completeness limit of 5.5 M☉. In this case, there is no dense central cluster visibly associated with the most massive O star in the region (DH Cep; Massey et al. 1995). However, there is a large cluster of Class II and Class I YSOs immediately to its east, surrounding the bright rim of WISE band 3 and 4 emission that defines the cloud edge there. In addition to the southwest of DH Cep there are three pillars of diffuse emission pointing back toward it, each with a Class I protostar candidate at its tip. These pillars are not detected in the low-resolution CO contour map, which captures the main arc of diffuse emission and also a larger surrounding ring of material outside the central cluster region.
3.5.6. W 4 (IC 1805)
The distance to W 4 has been estimated at 2.35 kpc (Wolff et al. 2011) who also derived an age of 3 Myr. It contains a central cluster of YSOs visible around the main O stars in IC 1805 and there are emerging clusters of young stars at the periphery. The central cluster appears more diffuse. A calculation of the space density of sources in the central clusters of W 4 and W 5, using the nearest neighbor technique of Casertano & Hut (1985) with n = 6, shows that the peak density in the W 4 central cluster is 0.69 stars arcmin−2. Clouds of CO mark out the W 3 region to its west, with an arc extending around to the south and smaller clumps to the east and north.
3.5.7. NGC 281
NGC 281 (age 3.5 Myr) is at a Galactic latitude of −6° and has a peculiar proper motion that points out of the plane (Rygl et al. 2010). After removing the circular component of Galactic rotation, its peculiar motion is between 15 and 30 km s−1 out of the Galactic plane, depending on the distance used (2.6 ± 0.2 kpc; Sato et al. 2008). Both Rygl et al. (2010) and Sato et al. (2008) suggest that NGC 281 may be on the edge of an expanding superbubble centered nearer to the Galactic plane. Our analysis reveals mostly localized star formation in the form of YSOs concentrated within the 12 μm bubble and on its periphery. We also detect IRAS 00420+0530 in our image—also claimed by Rygl et al. (2010) to be a region on the edge of this expanding bubble given its proper motion out of the Galactic Plane. This region also has a small cluster of YSOs within it but appears to be disconnected from NGC 281. If we consider the small YSO clusters at l, b = 120.42, −6.45, l, b = 123.81, −6.41, and l, b = 125.1, −4.05 (marked "D," "E," and "F" in Figure 1, respectively) to also be a part of this expanding ring, we suggest the expansion center may lie somewhere near l, b = 121.88, −3.66. The CO contour map detects the main concentration of CO associated with NGC 281 (the peak coincides with the main embedded cluster of YSOs) and the small region to its east, but we do not detect IRAS 00420+0530.
3.5.8. IC 1396
The region around the cluster IC 1396 forms a complete ring of bright PAH emission at 12 μm, and contains the well-known pillar and cluster Trumpler 37 (Tr 37) on the western edge (Sicilia-Aguilar et al. 2005). Contreras et al. (2002) derived a distance of 0.9 kpc to the region and the Spitzer study of Sicilia-Aguilar et al. (2006) found an age of 4 Myr for Tr 37. The CO emission contours trace out the full ring, although the northeastern portion and southwestern part of the region appear at different velocity ranges in the map (−11–2 and 0–12 km s−1, respectively). IC 1396 lies at the edge of the much larger Cepheus bubble l, b = 102.83, 6.81 (Patel et al. 1995). The central cluster of WISE-detected YSOs around the central powering O star system HD 206267 (Abt 1986) extends both northwest to Tr 37 and northeast to another pillar pointing back toward the center at l, b = 99.98, 4.17 ("G" in Figure 1). Three smaller emerging clusters are also visible on the rim, but we detect far fewer YSOs in these objects at l, b = 99.13, 4.64; 100.259, 3.864; and 99.99, 3.09 ("H," "I," and "J" in Figure 1). Patel et al. (1995) carried out an extensive CO survey of IC 1396 (12CO and 13CO J = 1–0) and calculated an expansion velocity of 5 km s−1 for the region. They list 43 CO globules, of which we find 25 possess at least one WISE YSO (Class I, II, or transition disk) within a 3' radius. Froebrich et al. (2005) used 2MASS and pointed a 2MASS-generated extinction map to estimate the masses of star-forming globules around the region. They suggest that the increase in the star-forming activity of globules with decreasing distance from HD 206267 reflects the actions of triggered star formation through radiation pressure. Further, they find that globule mass in general increases with increasing distance from HD 206267. Barentsen et al. (2011) obtained optical photometry of the region and found linear trends in age, disk excess emission, and accretion rates with distance from the cluster center that are also consistent with sequential, triggered star formation. We return to these points in Section 4.
3.5.9. Roslund 4
Phelps (2003) calculated that Roslund 4 is at a distance 1.85 ± 0.15 kpc and has an age <4 Myr, using BV and [S ii] photometry of the cluster region. However, Delgado et al. (2004) derived 2.2 ± 0.5 kpc and an age 16 ± 6 Myr with UBVRI photometry of the cluster region and argued that an age spread is likely present. Our results show a small cluster embedded in the diffuse emission of the IC 4954 nebula, seen at 12 μm, containing Class I and Class II objects. There is also another small cluster with a higher proportion of Class I objects to the southeast at l, b = 66.78, −1.63 ("K" in Figure 1). These results taken together agree with the hypothesis that there are multiple generations of stars present in this field, since the embedded clusters are likely <5 Myr old. The CO contour map matches the main diffuse 12 and 22 μm emission, but extends out farther at l, b = 66.6, −1.1. The resolution of the contours is not high enough to capture the odd pillar of emission at 66.73, −1.41 which contains a single Class I YSO (marked "L" in Figure 1). This feature points in the direction of HD 333452—a B0III:np star (Howells et al. 2001). The only other massive star so far known in the region is HD 333444—a B8V star (Nesterov et al. 1995).
3.5.10. NGC 1624
NGC 1624 (H ii region S212) is the most distant region in our sample (6 kpc, age 4 Myr; Sujatha & Babu 2006). It appears to resemble NGC 2175 in that its central region is not completely cleared of bright 12 μm emission. Its population of YSOs is small but this is likely mainly due to its large distance. We estimate that our 90% completeness level with WISE is >7 M☉: adopting a standard Salpeter IMF (Salpeter 1955), the 16 YSOs we find inside Rmax imply a further ∼150 stars with masses >2 M☉ are present in NGC 1624. The neighboring regions (as projected on the sky) to the northwest exhibit more of the filamentary chains of Class I sources as in our other regions. The CO map matches the 12 and 22 μm emission around NGC 1624.
3.5.11. W 5 (IC 1848 and W 5 East)
The star-forming region Westerhout 5 (Westerhout 1958) is at a distance of 1.9 kpc according to studies of the central O stars by Hillwig et al. (2006). Its age has not been definitively derived, but is likely not higher than 5 Myr, given the presence of O6.5- and O7-type stars (Karr & Martin 2003). The CO data from the Galactic survey of Dame et al. (2001) show three large concentrations of gas that coincide with bright 12 and 22 μm clouds around the periphery of the two H ii regions that define W 5 and connect to a larger chain of molecular gas that extends all the way around the W 4 and W 3 regions. The distribution of YSOs that we reveal with WISE in W 5 mirrors the distribution seen in the Spitzer observations of Koenig et al. (2008) but WISE allows us to replicate this analysis over a larger field including W 3 and W 4. The central cavities of the W 5 region are filled with clusters of T Tauri stars centered on the powering O stars in the region. These clusters are non-spherical and appear to extend toward pillars of molecular gas at the periphery of the H ii region that point back toward the massive stars that sculpt them at l, b = 137.43, 0.63 (marked "M" in Figure 1). The central clusters in W 5 are similar to that in W 4 in that a central cluster of YSOs around the main O stars connects up to emerging clusters of young stars at the periphery. However, the central clusters appears denser in W 5. A calculation of the space density of sources in the central clusters of W 4 and W 5, using the nearest neighbor technique of Casertano & Hut (1985) with n = 6, shows that the peak density in the W 5 central clusters is 1.02, 1.25, and 1.59 arcmin−2 in IC 1848: 137.19, 0.92; BD +60 586: 137.42, 1.28, and W 5 East: 138.03, 1.5, respectively. This difference may be due to the YSOs in W 4 having lost their disks and being missed because our classification technique only picks out stars with infrared excess. It may also be due to a lack of sensitivity as there is a bright mass of extended emission in WISE bands 3 and 4 behind the central cluster. This feature is not present in W 5's central regions and will compromise our ability to detect YSOs in the cluster. It does not appear to coincide with any detectable CO emission in the Dame et al. map. If the density of YSOs better reflects the age sequence of W 4 and the W 5 regions, we would infer their currently derived ages are incorrect and should be reversed. We note that the distance of 2.35 kpc used by Wolff et al. (2011) is greater than that for either W 3 or W 5. Using the shorter distance of 2 kpc for W 4 would result in a greater age estimate for that region.
3.5.12. NGC 957
Yadav et al. (2008) derived an age of 10 ± 5 Myr and a distance of 2.2 ± 0.2 kpc for NGC 957. The roughly 3.59 deg2 region surveyed around NGC 957 contains 51 Class II sources, 12 Class I sources, and 2 transition disks. Within the cluster as visible in the WISE band 1 and 2 images (6 9 radius), there are two objects classified as Class I YSOs. At the estimated rate of contamination by galaxies from our classification code, we expect roughly 8–14 false Class IIs, 5–10 Class Is, and 3–10 transition disks. This estimation means that this surveyed area has a very low density of YSOs and may be almost totally devoid of stars with disks detectable by WISE. At l, b = 135.22, −2.37 and 135.22, −2.17 ("O" and "P" in Figure 1), there are two small clusters of YSOs associated with some diffuse pillars at WISE bands 3 and 4. These point north out of the image and are likely real, but unrelated to NGC 957. The CO contours appear to capture a different structure than either the open cluster NGC 957 or these pillars, and may not be associated with them.
3.5.13. NGC 659
NGC 659 is an open cluster at a distance of 3.5 kpc with an age of 22 Myr (Phelps & Janes 1994). The 3.42 deg2 region surveyed around NGC 659 also contains the open cluster NGC 663, at a distance of 2.8 kpc and an age 12–25 Myr (Phelps & Janes 1994). In the full surveyed field, we detect 66 Class II sources, 12 Class I sources, and 1 transition disk. Some of these are associated with the several pillars of 12 μm nebulosity in the image, for example at l, b = 130.28, −1.75 (marked "Q" in Figure 1). These pillars appear to point from southeast to the northwest, and may indicate another source of ionizing radiation that has shaped them and produced some of the Class II sources. At the estimated rate of contamination by galaxies from our classifi-cation scheme, we expect 8–13 false Class IIs, 5–10 Class Is, and 3–9 transition disks, thus as many as 50 of the Class II YSOs may be real. The Class I YSOs are likely all false. In the clusters themselves, there are apparently two Class II sources in NGC 659 and five in NGC 663. In their recent survey of open clusters, Mathew et al. (2008) found 3 CBe stars in NGC 659, 22 in NGC 663, and 2 in NGC 957. Although CBe stars are not YSOs, they can exhibit detectable near- and mid-IR excess emission; thus, the Class II sources that we have detected may instead be CBe stars in these older clusters. The CO contours trace out a cloud that appears to the north and east of the two clusters. Although NGC 663 coincides with diffuse emission at 22 μm, there is no associated CO emission detectable in the map.
4. DISCUSSION
4.1. Evolution of Massive Star-forming Regions
The regions we have assembled in this study suggest an evolutionary sequence by their morphology. At the young end are regions where the YSO clusters are dominated by Class I sources (like those in W 3, NGC 1624, NGC 281, and NGC 2175). Intermediate cases show a low-density cavity/H ii region that has been swept out by the first generation of star formation (as in W 4, W 5, NGC 7380, Roslund 4, Bk 59, NGC 1893, and IC 1396), with YSOs in pillars at the edges of shells of interstellar gas. The final end state of massive star-forming regions is practically devoid of YSOs (as in the regions around open clusters like NGC 957, NGC 663, or NGC 659). The fraction of YSOs in the Class I category appears to follow this morphological scheme with NGC 2175, NGC 281, IC 1795, and NGC 1624 having 30.2%, 23.1%, 20.4%, and 14.3% of their YSOs as Class I. The ages listed for the regions in Table 2 do not exactly agree with this morphological scheme, with NGC 281 and NGC 1624 at 3.5 and 4 Myr, respectively. However, these more distant regions will suffer more strongly from incompleteness in the Class II sample than in the Class I population (since the latter are brighter in the mid-IR) and so may have an artificially high Class I:Class II ratio. In Figure 2, we plot the fraction of stars in Class I relative to Class I and Class II combined (dropping the transition disk candidates which we consider unreliable) as a function of age. The error bars represent simple  counting statistics and do not account for completeness or possible contamination. A trend of declining ratio with age is visible by eye, however, each region has multiple episodes of star formation within it (and so an age range may be more appropriate rather than a single value), and the ratio is affected by the level of bright background which would likely lower the ratio in the younger regions like NGC 2175 (the leftmost point in the figure). The large intrinsic age spreads combined with the large uncertainties in determining stellar ages also mean that the trend as presented here is not statistically robust. Continuously occurring star formation and the timing of the appearance of secondary generations of star formation will also alter the relationship between the ratio and (central cluster) age.
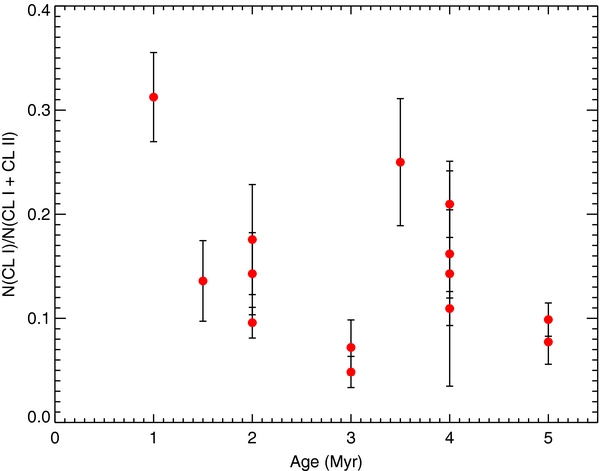
Figure 2. Plot of the Class I:(Class I + Class II) ratios for the star-forming regions listed in Table 2 as a function of the central cluster age listed in Table 1. Error bars represent Poissonian statistic errors.
Download figure:
Standard image High-resolution image4.2. Pillars and Mountains of Creation
The later episodes of star formation around the edges of the young massive regions are frequently seen in pillar or mountain-like structures that point back toward the ionizing sources that created the cleared out H ii regions. However, they are not all the same sizes. Within the same region, a star-forming clump at the edge of the H ii region bubble may contain a cluster with many young stars forming within it, or instead a solitary star or very small cluster. The outcome of these secondary generations of star formation is likely driven by the initial properties of the molecular gas at these locations, prior to their formation in the process described by Thompson et al. (2002). We show a sample of image cutouts around the peripheral clusters in the regions of this survey in Figure 3.

Download figure:
Standard image High-resolution image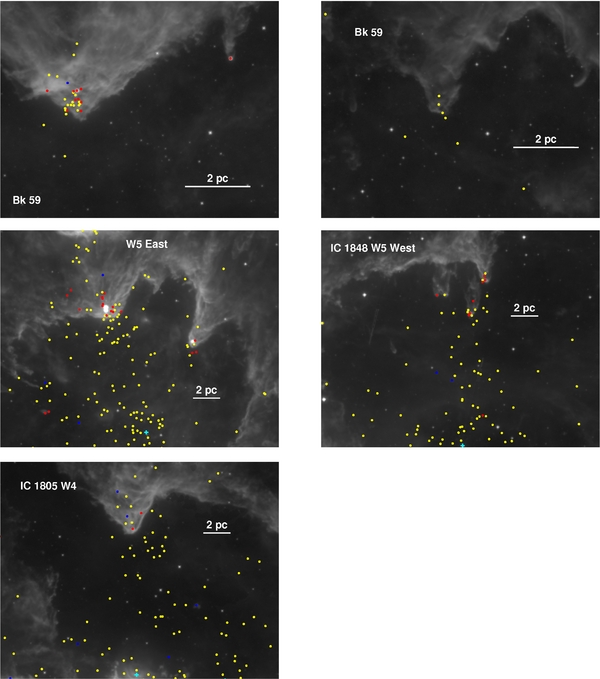
Figure 3. Image cutouts around pillars, cometary clouds, and similar features at the edges of the star-forming regions surveyed in this paper. Colored points represent Class I (red), Class II (yellow), and transition disks (blue). If marked, light blue crosses indicate the likely ionizing O star(s) in the region; otherwise, ionizing sources are off panel directly downward.
Download figure:
Standard image High-resolution imageFroebrich et al. (2005) discovered that the mass of gaseous globules detected within their extinction map of IC 1396 increased with increasing distance from the central O star HD 206267. They also tentatively claim that the observed star density (number of stars versus the projected area of the globules) falls off with increasing distance from the central star or stars. We find in IC 1396 and other regions like Bk 59 that stars are forming in both large and small clumps at the same projected distance from the central stars. For example, the Bk 59 panels in Figure 3 show that large structures can form clusters while at the same time, at likely the same distance from the central O star, small globules are forming small clusters or single stars. This observation suggests that star formation at the boundaries of H ii regions may be strongly influenced by the mass and perhaps the density structure in the molecular core at the time it encounters the O star wind and pressure from the adjacent freshly ionized gas.
4.3. Triggered Star Formation
Triggered star formation is a process that has been proposed and discussed at some length in the literature but still remains only a plausible hypothetical process (e.g., Elmegreen 1998). From the observed distributions of young stars in this sample of star-forming regions, we attempt to assess how well the ensemble average distribution follows a pattern consistent with passive, stochastic star formation, or actively triggered star formation.
To investigate these two cases, we measure the distribution of YSOs found in the survey in each region except the three older open clusters (NGC 659, 663, and 957). In each case, we derive the surface density histogram as a function of radial distance from the cluster centers as listed in Table 2. We calculate the distribution out to the radius 1.5× Rmax, where Rmax represents the visually identified boundary of the expanding H ii region shell. The 12 and 22 μm emission that traces these arcs and rings is likely produced by dust and/or PAH grains illuminated on the surface of cold, dense gas. We interpret these circles as expanding bubbles and investigate the distribution of young stars picked out by our selection criteria within them. In the case of W 3/W 4/W 5 there are five circle centers (IC 1795, IC 1805, IC 1805 South, IC 1848, and W 5 East). In W 4 and Bk 59 there are two. To calculate the surface density histograms, we measure the radial distance to each star from the assumed center, normalized to Rmax, and then derive the surface density of stars in annuli around the cluster center of width 0.1 dimensionless distance units. We use only the lists of Class I and Class II sources, since the transition disk list is more unreliable and only contributes a small number of objects.
In Figure 4, we show the results for the individual clusters. In this sample, the young regions present similar configurations of star formation, in that more embedded clusters of stars often coincide with the edges of the bubbles we have traced out. This distribution can be seen in the peak-up in space density at normalized radii ∼1 in NGC 7380, NGC 2175, IC 1805 South, Roslund 4, and Bk 59 East. However, several regions, NGC 281, NGC 1893, IC 1396, Bk 59 West, IC 1805, IC 1848, and W5 West, also contain large, roughly central clusters of YSOs that dominate the density distributions at small and intermediate radii.
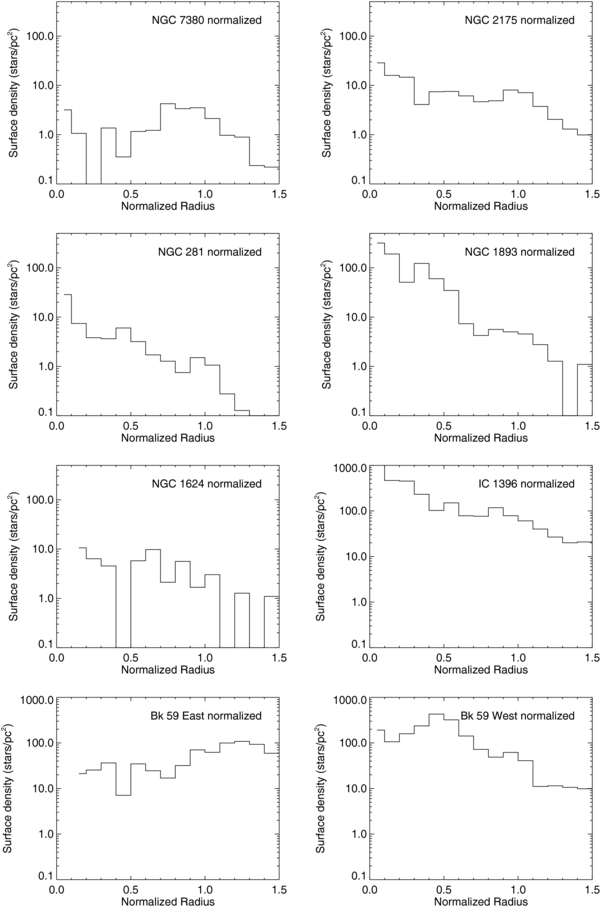
Figure 4. Surface density histograms for the younger star-forming clusters.
Download figure:
Standard image High-resolution imageNext we construct an averaged surface density histogram to sum over the peculiarities of this sample of regions and arrive at a more general measurement of the configuration of young stars in massive star-forming regions. The average plot shown in Figure 5 is produced by adding all young stars from all regions at their normalized radii from the cluster centers and calculating a new surface density distribution from that. The act of combining the distributions of these several regions that are likely at different ages and different stages of star formation produces a time-average of the bubble expansion and triggering process.
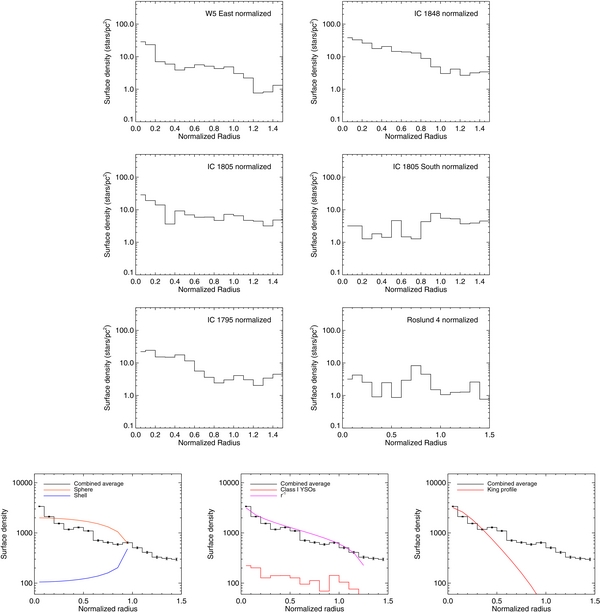
Figure 5. Plots of the averaged distribution of all regions, overlaid with blue line showing expected surface density distribution of a uniform thin shell of stars and red line showing the distribution of a uniform filled sphere (left panel), red line showing the profile of a r−1 density distribution (center panel), and red line showing a King profile (King 1962; right panel). The center panel also shows a red histogram of the Class I sample by itself.
Download figure:
Standard image High-resolution imageIn the case of passively occurring star formation, although new young stars will not uniformly fill space as they form inside a giant molecular cloud, averaged over many regions, multiple bursts of star formation arranged randomly might approximate a uniformly filled sphere. Although an individual cloud's internal structure might not be uniform and smooth (consisting of filaments or cores, etc.), it could, to a zeroth-order approximation, be uniformly filled. The average region initially might have contained a giant molecular cloud whose size is comparable to that of the regions studied (∼50 pc or so). We calculate the expected surface density distribution of a uniform filled sphere of size Rmax at impact parameter x:

We also derive the distribution produced by a uniform empty shell of size Rmax with a thickness 2% of its radius in bins of size Δx:
We overplot these two simple cases in the left panel of Figure 5. Neither the filled nor the empty shell model comes close to describing the measured average YSO distribution.
At small radii (≪Rmax), the central clusters in the assembled regions plausibly dominate the measured average surface density distribution. Thus, we also compare the measured distribution with a King profile (King 1962). The full expression for a King profile is
where in Figure 5 (right-hand panel) we have set rc, the scale factor or "core radius," to 0.35 and rt the limiting or tidal radius to 1.3. Only the central portion of the average YSO density distribution follows the shape of a King profile; a King-like distribution drops off far too rapidly in density with distance from the center to match the data. The King profile was originally developed to match the density distribution of gravitationally relaxed stellar groups such as globular clusters. The lack of a match in the case of the present survey is not surprising and simply reflects that these central clusters are not dynamically relaxed associations of stars. Lada et al. (1984) found that clusters that remain bound after gas dispersal undergo significant expansion as they emerge from a cloud and in the process may lose 10%–80% of their stars. Such evaporating stars would contribute to a smooth, flatter-than-King surface density profile. However, evaporating stars would not tend to cluster in the molecular globules and elephant trunks that we see at the periphery of the studied regions.
Since the actual density appears to fall off smoothly, we also investigated power-law models for the volume density distribution of YSOs, with density ρ(r) = ρ0(r/Rmax)n, where r is the three-dimensional distance from the cluster center. We found that an r−1 law corresponds to a surface density distribution similar to the measured distribution, as shown in the center panel of Figure 5. The analytical form of the profile is

Given that ρ∝r−1 approximates the YSO volume density distribution, we can integrate to derive the total count of YSOs, C = 2πρ0R3max, and the count within radius r1, C(r1) = 2πρ0Rmaxr21. The fraction of stars that lie within the inner half-radius r1 = 0.5 Rmax is thus 1/4. In other words, three-fourths of the YSOs in the spherical distribution lie at a radial distance r > Rmax/2.
We note that the cleared out H ii region cavities in these massive star-forming regions will have much lower line-of-sight extinction than the peripheral embedded clusters and so the rate of contamination by background galaxies and stars will be much higher there (radii 0.4–0.8 in Figure 5). Since the peripheral new embedded clusters form in regions of dense gas and thus high extinction, the young stars that we find there are probably less affected by contaminants. Accounting for this effect would likely accentuate the peak-up in stellar density at radii ∼1. At all radii our survey is incomplete, since our YSO identification technique misses cluster members that no longer possess an infrared excess and is compromised on regions of bright nebulosity. Thus, the true averaged distribution may not exactly resemble the ρ∝r−1 trend.
We now consider what this result suggests in regard to models of triggered star formation. Two major paradigms are relevant here. The first is the "collect and collapse" process of triggered star formation, where the initial generation of stars forms and then material is swept away from it by the massive stars' winds and ionizing radiation (see Elmegreen 1998 for a summary of the relevant literature). Once a critical density of material has accumulated in the swept-up gas, new bursts of star formation occur. The varying initial distributions of molecular gas in the molecular cloud will likely produce broken rings or arcs of swept up material rather than complete shells. More importantly for our analysis, this process would be likely to produce an average distribution with two components to it: the interior, initial cluster and a separate exterior shell of the second, triggered generation of stars. The second mechanism is the so-called RDI of pre-existing overdensities in the molecular cloud. As sketched out by Reipurth (1983) and developed analytically by Bertoldi (1989) and Bertoldi & McKee (1990), regions of higher density are eroded more slowly as the initial burst of massive star formation ionizes and pushes away the molecular cloud, leaving them exposed. The pressure of the ionized H ii region compresses the revealed clump, causing new stars to collapse therein, as it is pushed farther away. If we assume that the distribution produced by the collect and collapse process will consist of a central peak in density, a lower density surrounding region and a second peak up at the cluster boundary, while the RDI process will not result in such a two-component distribution, we argue that the fact that our data is approximated well by a simple density law more strongly supports RDI as the dominant process of triggering in massive star-forming regions.
Recent simulations of massive star formation have been presented by Dale & Bonnell (2011). The Dale et al. simulations propose that the collapse of a giant molecular cloud will create a filamentary structure of dense gas within it, which collapses still further to form stars. The evacuated bubbles and peripheral embedded clusters in pillars and elephant trunks seen in massive regions—such as those in this survey—represent the influence of the central massive star clusters on pre-existing structures in the gas (for example, RDI) rather than an accumulation and collapse process.
We argue that we are seeing the relic of the initial filamentary structure of the gas in the distributions of the YSOs in these regions. The r−1 distribution that is seen in the averaged distribution plot is simply the result of combining individual irregularities in the many different clouds we have surveyed. The central, most massive group of stars that forms—containing the most massive stars—erodes the cloud around it, and while stars may already be forming in the dense filaments, the actions of RDI will enhance this star formation by compressing the collapsing structures as the H ii region bubble expands.
Since most of the gas is in the filaments, there is not enough material in the less dense regions to be gathered up as in the collect and collapse process model, although this mechanism cannot be ruled out completely. For example, the expanding bubble could impinge on a filament tangential to its surface and pile up additional material there, producing new star formation.
The distributions of YSOs that we see in this sample of regions suggest that star formation may in general be triggered around massive star-forming clusters rather than passively formed, although it is certainly possible that episodes of spontaneous star formation occur around these regions and even alongside triggered star formation. The most crucial tests of this theory will be a precise and accurate determination of the relative ages of the central and surrounding clusters, a measurement of their three-dimensional proper motions, and establishing a YSO population free of external contamination.
4.4. The Fireworks Hypothesis
If the r−1 is indeed a good fit to the distribution of stars, we infer that triggered star formation is self-propagating because each "original" young star yields something like three "new" young stars in its neighborhood; YSOs at r > 0.5 Rmax outnumber those at smaller radial distances by 3 to 1. If an initial generation of star formation triggers a large enough secondary generation to populate the upper end of the IMF, we postulate a "fireworks hypothesis" whereby some of the new stars formed will be massive and lead to subsequent generations of star formation. In an analogy to a nuclear chain reaction, the process presumably will continue until the fuel source (nearby molecular cloud material) is exhausted or dispersed or until the new generation of stars does not contain enough massive stars to continue the propagation of this process. We note that since our study is only sensitive to objects with infrared excess, it is possible that since the triggered population is younger, and it likely has a higher disk fraction than the central, triggering stars. As we have noted, the exact function of the distribution of stars may not be r−1, and thus the number of new YSOs may be less than three times the initial generation.
This process may be rapid. Assuming that the central clusters we have detected are the first generation to form, the peripheral clusters are evidently forming very soon after that the first stars have not had time to disperse most of their optically thick, mid-IR emitting accretion disks. Whether or not there is a causal relationship between the interior and peripheral populations of star formation, this observation implies that the time difference between the two events is short, given that the half-life for the thick-disk population (i.e., disks that are bright from 3 to 24 μm) is roughly 2 Myr (Hernández et al. 2008). If the bubble expansion ages are also short, this would lend further weight to this picture of rapid successions of star formation. Assuming an expansion velocity of 10 km s−1, the apparent bubble radii of 3–24 pc in our sample would only require at most 2.4 Myr to form. In the center panel of Figure 5, we have overplotted the averaged radial distribution (in red) of the Class I sources by themselves. As can be seen, their distribution is flatter: the ratio between the central density and the density at r ≈1 is about 1.5 in the Class Is versus 3.8 in the full YSO sample. Since Class I objects are likely younger on average than Class II YSOs, this result supports the idea that the YSOs evolve on approximately the shell expansion timescale. However, the bubble expansion times may not be quite so short. Barentsen et al. (2011) find an age difference in the YSOs in IC 1396 of 1 Myr over a distance of 5 pc, and the age differences found within other galactic and between separate extragalactic star-forming regions are more like 3 Myr over a typical distance of 10 pc (Elmegreen 2000). Since we do not know the actual disk fraction of the central clusters, if the fraction of stars with disks is 40% or 30%, the implied central cluster age would be more like 3–4 Myr, bringing the timescale closer to these slower measurements.
We emphasize that the fireworks hypothesis process described here should be placed in the context of much larger superbubble star formation. For example, Patel et al. (1998) describe a model of sequential massive star formation to explain the ∼50 pc radius Cep OB2 bubble, which contains IC 1396 as one of its secondary generations at the periphery. Similarly, Sato et al. (2008) find that the space motions of NGC 281 out of the Galactic Plane are consistent with it being at the edge of an even larger expanding bubble of 130 pc radius (Megeath et al. 2003). It is unclear at present how the two regimes differ in the role of triggering and the mechanisms which operate on these scales. Further expansion of the study to more regions to test our conclusions about RDI and to larger regions to compare with the process of star formation on superbubble scales will be vital to improve and refine our understanding of the progression of star formation in the Galaxy.
5. CONCLUSIONS
We have carried out a study of a sample of outer Galaxy young, massive star-forming regions and three comparison young open clusters with data from the WISE telescope. Using a newly developed classification scheme presented here to identify stars as YSOs and remove extragalactic contamination, we have studied the distributions of young stars within each region. These distributions lead us to conclude that in almost every case, a massive star-forming region will have multiple generations of star formation within it. The latter generations may be triggered by the winds and radiation of the first burst of star formation, but may also simply be star-forming events that initiated after the first and are emerging from their molecular clouds as massive star winds and supernovae sweep them away. We argue from the averaged distributions of the YSOs that the triggered mode is more strongly supported. From the smooth, roughly r−1 three-dimensional distribution of YSOs found in the average region of massive star formation, we further argue against a "collect and collapse" mode of triggered star formation, and suggest instead that subsequent generations of stars form progressively during the short-lived "bubble" expansion phase (∼5 Myr), during which an occasional new massive star will continue the chain reaction until the molecular cloud material is dispersed. Triggered star formation appears to be self-propagating and should produce interstellar fireworks.
We have analyzed the structures around the edges of these massive star-forming regions. We observe large (1–3 pc size) concentrations of gas containing small clusters of emerging Class I and Class II sources, but also smaller globules forming perhaps as few as one new star. This observation implies that initial structure within the giant molecular cloud will also play a role in the development of star formation within it, superimposing itself in the triggering process.
The WISE survey preliminary release covers 57% of the sky and contains many more regions of star formation. The tools we present in this paper for extracting and classifying YSOs should prove a useful resource in understanding star formation across the whole Milky Way.
The authors thank Britt Griswold and Dan Stern for vital contributions to this paper. We thank the referee for a helpful report that improved the paper and its conclusions. This research was supported by an appointment to the NASA Postdoctoral Program at the Goddard Space Flight Center, administered by Oak Ridge Associated Universities through a contract with NASA. This work is based on data obtained from (1) the Wide-Field Infrared Survey Explorer, which is a joint project of the University of California, Los Angeles, and the Jet Propulsion Laboratory (JPL), California Institute of Technology (Caltech), funded by the National Aeronautics and Space Administration (NASA); (2) the Two Micron All Sky Survey, a joint project of the University of Massachusetts and the Infrared Processing and Analysis Center (IPAC)/Caltech, funded by NASA and the National Science Foundation; (3) the SIMBAD database, operated at CDS, Strasbourg, France; and (4) the NASA/IPAC Infrared Science Archive, which is operated by JPL, Caltech, under a contract with NASA.
Facilities: Spitzer (IRAC, MIPS) - Spitzer Space Telescope satellite
APPENDIX
We adapt the established source classification scheme of Gutermuth et al. (2008, 2009) to the WISE telescope wavebands. Consequently, our scheme follows the same steps. The figures included with the text in this section present objects detected by WISE (listed in the preliminary release catalog) from the compilation of Rebull et al. (2010). In their paper, Rebull et al. (2010) compile 215 previously identified members of the Taurus star-forming region and identify 148 new candidate members with optical, X-ray, and ultraviolet imaging. In this appendix, red, blue, and gold points mark previously known YSOs from their Table 4 (Class I, flat spectrum, and Class II), while pale red, pale blue, and yellow mark the new YSOs from their Table 5. The figures shown are used to demonstrate the context of each set of classification criteria with respect to known source types.
Our scheme is described below and is designed to be applied in the order it is written. Note that at each stage in the following scheme, objects are classified in the specified category with the given set of color and magnitude criteria and are set aside from further consideration unless specifically described in the text.
A.1. Extragalactic Object Removal
The sample of YSOs that we derive from the WISE data comes primarily from the matched WISE bands 1, 2, and 3 catalogs (3.4, 4.6, and 12 μm) that we produce for each field, requiring photometric uncertainty <0.2 mag in all three bands. The first step in extracting young stars is to remove objects from the merged catalog that are most likely to be unresolved external galaxies.
The Spitzer Deep, Wide-Field Survey catalog (Ashby et al. 2009) has been matched to WISE data for the same 8.5 deg2 area of Boötes. We developed our criteria by plotting these data, as they will likely be dominated by external galaxies in WISE color space. For comparison, we also extracted WISE photometry from the north and south equatorial poles (decl. > +8822 and also decl. < −8822) which we assume will also consist mostly of galaxies.
In Figure 6 we plot a color–color diagram of the objects detected in the north polar field, requiring photometric error <0.2 in WISE bands 1, 2, and 3. For comparison, we overplot tracks showing the location of the galactic SED templates of Assef et al. (2010). Although labeled as E (elliptical), Sbc (spiral), Im (Magellanic irregular), and AGN, these templates are not built to look like specific galaxy types, but are used to model galaxies as composites of different populations. The templates are not orthogonal by design, but are intended to reproduce the typical components of galaxies: old (E), intermediate (Sbc), and young stellar populations (Im), as well as nuclear activity (AGN).
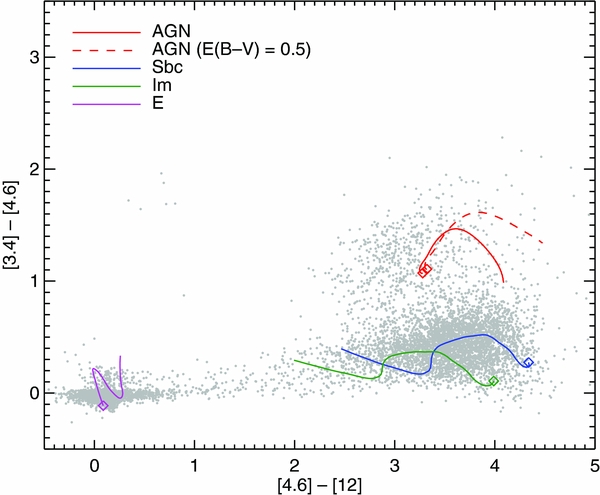
Figure 6. WISE band 1, 2, and 3 color–color diagram showing the distribution of objects detected by WISE with decl. >8822 which are likely dominated by external galaxies. Overlaid are tracks showing the galaxy templates of Assef et al. (2010): E (elliptical), Sbc (spiral), Im (Magellanic irregular), and AGN. Each track covers the redshift range z = 0 (marked with a diamond point) to z = 1.1, except AGNs which show z = 0–3.
Download figure:
Standard image High-resolution imageGalaxies with elevated star formation activity exhibit increased PAH-feature emission which gives them red colors in the Spitzer 5.8 and 8 μm bands and this property is similarly observed in the WISE [4.6] − [12] color. We thus label objects following all the constraints below as PAH/star-forming galaxies. These equations hold to delimit the region drawn in Figure 7:


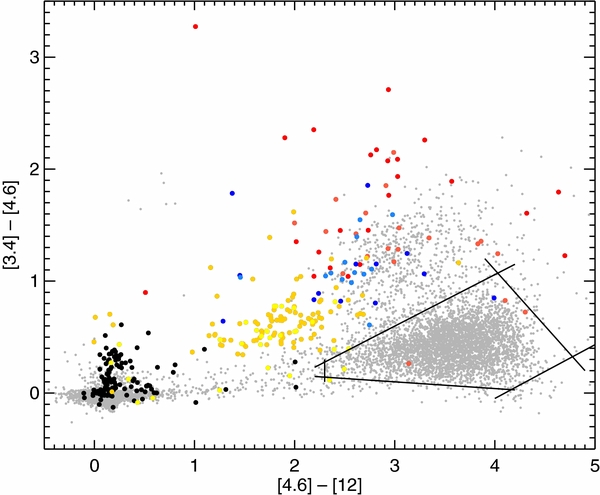
Figure 7. WISE band 1, 2, and 3 color–color diagram showing the distribution of diskless (black points), Class II (gold and yellow), flat SED (blue and light blue), and Class I YSOs (red and light red) from the Taurus compilation of Rebull et al. (2010) detected by WISE. Gray points show the location of objects detected by WISE with decl. >8822. Solid lines show the region from which we cut PAH/star-forming galaxies.
Download figure:
Standard image High-resolution imageUnresolved broad-line AGNs possess mid-IR colors very similar to young stars. However, on average they will be fainter than a typical young star in Galactic regions closer than ∼5 kpc, thus we use a brightness cut in WISE band 2 as the primary discriminant. We consider as candidate AGN those sources following either set of conditions below (see Figure 8):


or


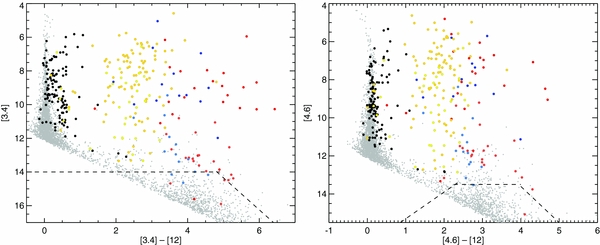
Figure 8. WISE color–magnitude diagrams showing diskless (black points), Class II (gold and yellow), flat SED (blue and light blue), and Class I YSOs (red and light red) from Rebull et al. (2010) detected by WISE. Gray points show the location of objects detected by WISE with decl. >8822, where we have removed objects meeting the "PAH" criteria in our scheme. Dashed lines show the regions from which we cut likely AGN contaminants.
Download figure:
Standard image High-resolution imageBoth star-forming galaxies and AGNs are removed from further consideration as YSOs in the following treatment. As discussed in Gutermuth et al. (2009), Koenig et al. (2008), and Rebull et al. (2011), these criteria are imperfect as they misclassify some fraction of the extragalactic objects and also remove some fraction of true YSOs from the catalog, since faint YSOs will overlap the AGN and star-forming galaxy color/magnitude boundaries. We estimate from the Boötes field sample that 4.7 ± 0.7 galaxies deg−2 will appear in the YSO list as Class II sources, 2.4 ± 0.5 deg−2 will appear as Class I sources, and 1.8 ± 0.5 will be false transition disk objects. The north and south pole fields result in a slightly lower number of fake YSOs: the combined range of these fields, including Poisson errors, is 1.4–2.9 Class I sources, 2.2–5.4 Class II sources, and 0.9–2.7 transition disk sources per square degree.
These values are sensitive to the relative depths of WISE coverage (which is deeper at the poles than in the ecliptic, due to the orbit of the WISE telescope), any bright extended emission in the image and natural variability in the space density of stars and galaxies. For example, in the study of the wider environment around the Taurus star-forming region by Rebull et al. (2011), 724 of their 1014 YSO candidates were found to be likely contaminant galaxies, foreground or background stars, or other objects. Their sample required signal-to-noise ratio >7 in WISE bands 1, 2, 3, and 4, and resulted in 2.75 total fake YSOs per square degree after comparison with available spectroscopy and existing catalogs. Extrapolating this result to a WISE band 1, 2, and 3 sample in line with this paper, we still find only 4.8 fake YSOs per square degree. Thus, the quoted level of contamination that we present is likely an overestimate in most Galactic star-forming regions.
A.2. Shock Emission Blobs and Resolved Structure
We next remove two classes of image contaminants from the remaining catalog. As discussed by Gutermuth et al. (2009), the first are resolved shock emission knots—in Spitzer images these are prominent in the 4.5 μm band. The same is likely true of the WISE 4.6 μm band. The second class is resolved structured PAH emission; in WISE data, these are mainly fake detections at 12 μm due to the comparable point source-response-function of WISE at 12 μm and size scale of structure in the copious PAH nebulosity that is prevalent in star-forming regions.
Shock objects are those with the following colors:

and
Resolved PAH emission objects require either

and
or
and
A.3. Young Stellar Objects
Having removed the previously defined contaminants, we next identify YSOs using the list of objects with good three-band WISE detections, i.e., those possessing photometric uncertainty <0.2 mag in WISE bands 1, 2, and 3. We have tested the following scheme by comparing the various color criteria with the photometry of Taurus region YSOs listed in Rebull et al. (2010) that are also detected by the WISE telescope. See Figure 9 for the following steps. Class I YSOs (candidate protostars) are the reddest objects, and are selected if their colors match:

and

Figure 9. WISE band 1, 2, and 3 color–color diagram showing the distribution of diskless (black points), Class II (gold and yellow), flat SED (blue and light blue), and Class I YSOs (red and light red) from the Taurus compilation of Rebull et al. (2010) detected by WISE. Dashed lines indicate the boundaries by which we classify Class I and Class II sources.
Download figure:
Standard image High-resolution imageClass II YSOs (candidate T Tauri stars) are slightly less red objects, and are selected with colors:

and
where
and

where σ(...) indicates a combined error, added in quadrature.
A.4. Using 2MASS Data
Many objects visible in WISE bands 1 and 2 will lack a reliable band 3 or 4 detection, due to the bright background emission present at these longer wavelengths and the drop in sensitivity. To make up for this, we match the WISE catalog to the 2MASS JHKS point-source catalog (Skrutskie et al. 2006). We match using a 3'' search radius, removing objects from the 2MASS catalog with photometric quality flags D, E, F, or X in any band. This stage of the scheme requires a measurement of the intrinsic colors of objects, removing line-of-sight extinction to each source. We directly adopt the technique described by Gutermuth et al. (2005) and use the 2MASS JHKS point-source catalog (cleaned for photometric quality as above) to generate an extinction map for each region with 36'' pixels. For each source in the merged WISE+2MASS source list, we take the median extinction value in a 3 × 3 pixel grid around the nearest pixel in the extinction map. Each source's WISE+2MASS photometry is then dereddened using the extinction law presented in Flaherty et al. (2007).
Using these dereddened colors, we find additional Class II objects requiring the following dereddened colors from the remaining unclassified objects (see Figure 10):

and

and

and

where

where σ(...) indicates a combined error, added in quadrature.
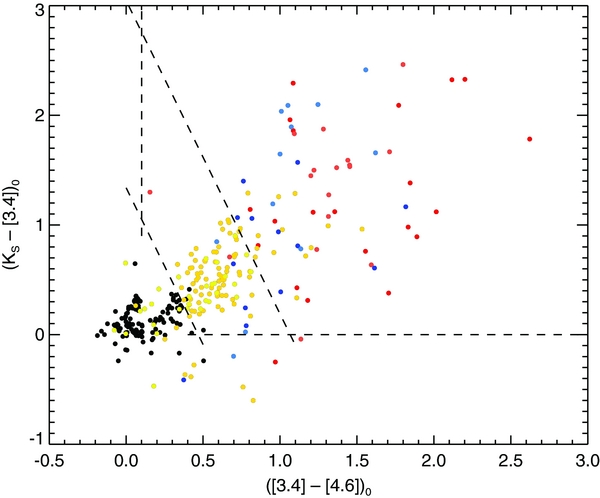
Figure 10. 2MASS KS and WISE band 1 and 2 color–color diagram showing the distribution of diskless (black points), Class II (gold and yellow), flat SED (blue and light blue), and Class I YSOs (red and light red) from the Taurus compilation of Rebull et al. (2010) detected by WISE. Dashed lines indicate the boundaries by which we classify Class I and Class II sources.
Download figure:
Standard image High-resolution imageAmong these new Class II objects, we classify the reddest objects as Class I objects with

A.5. WISE Band 4 22 μm Photometry
In the same way that Gutermuth et al. (2008) used Spitzer MIPS 24 μm data to identify evolved so-called transition disks and confirm that Class I sources SEDs continue to rise at long wavelengths.
We first identify as "transition disks" (disks with photospheric colors between 3.4 and 12 μm but an excess at 22 μm) objects with photometric error <0.2 in WISE bands 1, 2, and 4 and
and

Figure 11 shows the location of the Class I criteria specified above and the region in which we find candidate transition disk objects.
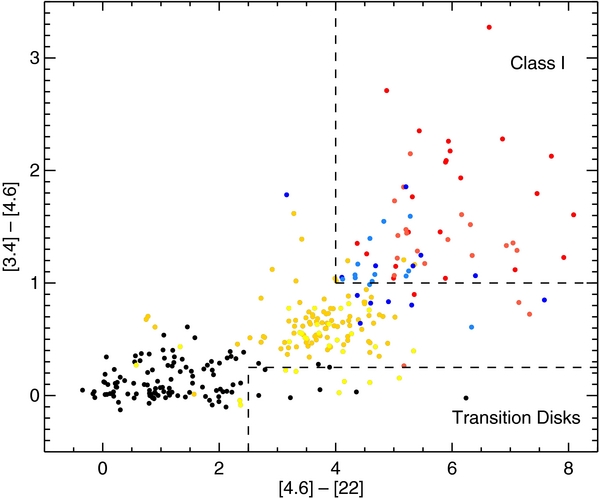
Figure 11. WISE band 1, 2, and 4 color–color diagram showing the distribution of diskless (black points), Class II (gold and yellow), flat SED (blue and light blue), and Class I YSOs (red and light red) from the Taurus compilation of Rebull et al. (2010) detected by WISE. Dashed lines indicate the boundaries by which we confirm Class I and locate transition disk candidate sources.
Download figure:
Standard image High-resolution image
We check that previously classified Class I stars that possess photometric error <0.2 in WISE band 4 have rising SEDs at 22 μm. If they do not, they are considered reddened Class II sources and re-classified as such if
We also eliminate Class II stars that possess excessively blue colors. While these may possibly be stars with disks, we conservatively reject them as T Tauri stars and place them back in the unclassified pool if

Footnotes
- 5
- 6
- 7