


ABSTRACT
We report the first tungsten isotopic measurements in stardust silicon carbide (SiC) grains recovered from the Murchison carbonaceous chondrite. The isotopes 182,183,184,186W and 179,180Hf were measured on both an aggregate (KJB fraction) and single stardust SiC grains (LS+LU fraction) believed to have condensed in the outflows of low-mass carbon-rich asymptotic giant branch (AGB) stars with close-to-solar metallicity. The SiC aggregate shows small deviations from terrestrial (= solar) composition in the 182W/184W and 183W/184W ratios, with deficits in 182W and 183W with respect to 184W. The 186W/184W ratio, however, shows no apparent deviation from the solar value. Tungsten isotopic measurements in single mainstream stardust SiC grains revealed lower than solar 182W/184W, 183W/184W, and 186W/184W ratios. We have compared the SiC data with theoretical predictions of the evolution of W isotopic ratios in the envelopes of AGB stars. These ratios are affected by the slow neutron-capture process and match the SiC data regarding their 182W/184W, 183W/184W, and 179Hf/180Hf isotopic compositions, although a small adjustment in the s-process production of 183W is needed in order to have a better agreement between the SiC data and model predictions. The models cannot explain the 186W/184W ratios observed in the SiC grains, even when the current 185W neutron-capture cross section is increased by a factor of two. Further study is required to better assess how model uncertainties (e.g., the formation of the 13C neutron source, the mass-loss law, the modeling of the third dredge-up, and the efficiency of the 22Ne neutron source) may affect current s-process predictions.
Export citation and abstract BibTeX RIS
1. INTRODUCTION
Stardust grains condensed directly from the gas phase present in ancient stellar outflows or stellar ejecta and thus became part of the interstellar medium from which our solar system formed about 4.57 Gyr ago. Their stellar origins are indicated by unusual isotopic compositions (essentially for every element) relative to those found in solar system materials (i.e., terrestrial, lunar, and meteoritic samples). The deviations from the recommended solar system isotopic abundances, which are taken from compilations of isotopic measurements of terrestrial materials except for H and the noble gases (e.g., Anders & Grevesse 1989; Lodders 2003, 2010), are too large to be explained by mass-fractionation processes or by decay of longer-lived radioactive isotopes. Instead, the observed isotopic compositions can only be explained by nucleosynthetic processes (see reviews by Zinner 1998, 2004; Clayton & Nittler 2004; Lodders & Amari 2005).
Isotopic compositions of several heavy elements have been measured in stardust grains believed to have condensed in the outflows of low-mass carbon-rich asymptotic giant branch (AGB) stars (e.g., Zr, Nicolussi et al. 1997; Mo, Nicolussi et al. 1998a; Sr, Nicolussi et al. 1998b; Ba, Savina et al. 2003; Ru, Savina et al. 2004). The grain data have provided detailed information on the nucleosynthesis of heavy elements produced by the slow neutron capture process (the s-process). However, the available data are still scarce or no data exist for some heavy elements. One of the main gaps involves nuclides in the Hf–Ta–W–Re–Os region.
The s-process path in the Hf–Ta–W–Re–Os region (Figure 1) has recently received considerable attention. New experimental data (neutron-capture reaction rates) for Hf, W, and Os nuclides have been reported (Sonnabend et al. 2003; Mohr et al. 2004; Mosconi et al. 2006, 2010a, 2010b; Wisshak et al. 2006; Segawa et al. 2007; Vockenhuber et al. 2007; Marganiec et al. 2009; Fujii et al. 2010), and small anomalies of nucleosynthetic origin in W and Os isotopes have been observed in primitive meteorites (Brandon et al. 2005; Yokoyama et al. 2007, 2011; Qin et al. 2008; Reisberg et al. 2009). Recent s-process analyses of the Hf–Ta–W–Re–Os region have identified two major problems. First, it appears that model predictions underestimate the s-process contribution to the 182W solar abundance and, consequently, the 182W r-residual (obtained by subtracting the calculated s-process from the observed solar system abundance) shows a significant positive deviation from the otherwise very smooth rapid neutron-capture process (the r-process) solar abundance pattern (see Figure 12 of Wisshak et al. 2006; Figure 6 of Vockenhuber et al. 2007). Second, an analysis of the s-process flow at the 185W branching point shows that the predicted 186Os s-process abundance is also somewhat problematic, suggesting a significant overproduction (∼20%) with respect to its solar abundance (Sonnabend et al. 2003). This is not allowed, theoretically, because 186Os is an s-only isotope, being shielded by the stable 186W from the chain of radioactive decays that follow the r-process. In line with this, isotopic anomalies of nucleosynthetic origin found in Os isotopes measured in primitive meteorites suggest a lower 186Os/188Os s-process ratio than current models predict (Brandon et al. 2005; Yokoyama et al. 2007). The problematic 182W and 186Os s-process abundances and, consequently, the inferred 182W r-residual, may reflect remaining uncertainties related to the experimental cross section data and the current s-process models.
Figure 1. Part of the nuclide chart showing the s-process nucleosynthesis path in the region of Hf–Ta–W–Re–Os (modified from Hayakawa et al. 2005; and Dillmann et al. 2006). Percent abundances (non-italic) are shown for each stable isotope (solid boxes) and laboratory half-lives (italic) for each unstable isotope (dashed line boxes). Half-lives at stellar temperatures may be different, as discussed in the text. The main s-process path is shown as a bold line and branches and secondary paths are shown as finer lines, s-only isotope 186Os is indicated by a bold box. Download figure:
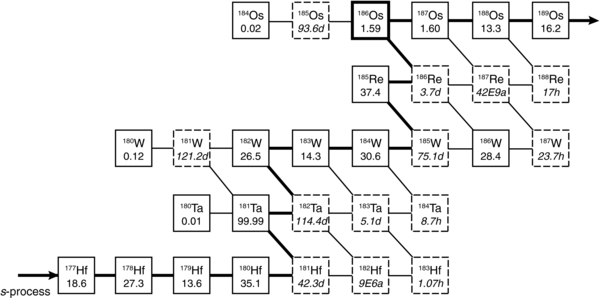
Tungsten has five stable isotopes: the rare 180W (0.12% of solar W), which is mainly produced by proton capture or photodisintegration processes (p-process), and 182W (26.5%), 183W (14.3%), 184W (30.6%), and 186W (28.4%), which are of mixed s- and r-process origin. As illustrated in Figure 1, the branchings at 181,182Hf and 182,183Ta may affect the W s-process isotopic pattern, and the branching at 185W determines the 186W abundance and may affect the Re and Os isotopic patterns.
Here, we report the results of the first W isotopic analyses performed on five large stardust silicon carbide (SiC) grains (LS+LU fraction) extracted from the Murchison carbonaceous chondrite (Amari et al. 1994). In addition to the individual grains, we also analyzed an SiC-enriched bulk sample (KJB fraction; Amari et al. 1994). Carbon-, N-, and Si-isotopic ratios for the KJB fraction and individual SiC grains from the LS+LU fraction have been previously reported by Amari et al. (2000) and Virag et al. (1992), and are reproduced in Figure 2 and Table 1. The mount containing grains from the LS+LU fraction used in this study is the same previously investigated by Virag et al. (1992) and Ireland et al. (1991). Virag et al. (1992) have shown that SiC grains from the LS+LU fraction contain several unique features: some are very large (over 20 μm); many of these large grains appear to have flat and smooth surfaces, unlike the euhedral surfaces observed in smaller grains; and isotopic compositions show clustering for C and Si and even for Ti (Ireland et al. 1991). Recent studies have shown that stardust SiC grains from the LS+LU fraction have interstellar exposure ages ranging from ∼3 Myr to ∼1 Gyr (Gyngard et al. 2009a, 2009b; Heck et al. 2009), which implies that the parent stars of the grains must have ended their lives within this time range before the formation of the solar system. Based on their C-, N-, and Si-isotopic compositions, the five single SiC grains analyzed for W are classified as "mainstream grains," and are interpreted to have condensed in the outflows of low-mass (∼1.5–3 M☉), carbon-rich AGB stars with close-to-solar metallicity (Hoppe et al. 1994; Zinner et al. 2006). The KJB fraction also shows C-, N-, and Si-isotopic signatures consistent with an AGB origin for most of the grains (Amari et al. 2000).

Figure 2. Silicon-, C-, and N-isotopic ratios of stardust SiC grains from the LS+LU fraction (white squares, from Virag et al. 1992) analyzed in the present study. Data for mainstream SiC grains from previous analyses (Hynes & Gyngard 2009) are shown for comparison (gray squares). Data for the SiC-enriched bulk sample (KJB fraction, black square) from Amari et al. (2000) are also plotted. Error bars from previous measurements are omitted for clarity. Black dashed lines indicate the solar ratios (Lodders 2010) as inferred from terrestrial composition. (a) Si-isotopic ratios expressed as deviations (δ-values) from the reference terrestrial (= solar) isotopic composition in parts per thousand (‰). Error bars are smaller than the symbols. Also shown is the so-called mainstream correlation line indicated by the solid line, with slope of 1.35 (Zinner et al. 2006). (b) 14N/15N ratios plotted against 12C/13C ratios. Error bars are smaller than the symbols.
Download figure:
Standard image High-resolution imageTable 1. C-, N- and Si-isotopic Compositions of Stardust SiC Grains from the KJB and LS+LU Fractions Measured for W and Hf Isotopes
| Grain/Spot | Size | 12C/13C ± 1σ | 14N/15N ± 1σ | δ29Si/28Sia ± 1σ | δ30Si/28Sia ± 1σ |
|---|---|---|---|---|---|
| (μm) | (‰) | (‰) | |||
| KJB fraction (Murchison SiC-enriched sample) | |||||
| KJB | 0.49 | 37.0 ± 0.4 | 521 ± 60 | 24.6 ± 1.3 | 37.8 ± 3.4 |
| LS+LU fraction (Murchison single grains) | |||||
| LU-34 | 7 × 9 | 54.3 ± 0.4 | 1889 ± 13 | 86.4 ± 3.0 | 73.2 ± 3.4 |
| LU-36 | 23 × 23 | 49.1 ± 0.4 | 408 ± 20 | 37.9 ± 2.5 | 41.1 ± 3.1 |
| LU-32 | 5 × 13 | 63.0 ± 0.4 | 1088 ± 14 | 55.3 ± 2.5 | 47.8 ± 3.2 |
| LU-20 | 15 × 26 | 48.6 ± 0.4 | 935 ± 22 | 38.6 ± 2.6 | 45.0 ± 3.5 |
| LU-41 | 13 × 13 | 48.4 ± 0.3 | 678 ± 15 | 43.3 ± 3.4 | 44.3 ± 2.9 |
Notes. Isotopic ratios are reproduced from Amari et al. (2000) and Virag et al. (1992). Errors are 1σ. aδiSi/28Si (‰) = [(iSi/28Si)measured/(iSi/28Si)solar − 1] × 103.
Download table as: ASCIITypeset image
2. TUNGSTEN ISOTOPIC MEASUREMENTS
While 182W and 183W are free of interferences, the remaining W isotopes have atomic isobaric interferences: 180W from 180Ta+ (0.012% of solar Ta) and 180Hf+ (35.1% of solar Hf), 184W from 184Os+ (0.02% of solar Os), and 186W from 186Os+ (1.59% of solar Os). Monoxide interferences are also present (e.g., 170Er16O+ and 170Yb16O+ on 186W+), requiring a mass resolution of m/Δm ∼ 8000 for separation. Detailed scans in the mass region of W+ and WO+ isotopic species, sputtered from NIST-610 silicate glass and an SiC ceramic doped with heavy elements, have shown that WO+ species are produced at a higher intensity than W+ species during sputtering by a 10 keV O2− primary ion beam (WO+/W+ ∼ 3). Furthermore, as previously described by Kinny et al. (1991), under the same analytical conditions YbO+/Yb+ ∼ 0.5, and REEO+2/REEO+ is negligible (<0.001). Analyzing WO+ instead of W+ therefore produces higher yields and minimizes interferences from REE+, REEO+, and REEO2+ species. For these reasons we analyzed W isotopes as WO+.
Tungsten isotopic measurements in stardust SiC grains were carried out with a Sensitive High Resolution Ion Microprobe-Reverse Geometry (SHRIMP-RG) at the Australian National University. We performed both "bulk analyses" on an aggregate of many grains from the KJB fraction and "single-grain analyses" on grains from the LS+LU fraction. Nine individual spots on the KJB fraction were analyzed for W isotopes. Five out of nine investigated single grains from the LS+LU fraction had sufficiently high W concentrations for isotopic analysis. SHRIMP-RG measurements were performed with an O−2 primary beam of ∼5 nA focused to sputter an area of ∼30 μm in diameter. Before data acquisition, each spot/grain was initially rastered across an area slightly larger than the analytical pit by the beam for ∼60 s to minimize surface contamination. Secondary ions were extracted at 10 kV and measured by single collector analysis on an ETPTM multiplier in peak-jumping mode.
We used two different setups. In the first setup (KJB spots 01–08), we measured 180Hf16O+, 182W16O+, 183W16O+, 184W16O+, 186W16O+, 188Os16O+, and 189Os16O+. We monitored OsO+ in order to estimate a potential interference on the 186W16O+ peak. However, no contribution was found in the mass regions of 188Os16O+ and 189Os16O+. In the second setup (KJB spot 09, and all individual grains), we measured 179Hf16O+, 180Hf16O+, 182W16O+, 183W16O+, 184W16O+, 186W16O+, 188Os16O+, and 189Os16O+. Contributions from 180W16O+ on the 180Hf16O+ peak, 180Hf18O+ on the 182W16O+ peak, and 182W18O+ on the 184W16O+ peak were found to be negligible, so no correction was applied. In addition, we carefully checked the mass region of interest for molecular interferences (Figure 3) resulting from complex combinations of major elements from the SiC matrix. Low count rates (e.g., ∼0.4 counts s−1 at mass 198) were found in the mass region of interest when sputtering a "pure" synthetic SiC. Count rates at mass 198 sputtered from the KJB fraction are usually on the order of 20 counts s−1. Individual grains, on the other hand, had count rates between 1.5 and 8 counts s−1. The use of a small energy offset (∼21–24 eV) has proved to be quite successful in suppressing complex molecular interferences without significantly compromising the intensity of the atomic species (Ávila et al. 2011). In this study, we confirmed this observation for the mass region of interest using a "pure" synthetic SiC reference material. As a result, W (and also Hf) measurements in all individual SiC grains and 5 out of 11 KJB spots (no. 07–11) were carried out on the SHRIMP-RG by combining high-mass resolution with energy filtering. Six KJB spots (no. 01–06) were analyzed without energy filtering. We found that all KJB spots have the same W isotopic composition within 2σ errors. KJB spots 10 and 11 were analyzed only for 179Hf/180Hf ratios.

Figure 3. SHRIMP-RG mass scans of 182W16O+ (a), 183W16O+ (b), 184W16O+ (c), and 186W16O+ (d), obtained in NIST-610 silicate glass, a "pure" synthetic SiC, and a SiC ceramic doped with heavy elements. Energy offset = 0 eV and m/Δm ∼ 7000 (at 10% peak).
Download figure:
Standard image High-resolution imageThe acquisition time for each analysis was ∼6–7 minutes. Because of the low W abundance in stardust SiC grains, the mass positions of WO+ isotopic species could not be monitored during each individual analysis. Their mass positions were instead maintained from the previous measurement on the standard. We systematically bracketed three unknowns by a suite of standard reference materials (i.e., NIST-610 silicate glass and SiC ceramic). The shifts in peak positions monitored during the analytical sessions were found to be less than 0.002 amu between consecutive standards. The secondary beam was aligned using the QQH monitor, allowing maximum transmission through the source slit. SHRIMP-RG was operated at a mass resolution of m/Δm = 7000 (at 10% peak). The NIST-610 silicate glass and the SiC ceramic doped with heavy elements were used to monitor instrumental mass fractionation (IMF). The data were corrected for an IMF of −12‰ amu−1 based on the 186W/183W ratio of 1.986 (Jacobsen 2005), and the mean of the 186W/183W measurements of the SiC standards. Mass interferences and background were monitored by periodically analyzing a "pure" synthetic SiC and the Au foil (i.e., the substrate on which the grains were deposited). The 180Hf/184W ratios were normalized by applying the relative sensitivity factor determined by measuring the SiC ceramic doped with heavy elements.
The isotopic ratios obtained with SHRIMP-RG in single-collection mode were calculated using Dodson's time-interpolation algorithm (Dodson 1978), wherein the final isotopic ratios are calculated as means of N − 1 interpolated ratios (where N is the number of scans). To investigate the hypothesis that the isotopic measurements calculated using this approach could be affected by a systematic positive bias, we also calculated the isotopic ratios from the total counts as suggested by Huss et al. (2011) and Ogliore et al. (2011). We found slight differences (< 5%) in the final ratios, but all are well within the errors. The uncertainties of the W and Hf isotopic ratios measured on stardust SiC grains are dominated by counting statistics and were calculated from the standard deviation of the sampling distribution (i.e., standard error = S.D./ ). Uncertainties related to the dispersion (i.e., standard deviation) of measurements on the standards during the analytical session were calculated from repeated analysis of NIST-610 and SiC ceramic, and propagated into the uncertainty of each unknown.
3. RESULTS
Tungsten and hafnium isotopic compositions are reported in Table 2. The quoted errors are ±1σ. The reference W isotopic composition is taken from Jacobsen (2005). This composition is taken as a terrestrial composition that should also reflect the solar system composition (e.g., Lodders 2010), which is the case for most refractory elements. Isotope compositions are either reported directly or as delta (δ) values, defined as δR = [(Rmeasured/Rsolar − 1) × 1000], where the measured isotopic ratios (Rmeasured) are expressed as deviations from the reference terrestrial (= solar) isotopic composition (Rsolar) in parts per thousand (‰). Other interelement isotopic ratios are taken from Lodders (2010).
Table 2. Tungsten and Hafnium Isotopic Ratios Determined in Stardust SiC Grains
| Spot/Grain | 182W/184W ± 1σ | δ182W/184Wb ± 1σ | 183W/184W ± 1σ | δ183W/184Wb ± 1σ | 186W/184W ± 1σ | δ186W/184Wb ± 1σ | 179Hf/180Hf ± 1σ | δ179Hf/180Hfc ± 1σ | 180Hf/184Wd ± 1σ |
|---|---|---|---|---|---|---|---|---|---|
| (‰) | (‰) | (‰) | (‰) | ||||||
| Terrestriala | 0.865 | 0.467 | 0.928 | 0.388 | 1.302 | ||||
| KJB fraction (Murchison SiC-enriched sample) | |||||||||
| KJB-01 | 0.725 ± 0.054 | −162 ± 63 | 0.395 ± 0.027 | −154 ± 57 | 0.755 ± 0.077 | −186 ± 83 | n.a. | n.a. | |
| KJB-02 | 0.824 ± 0.044 | −48 ± 51 | 0.434 ± 0.050 | −70 ± 108 | 0.858 ± 0.052 | −76 ± 56 | n.a. | 0.095 ± 0.013 | |
| KJB-03 | 0.817 ± 0.024 | −56 ± 28 | 0.399 ± 0.015 | −147 ± 31 | 0.985 ± 0.029 | 62 ± 31 | n.a. | 0.046 ± 0.002 | |
| KJB-04 | 0.752 ± 0.045 | −130 ± 52 | 0.395 ± 0.029 | −154 ± 62 | 0.904 ± 0.056 | −25 ± 60 | n.a. | 0.041 ± 0.004 | |
| KJB-05 | 0.825 ± 0.043 | −46 ± 50 | 0.394 ± 0.026 | −157 ± 57 | 0.954 ± 0.054 | 28 ± 58 | n.a. | 0.097 ± 0.015 | |
| KJB-06 | 0.838 ± 0.056 | −31 ± 64 | 0.461 ± 0.037 | −12 ± 78 | 0.963 ± 0.044 | 39 ± 47 | n.a. | 0.059 ± 0.009 | |
| KJB-07 | 0.845 ± 0.055 | −23 ± 63 | 0.454 ± 0.036 | −28 ± 76 | 0.995 ± 0.065 | 72 ± 70 | n.a. | 0.057 ± 0.012 | |
| KJB-08 | 0.829 ± 0.058 | −42 ± 67 | 0.451 ± 0.038 | −35 ± 80 | 0.996 ± 0.068 | 74 ± 72 | n.a. | 0.068 ± 0.007 | |
| KJB-09 | 0.817 ± 0.056 | −55 ± 64 | 0.436 ± 0.036 | −66 ± 77 | 0.902 ± 0.064 | −28 ± 69 | 0.338 ± 0.060 | −130 ± 155 | 0.069 ± 0.007 |
| KJB-10 | n.a. | n.a. | n.a. | 0.318 ± 0.059 | −181 ± 153 | n.a. | |||
| KJB-11 | n.a. | n.a. | n.a. | 0.322 ± 0.056 | −170 ± 144 | n.a. | |||
| Weighted average | 0.809 ± 0.014 | −64 ± 17 | 0.411 ± 0.009 | −120 ± 22 | 0.944 ± 0.024 | 18 ± 26 | 0.326 ± 0.033 | −160 ± 85 | 0.050 ± 0.005 |
| LS+LU fraction (Murchison single grains) | |||||||||
| LU-34 | 0.866 ± 0.067 | 1 ± 77 | 0.485 ± 0.044 | 38 ± 95 | 0.887 ± 0.069 | −44 ± 75 | 0.475 ± 0.076 | 223 ± 195 | 0.194 ± 0.035 |
| LU-36 | 0.722 ± 0.070 | −165 ± 80 | 0.384 ± 0.061 | −177 ± 130 | 0.802 ± 0.091 | −136 ± 98 | b.d.l. | 0.070 ± 0.009 | |
| LU-32 | 0.848 ± 0.072 | −20 ± 83 | 0.463 ± 0.048 | −8 ± 102 | 0.870 ± 0.076 | −62 ± 81 | 0.437 ± 0.078 | 126 ± 200 | 0.203 ± 0.016 |
| LU-20 | 0.802 ± 0.071 | −73 ± 83 | 0.439 ± 0.042 | −61 ± 89 | 0.769 ± 0.070 | −171 ± 76 | b.d.l. | 0.111 ± 0.030 | |
| LU-41 | 0.648 ± 0.056 | −250 ± 65 | 0.304 ± 0.034 | −349 ± 73 | 0.639 ± 0.058 | −312 ± 63 | 0.141 ± 0.047 | −637 ± 121 | 0.276 ± 0.047 |
Notes. Errors are 1σ. n.a. = not analyzed; b.d.l. = below detection limit. a182W/184W, 183W/184W, and 186W/184W from Jacobsen (2005). 179Hf/180Hf and 180Hf/184W from Lodders (2010). bδiW/184W (‰) = [(iW/184W)measured/(iW/184W)solar −1] × 103. cδ179Hf/180Hf (‰) = [(179Hf/180Hf)measured/(179Hf/180Hf)solar − 1] × 103. dCorrected with relative sensitivity factor determined on the SiC ceramic.
Download table as: ASCIITypeset image
The weighted mean W isotopic ratios obtained for the SiC-enriched bulk sample (KJB fraction), based on nine measurements (Table 2 and Figure 4), are 182W/184W = 0.809 ± 0.014 (δ182W/184W = −64‰ ± 17‰), 183W/184W = 0.411 ± 0.009 (δ183W/184W = −120‰ ± 22‰), and 186W/184W = 0.944 ± 0.024 (δ186W/184W = 18‰ ± 26‰). The KJB fraction shows a small deviation from solar composition in both 182W/184W and 183W/184W ratios, with deficits in 182W and 183W with respect to 184W. The 186W/184W ratio, however, shows no apparent deviation from the solar value, which raises the possibility of contamination with solar material. Although contamination is possible, we believe that it is unlikely since the other ratios (e.g., 182W/184W and 183W/184W) are statistically anomalous.

Figure 4. Tungsten isotopic compositions determined for the SiC-enriched sample (KJB fraction). Each bar represents an individual measurement. Bold and dashed lines indicate solar ratios (as inferred from terrestrial composition; Jacobsen 2005) and SiC weighted mean ratios, respectively. Box heights are 2σ. Weighted means are also reported as deviations (δ-values) from the reference terrestrial (= solar) isotopic composition in parts per thousand (‰). MSWD is the mean square weighted deviation.
Download figure:
Standard image High-resolution imageWithin the ±1σ uncertainties, the W isotopic ratios determined for two out of five single grains (LU-34 and LU-32) show no deviation from solar composition. On the other hand, two other grains (LU-36 and LU-41) exhibit deficits in 182W, 183W, and 186W with respect to 184W. Grain LU-20 shows a deviation from the solar value only in the 186W/184W ratio, with both 182W/184W and 183W/184W ratios showing no apparent deviation from solar within errors. Only grain LU-41 has deviations from the solar isotopic ratios that are larger than 2σ. No obvious correlations between W isotopic compositions and C-, N-, and Si-isotopic compositions were found.
Additionally, we provide information on the 179Hf/180Hf ratios (Table 2). The weighted mean 179Hf/180Hf of the SiC-enriched bulk sample (KJB fraction), based on three measurements, is 0.326 ± 0.033 (δ179Hf/180Hf = −160‰ ± 85‰). This value deviates only slightly from that reported for the solar system (179Hf/180Hf = 0.388; Lodders 2010). Three out of five investigated single grains had sufficiently high Hf concentrations for isotopic analysis. Two of them show no apparent deviation from the solar value (within 1σ error). Grain LU-41, which has the largest deficit in 182W, 183W, and 186W with respect to 184W, also has a significant deficit in 179Hf with respect to 180Hf (δ179Hf/180Hf = −637‰ ± 121‰). All single grains and KJB spot analyses show lower 180Hf/184W ratios than current predictions from s-process nucleosynthesis calculations (see Section 4).
We shall now consider some factors that may affect the present determinations. First, there is a potential problem of contamination with foreign materials and minerals, originating either from the meteorite itself or as a result of sample preparation. Tungsten, unfortunately, may be a contaminant from the sample preparation. Sodium polytungstate was used for density separation of graphite from SiC (Amari et al. 1994). The density separation was followed by several washing procedures in order to remove any contaminants. Based on the behavior of the isotopic ratios as a function of acquisition time, there is no evidence from our analyses to suggest that the W isotopic compositions are not intrinsic to the grains or result from surface contamination. Furthermore, we did not detect W in the Au-foil, onto which both the KJB and LS+LU fractions had been deposited. Nonetheless, three out of five single grains show no apparent deviation from the solar isotopic ratios (for both W and Hf), and contamination with solar material cannot be completely ruled out. Kashiv (2004) found very high W abundance in stardust SiC grains (W enrichment factor, relative to solar W/Si ratio, of ∼300–8700), much higher than expected based on AGB stellar models and thermodynamic condensation calculations. In contrast to Kashiv (2004), our W concentration measurements are semi-quantitative only. Nevertheless, we found for the KJB fraction a W enrichment factor ∼10, and for the single grains from the LS+LU fraction an enrichment factor < 3, which are much lower than the values found by Kashiv (2004). This author also suggested that W contamination could be from heavy metal alloy holders used during analytical procedures. Contamination from the Murchison meteorite is another possibility. In order to minimize any residual surface contamination, all spots and grains analyzed were initially rastered across an area slightly larger than the analytical pit by the O−2 primary beam for ∼60 s before data acquisition.
Another complication encountered during ion microprobe analysis of SiC grains is the lack of suitable SiC standards. The accuracy and precision of ion microprobe measurements is known to be highly dependent on the availability of suitable standards because of the variability of ion emission produced by sputtering of solid geological and cosmochemical materials. Standards that are compositionally and structurally similar to the analytical target, i.e., matrix-matched, are therefore highly desirable. Furthermore, assessment of molecular interferences produced by combinations of isotopes of the major elements is particularly important for the analysis of trace elements where even weak molecular interferences may significantly contribute to the mass peak being measured. Naturally occurring (except for stardust SiC grains) and synthetic SiC samples contain very low abundances of trace elements and are therefore not suitable as standard materials. While the synthesis of large doped SiC crystals in the laboratory is extremely difficult, SiC-based ceramics sintered with desirable amounts of trace elements are relatively easy to produce. In order to determine elemental yields and identify possible molecular interferences in the mass region of W isotopes, we prepared a SiC ceramic doped with several trace elements at nominal concentrations between 1 and 3000 ppm. The SiC ceramic has proved to be a useful standard for elemental and isotopic measurements in stardust SiC grains, especially concerning identification of molecular interferences.
4. W AND Hf CONDENSATION INTO SiC GRAINS FROM AGB STARS
The 180Hf/184W ratios obtained here for stardust SiC grains (0.041–0.276) are lower than s-process model predictions for the envelope compositions of carbon-rich, low-mass AGB stars with close-to-solar metallicity (∼1.429; solar system ∼1.30; Lodders 2010). Clearly, it is not possible to attribute the observed range to nucleosynthetic effects or to contamination with solar material. Hence, we turn to discussing the condensation behavior of W and Hf to see if this could provide an explanation. According to Lodders & Fegley (1995), under the same conditions of pressure and C/O ratio, W condenses as WC at a temperature ∼100 K higher than HfC. Both WC and HfC are more refractory than SiC. Thus, one would expect both elements to fully condense into SiC, or at least in the same proportion. Based on our data, this appears not to be the case. One way to explain small fractionations between Hf and W is by having W condense as a metal instead of WC. This can occur if condensation takes place at pressures higher than 10−4 bars and if W in the circumstellar envelope reaches a concentration of at least 10 times the abundance found in the solar system (Lodders & Fegley 1995). We note that the W enrichment factor determined for the KJB fraction is ∼10, which is comparable to the results obtained for other heavy s-process elements. However, the single SiC grains from the LS+LU fraction show an enrichment factor < 3. Large fractionation between elements present in SiC relative to the source composition had been previously observed (e.g., Al/Mg, Sr/Ba: Amari et al. 1995; Ni/Fe: Marhas et al. 2008), but there is still no satisfactory explanation for these elemental fractionations.
5. THE s-PROCESS PATH IN THE W MASS REGION
The s-process path in the mass region around W is shown in Figure 1. The s-process takes place in the deep He-rich layers of low- and intermediate-mass stars (M ∼ 0.8–8 M☉) during their AGB phase of evolution (e.g., Gallino et al. 1998; Busso et al. 1999; Herwig 2005; Zinner et al. 2006; Cristallo et al. 2009). In low-mass AGB stars of close-to-solar metallicity, believed to be the site of origin of mainstream SiC grains, the 13C(α,n)16O reaction is the main neutron source responsible for the production of the bulk of the s-process AGB yields. It usually operates under radiative conditions at relatively low temperatures (T ∼ 0.9 × 10⁸ K, corresponding to a thermal energy of kT ∼ 8 keV), during the interval between episodic He burning (thermal pulses), and results in low neutron densities (106–107 neutrons cm−3; Straniero et al. 1995). A second neutron source, the 22Ne(α,n)25Mg reaction, is marginally activated during thermal pulses when the maximum temperature at the bottom of the He-burning shell reaches T ∼ 3 × 10⁸ K (kT ∼ 23 keV), resulting in high neutron densities (up to ∼1010 neutrons cm−3 in AGB stars of initial mass 1.5–3 M☉). Although neutron captures during these short episodes account only for a few percent of the total exposure, they are essential for adjusting the abundance patterns of the s-process branchings.
The production of W in the He-intershell during interpulse and thermal pulse phases is strongly affected by branchings at 181Hf, 182Hf, 182Ta, 183Ta, and 185W (see Figure 1). The competition between neutron capture and β-decay at these branching points can be expressed by a branching factor (fn), calculated from fn = λn/(λn + λβ), where λn = Nn νT 〈σ〉 and λβ = ln2/t1/2 are the neutron-capture rate and the β-decay rate, respectively. Here, Nn, νT, 〈σ〉, and t1/2 are the neutron density, the thermal velocity, the Maxwellian-averaged (n,γ) cross section, and the half-life, respectively. At the typical conditions of operation of the 13C(α,n)16O neutron source (T ∼ 0.9 × 10⁸ K, Nn ∼ 106 to 107 neutrons cm−3), the 181Hf, 182Ta, and 183Ta branching factors are very small (<0.2%, 1.5%, and <0.1%, respectively, see Figure 5(a)), indicating that 181Hf, 182Ta, and 183Ta will β-decay to 181Ta, 182W, and 183W, respectively, rather than capture a neutron. Hence, the s-process flow will create 182W, 183W, and 184W via 181Hf(β,ν) 181Ta(n,γ) 182Ta(β,ν) 182W(n,γ) 183W(n,γ) 184W. The branching point at 185W also shows a small probability (∼1%) toward 186W (Figure 5(a)), so that no 186W will be produced during the activation of the 13C neutron source.
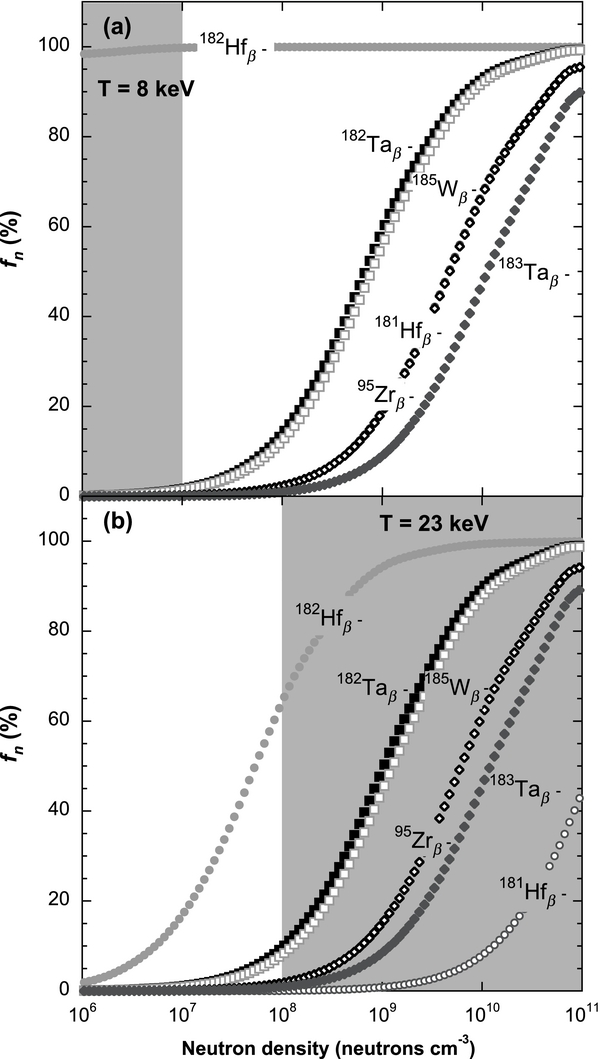
Figure 5. Branching factor (fn) of 181Hf, 182Hf, 182Ta, 183Ta, 185W, and 95Zr at kT = 8 keV (a) and 23 keV (b) as a function of neutron density. We used the β-decay rates reported by Takahashi & Yokoi (1987) and the latest accepted neutron-capture rates from the KADoNiS Database (http://www.kadonis.org/; Dillmann et al. 2006), except for the 183Ta, where the neutron-capture rate from JINA REACLIB database (http://groups.nscl.msu.edu/jina/reaclib/db/; Cyburt et al. 2010) was used. All values were calculated for an electron density of 5 × 1026 cm−3. The branching factor (%) depends on the neutron-capture and β− decay rates and indicates the probability that an unstable isotope will capture a neutron rather than decay. The gray area in panels (a) and (b) corresponds to the conditions typically found during interpulse and thermal pulse phases, respectively, in low-mass AGB stars.
Download figure:
Standard image High-resolution imageAt higher temperatures and neutron density conditions typically found during the AGB thermal pulses (T up to 3 × 10⁸ K, Nn up to ∼1010 neutrons cm−3), the s-process production of 182W, 183W, and 186W is different. Under these conditions, the branching factor at 181Hf is ∼10% at Nn = 1010 neutrons cm−3 (Figure 5(b)), marginally feeding 182Hf. The laboratory half-life of 182Hf is 8.9 × 10⁶ yr (Vockenhuber et al. 2004), but at T ∼ 8 keV and 23 keV (and electron density ∼5 × 1026 cm−3) it drops to ∼41 × 103 yr and 12 yr, respectively, as a result of increased thermal populations of low-lying nuclear states (Takahashi & Yokoi 1987). Despite the enhancement observed in the 182Hf β-decay rate at stellar conditions, its half-life is still sufficiently long to allow neutron captures to occur. Therefore, 182Hf captures a neutron rather than decay during both interpulse and thermal pulse phases. Provided that the 181Hf branching point is open, the s-process flow will proceed via the sequence 181Hf(n,γ) 182Hf(n,γ) 183Hf(β,ν) 183Ta(β,ν) 183W, consequently bypassing 182W, as well as 183W if the branching point at 183Ta is also activated (see below). After the neutron flow ceases, 182W is marginally produced by the decay of 182Hf. Low-mass AGB stars yield 182Hf/180Hf ratios of ∼1.79 × 10⁻², which means that the effect of the 181Hf branching point is marginal. Only a very small shift of ∼1%–3% in the 182W/184W ratio due to 182Hf decay is expected if both Hf and W fully condense into SiC. This shift is likely undetectable given the low 180Hf/184W ratios determined here, which imply a very low s-process abundance of 182Hf in the studied SiC grains. Hence, the observable radiogenic contribution of 182Hf to its daughter 182W in the grains would be much less than 1% and thus too difficult to observe.
The s-process flow that goes through 181Hf(β,ν) 181Ta(n,γ) 182Ta encounters two other branching points at 182Ta and 183Ta. The 182Ta branching point has a temperature-dependent β-decay rate and a branching factor > 80% (Figure 5(b)) during the high neutron density produced by the 22Ne source, and may cause the s-process flow to partially bypass 182W. The branching factor at 183Ta is ∼50% at T ∼ 3 × 10⁸ K and Nn = 1010 neutrons cm−3 (Figure 5(b)), causing the s-process flow to partially bypass 183W. The branching factor at 185W is enhanced similarly to the 182Ta branching factor during thermal pulses (Figure 5(b)), feeding 186W, which results in a smaller s-process contribution to both 186Os and 187Os, due to the presence of the long-living nucleus 187Re. The 186W/184W ratios reported here suggest activation of the branching point at 185W. This result is, in principle, in disagreement with 96Zr depletions observed in SiC grains that indicate that the 22Ne neutron source was weak in the parent stars of the grains (Nicolussi et al. 1997; Lugaro et al. 2003). However, at conditions of T ∼ 23 keV and Nn > 5 ×10⁸ neutrons cm−3, the branching point at 95Zr shows a smaller branching factor than 185W (Figure 5(b)). Therefore, at the same conditions, the 185W(n,γ)186W reaction shows a higher probability to occur than the 95Zr(n,γ)96Zr reaction. Information about the Zr isotopic compositions in the same grains measured for W would help to better constrain the physical conditions of the s-process in the parent stars of the grains.
From Figure 1, it can be seen that there is only one path that leads from 179Hf to 180Hf,10 whose relative abundances are not affected by any branching point. If a steady flow is achieved along the s-process path, the local equilibrium approximation applies 〈σ〉(A) Ns(A) ∼ 〈σ〉(A−1) Ns(A−1), where 〈σ〉(A) is the Maxwellian averaged (n,γ) cross section of the isotope A, and Ns is its s-process abundance (Clayton 1983). From this simple formulation, we can infer that the ratio of the s-process contributions to 179Hf and 180Hf are approximately equal to the inverse ratios of their neutron-capture cross sections. At thermal energies of ∼8 and 23 keV, the inverse ratio of the 179Hf/180Hf neutron-capture cross sections yields 〈σ〉(180Hf)/〈σ〉(179Hf) = 0.150 and 0.175, respectively, with an uncertainty of ∼1.5% (Dillmann et al. 2006). The grain showing the most anomalous W and Hf isotopic ratios, LU-41, has 179Hf/180Hf = 0.141 ± 0.047, in very good agreement with the ratio expected from the values of neutron-capture cross sections, thus indicating an almost pure s-process signature in this grain.
6. DISCUSSION
Figures 6 and 7 show the W and Hf isotopic ratios of the stardust SiC grains together with s-process model predictions for the envelope compositions of low-mass AGB stars. These predictions represent the mixing between two components, one close to the solar composition, representing the initial composition of the stellar envelope (in stardust studies this is traditionally referred to as the N-component), the other with isotopic characteristics close to those predicted for pure s-process (the G-component; e.g., Zinner et al. 1991; Nicolussi et al. 1997; Savina et al. 2004). The magnitude of the departure from the N-component toward the G-component depends on the efficiency and the number of mixing episodes, also known as third dredge-ups (TDUs), which occur when the convective envelope penetrates into the He intershell zone. The TDU causes newly synthesized 12C and s-processed material to be mixed into the convective envelope of the star (e.g., Lugaro et al. 2003).
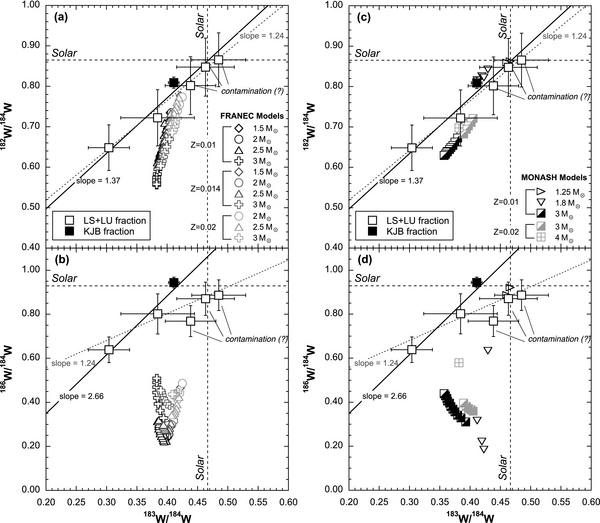
Figure 6. (a) and (c) 182W/184W plotted against 183W/184W and (b) and (d) 186W/184W plotted against 183W/184W for the SiC-enriched sample (KJB fraction) and single SiC grains (LS+LU fraction). Error bars are 1σ. The gray dashed lines in each plot give the best linear fit through all single SiC grains and the SiC-enriched sample. The black solid lines shown in each plot give the best linear fit through grains LU-36 and LU-41, and the SiC-enriched sample; grains LU-34, LU-32, and LU-20 were not included in the fit because their W isotopic signature may be affected by contamination with solar material. Black dashed lines indicate the solar ratios (as inferred from terrestrial composition; Jacobsen 2005). SiC data are compared with s-process model predictions (FRANEC and MONASH models) for the envelope compositions of low-mass AGB stars of different masses and metallicities (see the text for details). Predictions are only plotted when the C/O in the stellar envelope reaches values higher than 1.
Download figure:
Standard image High-resolution image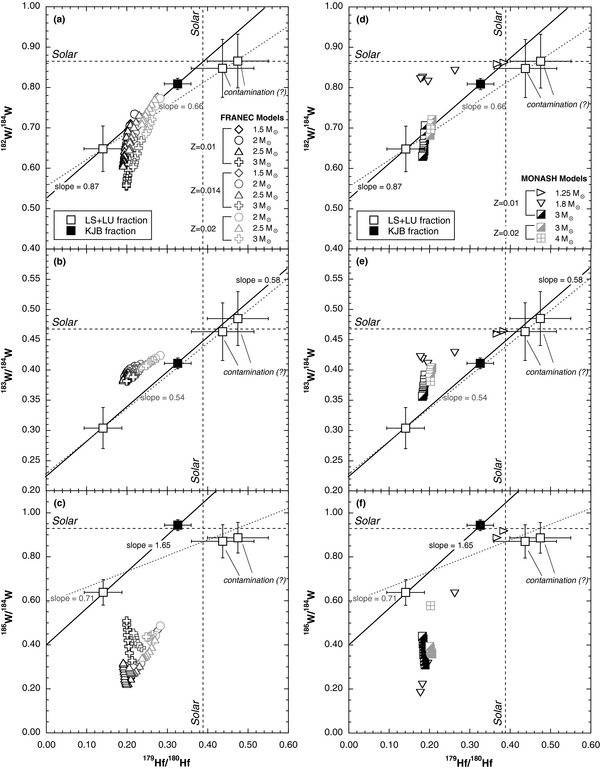
Figure 7. (a) and (d) 182W/184W vs. 179Hf/180Hf, and (b) and (e) 183W/184W vs. 179Hf/180Hf, and (c) and (f) 186W/184W vs. 179Hf/180Hf for the SiC-enriched sample (KJB fraction) and single SiC grains (LS+LU fraction). Error bars are 1σ. The gray dashed lines in each plot give the best linear fit through all single SiC grains and the SiC-enriched sample. The black solid lines shown in each plot give the best linear fit through grain LU-41 and the SiC-enriched sample; grains LU-34 and LU-32 were not included in the fit because their W isotopic signature may be affected by contamination with solar material. Black dashed lines indicate the solar ratios (as inferred from terrestrial composition; Jacobsen 2005; Lodders 2010). SiC data are compared with s-process model predictions (FRANEC and MONASH models) for the envelope compositions of low-mass AGB stars of different masses and metallicities (see the text for details). Predictions are only shown when the C/O in the stellar envelope reaches values higher than 1.
Download figure:
Standard image High-resolution imageTwo different sets of models (FRANEC, Cristallo et al. 2009, 2011; MONASH, Karakas 2010, Karakas et al. 2010) with a range of stellar masses (1.25–4 M☉) and metallicities (Z = 0.01, 0.014, and 0.02) were investigated. Of relevance here, in the FRANEC code the neutron-capture cross sections for the W isotopes are taken from Bao et al. (2000), and correspond to the values published by Macklin et al. (1983) for 182W, 183W, 184W, and 186W, and the theoretical value adopted by Bao et al. (2000) for 185W. In the MONASH code, the neutron-capture cross sections for the W isotopes are taken from the KADoNiS Database (Dillmann et al. 2006), and correspond to the values published by Macklin et al. (1983) for 182W and 183W, Marganiec et al. (2009) for 184W and 186W, and Mohr et al. (2004) for 185W. The models presented here have been selected for C/O > 1 in the envelope so that the condition for the formation of SiC is satisfied.
In spite of all the differences between the two evolutionary codes, which employ a variety of input physics also concerning mixing and reaction rates (see Cristallo et al. 2009, 2011; Karakas 2010; Karakas et al. 2010 for details), the isotopic compositions predicted by the two sets of models are in fair agreement with one another. Both sets of models present a good match with the SiC data for the 182W/184W, 183W/184W, and 179Hf/180Hf ratios (Figures 6(a), (c) and 7(a), (b), (d), (e)). As already demonstrated by Lugaro et al. (2003) in relation to Sr, Zr, and Ba isotopic ratios, the marginal activation of the 22Ne neutron source in the thermal pulses is necessary to best reproduce some of the single SiC data. In the case of 182W/184W and 183W/184W ratios, the 22Ne neutron source allows the activation of the 182Ta and 183Ta branching points, lowering the 182W/184W and 183W/184W ratios. This is clearly illustrated by comparison in Figures 7(d) and 7(e) of the 1.8 M☉ model, where the 22Ne neutron source is not activated, as the temperature in the thermal pulses is always below 2.66 × 10⁸ K, with the higher mass models. The SiC grains that are isotopically solar within errors could be explained either as contamination with solar material, or as originating in a very low mass star (the 1.25 M☉ model) where TDU episodes can only slightly modify the envelope's pristine composition. The KJB average measurement can be explained as the average of different stellar masses. Also, the 183W/184W ratio observed in the most extreme grain, LU-41, is slightly lower than the lowest predicted value (but note that the error bars are 1σ).
On the other hand, most models predict lower 186W/184W ratios than those measured in the grains (Figures 6(b), (d) and 7(c), (f)). The model predictions move toward higher 186W/184W ratios with increasing number of thermal pulses, particularly for models of higher masses and lower metallicities, as the 22Ne neutron source and thus the 185W branching point are more activated in these models. However, they fail to reach the observed values. While some ad hoc solutions may be found for the single grain data (e.g., the 4 M☉ model reaches the 186W/184W ratio measured in grain LU-41 and almost also the value observed in grain LU-36, when considering that the error bars are 1σ), the KJB ratio is particularly puzzling; it agrees with the solar value within a relatively small error while it should represent the average of different stellar sources with different masses and metallicities, or, in case of contamination, should sit on the mixing line connecting the models and the solar composition point.
A question that needs to be addressed is whether or not a revision of the neutron-capture cross sections would improve the match between model predictions and the SiC data. For 182W and 183W, the uncertainties in the recommended neutron-capture cross sections are very small (∼3%), but the measurements are quite old (Macklin et al. 1983) and no revision has been obtained since. The possibility that the 182W neutron-capture cross section had been overestimated by 20%–30% in the past was recently suggested by Wisshak et al. (2006) and Vockenhuber et al. (2007) based on the observation that the 182W r-residual shows a significant positive deviation from the otherwise very smooth r-process solar abundance pattern (see Figure 12 of Wisshak et al. 2006; or Figure 6 of Vockenhuber et al. 2007). Also, a smaller 182Ta neutron-capture cross section, which is based on theoretical calculations with a relatively large uncertainty (∼ 16%), could lead to a lower 182Ta branching factor, resulting in a higher s-process contribution to 182W and a lower 182W r-residual (see Table 13 of Vockenhuber et al. 2007). However, any major changes resulting in a higher 182W s-process production would lead to higher 182W/184W ratios and a mismatch with the SiC data reported here. For example, a 30% reduction of the 182W cross section in the MONASH 3 M☉ and Z = 0.01, and 3 M☉ and Z = 0.02 models results in a ∼35% increase in the final 182W/184W ratio in the stellar envelope, which is well above the values observed in the SiC grains. On the other hand, our data suggest that a small adjustment (toward lower values) in the s-process production of 183W is needed in order to obtain a better agreement between our SiC data and the s-process model predictions. This may be achieved by adopting a higher (∼ 30%) 183W neutron-capture cross section.
As for the unstable 185W, its neutron-capture cross section has been recently derived from the inverse 186W(γ,n)185W photodisintegration reaction (Sonnabend et al. 2003; Mohr et al. 2004) with an uncertainty between 10% and 15% and a difference between the two measurements of 24% at 30 keV. These values lead to an overproduction of the solar s-only 186Os of at least 20% (Sonnabend et al. 2003). Several hypotheses have been raised to resolve this puzzle. Sonnabend et al. (2003) suggested that the stellar model apparently overestimates the β-decay part and/or underestimates the neutron-capture part of the 185W branching point. Meyer & Wang (2007), on the other hand, proposed that this problem could be resolved either by increasing the 186Os neutron-capture cross section by ∼20% or by increasing the branching factor at 186Re. An increase in the 186Os neutron-capture cross section would also help in explaining the low 186Os/188Os s-process ratio derived from isotopic anomalies observed in primitive meteorites (Brandon et al. 2005; Yokoyama et al. 2007). However, a recent measurement of the 186Os neutron-capture cross section by Mosconi et al. (2010a) excludes this hypothesis. As noted by Reisberg et al. (2009), the mismatch between the inferred 186Os/188Os s-process ratio, derived from isotopic anomalies observed in primitive meteorites (Brandon et al. 2005; Yokoyama et al. 2007), and model predictions could be resolved by using a recent measurement of the 188Os neutron-capture cross section (Mosconi et al. 2007), which is ∼27% lower than the recommended value of Bao et al. (2000). Sonnabend et al. (2003) suggested an increase of the 185W neutron-capture cross section (by about 60%), which would lead to a decrease of 186Os and an increase of the 186W abundance. We computed AGB models using the recommended 185W neutron-capture cross section multiplied by a factor of two to see if this very large change would help in matching the 186W/184W grain data. We obtain an increase of ∼20% in the final 186W/184W ratio in the stellar envelope of the MONASH 3 M☉ and Z = 0.01, and 3 M☉ and Z = 0.02 models, but it is still lower than the observed stardust SiC data.
We also checked the impact of the uncertainties in the β-decay rates of the unstable isotopes 181Hf, 182Ta, and 185W. At a temperature of 3 × 10⁸ K, Goriely (1999) reported uncertainties of roughly a factor of three for 181Hf and 182Ta and of roughly 40% for 185W. Variations were found to be small, at most 20% in the 182W/184W ratios, mostly due to the uncertainties in the decay rate of 182Ta. Further, we checked the impact of the uncertainties in the theoretical neutron-capture cross sections of 181Hf and 182Ta by considering the theoretical estimates reported in the KADoNiS Database (Dillmann et al. 2006) on the basis of different codes used to compute the rates. These uncertainties do not lead to significant variations on the model predictions, at most 16% in the 182W/184W ratios when the neutron-capture cross section of 182Ta was varied by a factor of two.
In summary, the SiC data do not support the problem of the s-process underproduction of 182W that follows from the high solar r-process residual. However, it is important to note that the r-process residuals are calculated from s-process predictions obtained from one stellar model (or at most from the average of two different masses at the same metallicity; e.g., Arlandini et al. 1999) or from phenomenological models (e.g., Käppeler et al. 1982). A more realistic approach would be to derive them from models of the chemical evolution of the Galaxy (e.g., Travaglio et al. 1999). This is because the solar system composition is the result of nucleosynthesis from many generations of AGB stars of many different masses and metallicities. This more realistic description of the solar s-process abundances and of the r-process residuals may help solving the discrepancies found in the Hf–Ta–W–Re–Os mass region and needs to be pursued.
The SiC data qualitatively support the solution of the 186Os overproduction problem according to which the 185W branching point should be activated more strongly. However, while the 186Os problem is solved by increasing the neutron-capture cross section of 185W by ∼60% (Sonnabend et al. 2003), our models do not match the SiC data even if this cross section is increased by a factor of two. Another way to increase the 186W/184W ratio would be to decrease the production of 184W. The 186W nuclide is created during thermal pulses, when the 185W branching point is open. In contrast, 184W is created within the 13C pocket during the radiative 13C burning. Thus, the production of 184W is directly correlated with the 13C (and 14N) abundances within the pocket, which in turn depend on the mixing mechanism that allows a few protons to penetrate from the envelope during the TDU into the underlying 12C rich intershell. The current uncertainties affecting this mixing are still large, so that a clear description is still not available and the amount of 13C in the pocket may still be treated as a free parameter. In the FRANEC code, the 13C abundance within the pocket is derived from the application of an exponentially decreasing profile of convective velocities at the inner border of the convective envelope. In the MONASH code, the 13C abundance within the pocket is derived from artificial inclusion of an exponentially decreasing abundance of protons in the He intershell. The inclusion of physical mechanisms not explicitly treated in our codes, such as rotation, could modify the 13C and 14N abundances within the pocket before and during the activation of the 13C(α,n)16O reaction, thus leading to different 186W/184W ratios. For example, the calculations of Arlandini et al. (1999) used a very different 13C pocket than ours and produced 186W/184W = 0.66 (together with 183W/184W = 0.35). However, these models were targeted specifically to match the s-only solar distribution and are hence not appropriate to be compared to the composition of stardust SiC grains. In order to test the effects of a different 13C profile in our calculations, we changed in the MONASH 3 M☉, Z = 0.02 model the extent in mass of the 13C pocket from 0.002 M☉ to 0.0005 M☉. We obtained 186W/184W = 0.58, however the 183W/184W ratio is also closer to the solar value (0.43).
Note that although our SiC data allowed us to address some discrepancies found in the solar s- and r-abundance distributions in the Hf–Ta–W–Re–Os mass region, the stardust grains provide a more direct constraint on the s-process in low-mass AGB stars rather than the solar s-process component. Furthermore, the calculation of solar s- and r-abundance distributions suffers from significant uncertainties. Goriely (1999) used an extended parametric s-process model, the "multi-event s-process" model described in Goriely (1997), to analyze the impact of nuclear and observational uncertainties on the solar r-process residual distribution. The final result, presented in Figure 8 of Goriely (1999), clearly shows that the smoothness of the r-process residual curve in the Hf–Ta–W–Re–Os region is well reproduced within the uncertainties. This would still be true when considering the new measurements of the Hf neutron-capture cross sections of Wisshak et al. (2006), which result in a downward shift of the r-residual of 180Hf. There are other uncertainty factors that may also affect the solar s- and r-abundances predictions, like those arising from galactic and stellar evolution models. The combined effect of all uncertainties precludes any definite conclusion about the solar s- and r-abundance distributions to be made to the level needed for a detailed comparison with the stardust data.
7. CONCLUSIONS
We report the first W isotopic anomalies in mainstream stardust SiC grains recovered from the Murchison carbonaceous chondrite. Comparisons between grain data and s-process model predictions for the envelope compositions of low-mass AGB stars show that a single choice of stellar mass and metallicity cannot account for the range of isotopic ratios observed in the SiC grains. There is an overall match between the SiC data and the theoretical predictions for the 182W/184W and 183W/184W ratios, particularly if a 30% higher neutron-capture cross section is employed for 183W. However, the AGB models fail to reproduce the high 186W/184W ratios observed in the grains. We note, however, that many uncertainties affect stellar evolutionary computations of the s-process. Among them are the formation of the 13C pocket, the mass-loss law, the TDU, and the efficiency of the 22Ne neutron source. For example, the inclusion of rotation and magnetic fields may affect the operation of the 13C neutron source, and a lower efficiency of this neutron source may decrease the production of 184W, thus increasing the 183W/184W ratio. Also a milder mass-loss history would lead to a larger number of thermal pulses and, therefore, possibly to a larger 186W/184W ratio. Similarly, an increase of the 22Ne(α,n) cross section could lead to a higher neutron density, thus increasing the 186W production, but perhaps worsening the match with the 96Zr/94Zr ratio observed in the grains (Lugaro et al. 2003). We intend to explore these hypotheses in the future. Finally, further W isotopic measurements with better precision on additional grains would be extremely helpful. They could shed light on the possibility of contamination affecting the current W measurements and confirm the high 186W/184W ratios reported here.
J. N. Ávila was supported by a PhD scholarship (Grant 200081/2005-5) of the Brazilian National Council for Scientific and Technological Development (CNPq). She thanks the Australian National University for an ANU Vice-Chancellor's Higher Degree Research Travel Grant. M. Lugaro is an ARC Future Fellow and a Monash Research Fellow. T. R. Ireland acknowledges support by ARC grants DP0342772 and DP0666751. E. Zinner acknowledges support by NASA grant NNX08AG71G. S. Cristallo acknowledges support by the Spanish Grant AYA2008-04211-C02-02 and FPA2008-03908 from the MEC. S. Cristallo thanks Roberto Gallino for fruitful scientific discussions. We are grateful to Roy Lewis for providing the LS+LU grains. We thank an anonymous referee for their comments and Eric Feigelson for handling of this manuscript.
Footnotes
- 9
Arithmetic average composition found in the stellar envelope after the last thermal pulse with third dredge-up of the 1.5, 2, 2.5, and 3 M☉ FRANEC AGB models at
 = 0.01, 0.014, and 0.02 (FRUITY database, http://fruity.oa-teramo.inaf.it:8080/modelli.pl; Cristallo et al. 2011) and 1.25, 1.8, 3, and 4 M☉ MONASH AGB models at = 0.01 and 0.02.
 - 10
A branching point at 179Hf may be activated because this stable nucleus becomes unstable in stellar conditions. This effect is insignificant in our context, as the β-decay half-life of 179Hf is ∼30 yr at
= 3 × 10⁸ K, however, in some conditions it may lead to the production of 180Ta (actually an isomeric state, 180Tam), the least abundant nucleus in the solar system (e.g., Käppeler et al. 2004). A weak s-process branching may also be activated via neutron captures on 179Hf, feeding the 8− isomeric state in 180Hf (t1/2 = 5.5 hr), which then decays to 180Tam (Beer & Ward 1981).


