


ABSTRACT
We quantify the active galactic nucleus (AGN) contribution to the mid-infrared (mid-IR) and the total infrared (IR, 8–1000 μm) emission in a complete volume-limited sample of 53 local luminous infrared galaxies (LIRGs, LIR = 1011–1012 L☉). We decompose the Spitzer Infrared Spectrograph low-resolution 5–38 μm spectra of the LIRGs into AGN and starburst components using clumpy torus models and star-forming galaxy templates, respectively. We find that 50% (25/50) of local LIRGs have an AGN component detected with this method. There is good agreement between these AGN detections through mid-IR spectral decomposition and other AGN indicators, such as the optical spectral class, mid-IR spectral features, and X-ray properties. Taking all the AGN indicators together, the AGN detection rate in the individual nuclei of LIRGs is ∼62%. The derived AGN bolometric luminosities are in the range Lbol(AGN) = (0.4–50) × 1043 erg s−1. The AGN bolometric contribution to the IR luminosities of the galaxies is generally small, with 70% of LIRGs having Lbol[AGN]/LIR ⩽ 0.05. Only ≃ 8% of local LIRGs have a significant AGN bolometric contribution Lbol[AGN]/LIR > 0.25. From the comparison of our results with literature results of ultraluminous infrared galaxies (LIR = 1012–1013 L☉), we confirm that in the local universe the AGN bolometric contribution to the IR luminosity increases with the IR luminosity of the galaxy/system. If we add up the AGN bolometric luminosities we find that AGNs only account for  of the total IR luminosity produced by local LIRGs (with and without AGN detections). This proves that the bulk of the IR luminosity of local LIRGs is due to star formation activity. Taking the newly determined IR luminosity density of LIRGs in the local universe, we then estimate an AGN IR luminosity density of ΩAGNIR = 3 × 10⁵ L☉ Mpc−3 in LIRGs.
Export citation and abstract BibTeX RIS
1. INTRODUCTION
Luminous infrared galaxies (LIRGs) are defined as having infrared (8–1000 μm) luminosities in the range LIR = 1011–1012 L☉. Although an active galactic nucleus (AGN) may contribute, it is believed that the bulk of their IR luminosity is produced by dust heated by intense star-forming activity (Sanders & Mirabel 1996). Using the prescription of Kennicutt (1998) the IR luminosities of LIRGs imply star formation rates in the range 17–170 M☉ yr−1 for a Salpeter initial mass function (IMF).
The early studies of the AGN activity in LIRGs made use mostly of the optical spectral range. The classical studies of Veilleux et al. (1995) and Kim et al. (1995) showed that the fraction of sources containing an AGN increases at higher IR luminosities, although the relative contributions of star formation and AGN to the bolometric luminosity of the system were not well determined. Recently, Yuan et al. (2010) introduced a new approach for spectral classification of the Veilleux et al. (1995) sample. They found that ∼22% of LIRGs are classified as Seyfert or LINER, ∼37% are AGN/starburst (SB) composites, 24% are H ii-like, and the rest are ambiguous. They also showed that a large fraction of the LIRGs previously classified as LINERs are AGN/SB composites.
The AGN activity of local LIRGs has also been addressed using IR observations. Goldader et al. (1997a, 1997b) obtained near-IR spectroscopy of a large sample of LIRGs and found no new Seyfert 1 AGNs. In the mid-IR, Valiante et al. (2009) used spectroscopy obtained with the Spitzer Infrared Spectrograph (IRS) to estimate the AGN emission at 6 μm of a sample of IR bright galaxies, as an ingredient for their backward evolution model for IR surveys. Locally, they found an increasing contribution of the AGN emission at 6 μm at higher IR luminosities. They did not observe this tendency at higher redshifts, however, when modeling the mid-IR and submillimeter number counts. Petric et al. (2011), as part of the The Great Observatories All-Sky LIRG Survey (GOALS; see Armus et al. 2009), used a number of mid-IR spectral indicators to derive an AGN contribution of 12% for the GOALS LIRGs. At higher IR luminosities, most ultraluminous IR galaxies (ULIRGs, LIR = 1012–1013 L☉) are only dominated bolometrically by AGN emission at LIR ≳ 5 × 10¹² L☉ (Nardini et al. 2008, 2010).
In this paper, we decompose the Spitzer Space Telescope/IRS spectra of a complete volume-limited sample of LIRGs into SB and AGN components. The main goal is to derive the mid-IR and bolometric AGN contributions in these systems. Section 2 presents the sample and the observations, while Section 3 describes the analysis of the data. Section 4 gives the results of the spectral decomposition of the IRS data into the AGN and SB components. Section 5 compares the AGN mid-IR detections with other AGN indicators including mid-IR, optical, and X-ray indicators. Section 6 discusses the AGN detection rate and AGN bolometric contribution as a function of the IR luminosity and compares them with results for ULIRGs in the literature. Section 7 summarizes our conclusions. Throughout this paper, we assume the following cosmology: H0 = 70 km s−1Mpc−1, ΩM = 0.3, and ΩΛ = 0.7.
2. THE SAMPLE AND OBSERVATIONS
2.1. The Volume-limited Sample of Local LIRGs
We use the volume-limited sample of LIRGs defined by Alonso-Herrero et al. (2006b). This sample was originally drawn from the IRAS Revised Bright Galaxy Sample (RBGS; Sanders et al. 2003), which is a complete flux-limited survey at 60 μm with flux densities greater than 5.24 Jy and Galactic latitude |b| >5 deg. The distance limit imposed by Alonso-Herrero et al. (2006b) was chosen to allow for Paα observations with the narrowband F190N filter of Hubble Space Telescope/NICMOS. The sample here has been completed to include all the IRAS sources in the RBGS with log (LIR/L☉) ⩾ 11.05 and vhel = 2750–5300 km s−1. For the assumed cosmology the distances are in the range ≃ 40–78 Mpc, with a median value of 65 Mpc.
The sample is presented in Table 1; it contains 45 IRAS systems. Eight IRAS systems in our sample contain multiple galaxies, that is, they are interacting galaxies, pairs of galaxies, or galaxies with companions. These can be readily identified in Table 1 as having the same IRAS name. We note, however, that MCG−03-34-063, which is part of IRAS F13197−1627 with MCG−03-34-064 (Surace et al. 2004), is at 6394 km s−1 (from NED) and thus does not meet the distance criterion of our sample. Two galaxies, NGC 5743 and NGC 7769 (see Table 1), have IRS spectroscopy (see Section 2.2), but were not originally included in the IRAS RBGS. However, both galaxies are in interaction with RBGS IRAS sources (see Surace et al. 2004). NGC 5743 is paired with NGC 5734 and shows a diffuse Hα extension toward NGC 5734 (Dopita et al. 2002). NGC 7769 is part of the NGC 7771/NGC 7770 group, and there is evidence that NGC 7769 is undergoing a direct encounter with NGC 7771 (Nordgren et al. 1997). Additionally, these two galaxies not included in the RBGS have IR luminosities similar to the rest of the galaxies (see Table 1) and thus we included them in our sample. The sample contains a total of 53 individual galaxies.
Table 1. The Volume-limited Sample of Local LIRGs
| Galaxy Name | IRAS Name | vhel | Dist. | log LIR | Ref. | Spectral Class | Ref. |
|---|---|---|---|---|---|---|---|
| (km s−1) | (Mpc) | (L☉) | IR | Class | |||
| NGC 23 | IRAS F00073+2538 | 4478 | 64.7 | 11.11 | A1 | Composite | B1, B2 |
| MCG +12-02-001 | IRAS F00506+7248 | 4722 | 68.3 | 11.48 | A1 | H ii | B1 |
| NGC 633 | IRAS F01341−3735 | 5128 | 74.2 | 10.64 | A2 | Composite | B2 |
| ESO 297-G012 | " | 5183 | 75.0 | 11.06 | A2 | H ii | B3 |
| UGC 1845 | IRAS F02208+4744 | 4601 | 66.5 | 11.12 | A1 | Composite | B1 |
| UGC 02982 | IRAS F04097+0525 | 5355 | 77.6 | 11.23 | A1 | H ii | B4 |
| NGC 1614a | IRAS F04315−0840 | 4778 | 69.1 | 11.67 | A1 | Composite | B2 |
| CGCG 468-002-NED01 | IRAS F05054+1718 | 5268 | 76.3 | 10.55 | A3 | [Ne v] | B5, B6 |
| CGCG 468-002-NED02 | " | 4951 | 71.6 | 10.83 | A3 | ... | ... |
| UGC 3351 | IRAS F05414+5840 | 4433 | 64.1 | 11.26 | A1 | Sy2 | B7 |
| NGC 2369 | IRAS F07160−6215 | 3196 | 46.0 | 11.13 | A1 | Composite | B8 |
| NGC 2388 | IRAS F07256+3355 | 4078 | 58.9 | 11.23 | A1 | H ii | B1 |
| MCG +02-20-003 | IRAS F07329+1149 | 4908 | 71.0 | 11.11 | A1 | Composite | B1 |
| NGC 3110 | IRAS F10015−0614 | 5014 | 72.6 | 11.29 | A1 | H ii | B2 |
| NGC 3256 | IRAS F10257−4339 | 2790 | 40.1 | 11.66 | A1 | H ii | B9 |
| ESO 264-G057 | IRAS F10567−4310 | 5141 | 74.4 | 11.05 | A1 | H ii | B10 |
| NGC 3690 | IRAS F11257+5850 | 3057 | 44.0 | 11.43 | A4 | Sy2 | B11 |
| IC 694 | " | 3098 | 44.6 | 11.58 | A4 | LINER | B11 |
| ESO 320-G030 | IRAS F11506−3851 | 3038 | 43.7 | 11.22 | A1 | H ii | B8 |
| MCG−02-33-098-W | IRAS F12596−1529 | 4714 | 69.1 | 10.96 | A3 | Composite | B2 |
| MCG−02-33-098-E | " | 4775 | 69.1 | 10.48 | A3 | H ii | B2 |
| IC 860 | IRAS F13126+2453 | 3859 | 55.7 | 11.12 | A1 | No | B1 |
| MCG−03-34-064 | IRAS F13197−1627 | 5009 | 72.5 | 11.09 | A2 | H ii, [Ne v], Sy1h | B2, B5, B6, B12 |
| NGC 5135 | IRAS F13229−2934 | 4074 | 58.8 | 11.27 | A1 | Sy2, [Ne v] | B2, B5, B6 |
| ESO 173-G015 | IRAS 13242−5713 | 2948 | 42.4 | 11.57 | A1 | ... | ... |
| IC 4280 | IRAS F13301−2356 | 4843 | 70.1 | 11.01 | A1 | H ii | B8 |
| UGC 08739 | IRAS F13470+3530 | 5000 | 72.3 | 11.05 | A1 | ... | ... |
| ESO 221-IG010 | IRAS F13478−4848 | 3084 | 44.4 | 10.92 | A1 | H ii | B8 |
| NGC 5653 | IRAS F14280+3126 | 3513 | 50.7 | 10.98 | A1 | H ii | B2 |
| NGC 5734 | IRAS F14423−2039 | 3998 | 57.7 | 11.00 | A2 | Composite | B8 |
| NGC 5743 | IRAS F14423−2042 | 4121 | 59.5 | 10.84 | A2 | H ii, [Ne v] | B8, B5 |
| IC 4518W | IRAS F14544−4255 | 4720 | 68.2 | 11.15 | A3 | Sy2, [Ne v] | B10 |
| IC 4518E | " | 4518 | 66.3 | 10.28 | A3 | No | B8 |
| Zw 049.057 | IRAS F15107+0724 | 3858 | 55.7 | 11.21 | A1 | Composite | B13 |
| NGC 5936 | IRAS F15276+1309 | 3977 | 57.4 | 11.00 | A1 | H ii, Composite | B1, B2 |
| NGC 5990 | IRAS F15437+0234 | 3756 | 54.2 | 10.98 | A1 | Sy2, [Ne v] | B2, B5, B6 |
| NGC 6156 | IRAS 16304−6030 | 3253 | 46.9 | 11.12 | A1 | [Ne v] | B5, B6 |
| ... | IRAS F17138−1017 | 5161 | 74.7 | 11.39 | A1 | Composite/H ii | B2 |
| ... | IRAS 17578−0400 | 3931 | 56.7 | 11.31 | A1 | ... | ... |
| IC 4686a | IRAS F18093−5744 | 4948 | 71.6 | 10.98 | A3 | H ii | B2 |
| IC 4687 | " | 5105 | 73.9 | 11.30 | A3 | H ii | B2 |
| IC 4734 | IRAS F18341−5732 | 4623 | 66.8 | 11.27 | A1 | H ii | B10 |
| NGC 6701 | IRAS F18425+6036 | 3896 | 56.2 | 11.03 | A1 | Composite | B1 |
| NGC 6921a | IRAS 20264+2533 | 4327 | 62.5 | 10.37 | A2 | No | B14 |
| MCG +04-48-002 | " | 4199 | 60.6 | 10.96 | A2 | H ii, [Ne v] | B14, B5, B6 |
| NGC 7130 | IRAS F21453−3511 | 4837 | 70.0 | 11.38 | A1 | Sy2:, [Ne v] | B2, B5, B6 |
| IC 5179 | IRAS F22132−3705 | 3363 | 48.5 | 11.18 | A1 | H ii | B2 |
| NGC 7469 | IRAS F23007+0836 | 4840 | 70.0 | 11.64 | A1 | Sy1, [Ne v] | B1, B2, B5, B6 |
| NGC 7591 | IRAS F23157+0618 | 4907 | 71.0 | 11.11 | A1 | Composite, Sy2: | B1, B2 |
| NGC 7679 | IRAS 23262+0314 | 5162 | 74.7 | 11.12 | A1 | Sy2/Sy1, [Ne v] | B2, B5, B6 |
| NGC 7769 | IRAS F23485+1952 | 4158 | 60.0 | 10.90 | A2 | Composite | B13 |
| NGC 7770 | IRAS F23488+1949 | 4128 | 59.6 | 10.80 | A3 | H ii | B2 |
| NGC 7771 | " | 4277 | 61.8 | 11.33 | A3 | H ii, Composite | B1, B2 |
Notes. The heliocentric velocities are derived from the high-resolution Spitzer/IRS spectra. For interacting galaxies, the IR luminosities are given for the individual galaxies and the following column indicates the reference for this. The spectral class is the optical class and/or whether the [Ne v]14.32 μm line is detected. In this column "no" indicates that no classification was possible from the optical spectroscopic data. aNot observed with the IRS and the IRS observation of NGC 1614 is not well centered at its nucleus. The heliocentric velocities are from NED. References. (A1) RBGS: Sanders et al. 2003; (A2) Surace et al. 2004; (A3) This work from MIPS 24 μm data; (A4) Charmandaris et al. 2002; (B1) Alonso-Herrero et al. 2009a; (B2) Yuan et al. 2010; (B3) Kewley et al. 2001; (B4) Veilleux et al. 1995; (B5) this work; (B6) Petric et al. 2011; (B7) Baan et al. 1998; (B8) Pereira-Santaella et al. 2011; (B9) Lípari et al. 2000; (B10) Corbett et al. 2003; (B11) García-Marín et al. 2006; (B12) Lumsden et al. 2001; (B13) Parra et al. 2010; (B14) Masetti et al. 2006.
Download table as: ASCIITypeset image
The IR luminosities of the galaxies in the range 8–1000 μm, LIR, were calculated as defined by Sanders & Mirabel (1996). The IRAS flux densities were taken from Sanders et al. (2003) and Surace et al. (2004). The latter work used image reconstruction techniques to resolve the IR emission from the individual galaxies of interacting systems detected by IRAS. For the groups of galaxies and interacting galaxies not resolved by IRAS we assumed that the LIR fraction of each component is proportional to the Spitzer/MIPS 24 μm flux density (see Section 2.3) fraction. In Table 1, we list the IR luminosities for the individual galaxies in our sample, rather than for the systems in the case of pairs of galaxies and galaxies in groups. Note that some of the log LIR values are below the imposed limit either because the galaxy is member of a pair or because of the revised values of the distances.
2.2. IRS Spectroscopic Data
All individual galaxies in our sample, except for three,6 were observed by the Spitzer/IRS (Houck et al. 2004) instrument. We retrieved IRS spectroscopic data for our sample of LIRGs from the Spitzer archive. Fifteen IRAS systems (16 galaxies) in our sample were observed in mapping mode and one in staring mode as part of our own guaranteed time observation programs P30577 and P40479 (PI: G. H. Rieke) and were discussed in detail by Alonso-Herrero et al. (2009b) and Pereira-Santaella et al. (2010a). Two more galaxies are from various programs (IC 860 from P1096 and NGC 7469 from P14). The rest of the sample are part of the GOALS legacy program (Armus et al. 2009) and were observed in staring mode. Observations at low resolution (R ∼ 60–120) with the Short–Low (SL) and Long–Low (LL) modules and at high-resolution with the (R ∼ 600) Short–High (SH) and Long–High (LH) modules were available for all the galaxies.
For the staring and mapping data reduction, we followed Pereira-Santaella et al. (2010b) and Pereira-Santaella et al. (2010a), respectively. Briefly, we started with the basic calibrated data (BCD). Bad pixels were corrected using the IDL package IRSCLEAN.7 Then we subtracted the sky emission. For the staring data we extracted the spectra using the standard programs included in the Spitzer IRS Custom Extraction (SPICE) package provided by the Spitzer Science Center (SSC) and the point source calibration. For the mapping observations we constructed the data cubes using CUBISM (Smith et al. 2007). The nuclear spectra of the galaxies observed in mapping mode were extracted using a 13 4×134 aperture. Since the data cubes are calibrated as extended sources we applied a wavelength dependent aperture correction to the mapping data to obtain spectra comparable to those observed in staring mode. To calculate this aperture correction we used the mapping observations of standard stars (HR 7341, HR 6606, HR 6688, and HR 2491).
2.3. IRAC and MIPS Imaging Data
We used Spitzer imaging data obtained with the IRAC (Fazio et al. 2004) and the MIPS (Rieke et al. 2004) instruments, as part of the GOALS legacy program (Armus et al. 2009). We retrieved the BCD from the Spitzer archive. The BCD processing includes corrections for the instrumental response (pixel response linearization, etc.), flagging of cosmic rays and saturated pixels, dark and flat-fielding corrections, and flux calibration based on standard stars (see the IRAC and MIPS instrument handbooks for details). We combined the BCD images into mosaics using the MOsaicker and Point source EXtractor software provided by the SSC using the standard parameters.
We obtained integrated photometry of our LIRGs using an elliptical aperture chosen to encompass the emission of each galaxy. This ellipse was calculated by fitting the emission of the galaxy (3σ over the background) in the IRAC 8 μm band. In this work we only used the IRAC 5.8 μm and MIPS 24 μm images (see Section 4.2). For the IRAC images we applied the extended source aperture correction (up to 25%–35% in the IRAC 5.8 μm band) to the integrated fluxes (see the IRAC Instrument Handbook) to account for the diffuse scattering of the emission across the IRAC focal plane.
3. ANALYSIS
3.1. AGN+SB Spectral Decomposition of IRS Spectra
The main goal of this work is to estimate quantitatively the AGN activity, both in terms of mid-IR detection and bolometric contribution, in a complete sample of local LIRGs. In this section, we fit the Spitzer/IRS SL+LL spectra with a combination of SB and AGN templates. Our approach to estimate the AGN contribution is similar to other works in the literature (Nardini et al. 2008, 2010). Basically these methods hinge on the close similarity of the mid-IR spectra of high-metallicity SBs (see Brandl et al. 2006), and the strong differences in the spectral shape of AGN and SB emissions in this spectral range. This makes it possible to use templates to represent the SB and AGN activity (or a power-law continuum for the latter), and thereby make a spectral decomposition of the observed mid-IR spectra of galaxies into SB and AGN components. The main difference between our method and that of Nardini et al. is that we use the entire spectral range of the SL+LL IRS spectra, ∼5–38 μm, while they only used the 5–8 μm spectral range. In related works both Valiante et al. (2009) and Deo et al. (2009) derived the AGN contribution at different mid-IR wavelengths of samples of local LIRGs and Seyfert galaxies, respectively, by subtracting a scaled SB template from the observed IRS spectra. We will compare our results with theirs in Section 4.1.
The AGN emission in the mid-IR is emission reprocessed by warm dust in the putative dusty torus that surrounds the AGN (Antonucci 1993). Instead of representing the AGN mid-IR emission as a power law (e.g., as done by Nardini et al. 2010) we used the Nenkova et al. (2008a, 2008b) clumpy dusty torus models together with the BayesClumpy routine (Asensio Ramos & Ramos Almeida 2009; see the Appendix for more details) to fit the data. These torus models (implemented in the CLUMPY code) are found to reproduce well the nuclear near- and mid-IR AGN emission of local Seyfert galaxies and PG quasars (Nikutta et al. 2009; Mor et al. 2009; Ramos Almeida et al. 2009, 2011; Alonso-Herrero et al. 2011). Moreover, clumpy dusty torus models in general appear to reproduce better the observed IR emission of local AGNs than smooth density torus models (see, e.g., Alonso-Herrero et al. 2003; Schartmann et al. 2008; Mullaney et al. 2011). For the SB component, we used the average spectrum of local SBs of Brandl et al. (2006), as well as the LIRG templates of Rieke et al. (2009) in the range log (LIR/L☉) = 10.5–12.
The Nenkova et al. (2008a, 2008b) clumpy torus models are defined by six parameters describing the torus geometry and the properties of the dusty clouds. In the Appendix, we give a short description of the models. An additional parameter is the normalization needed to match the model to the observed IR data, which scales directly with the AGN bolometric luminosity Lbol(AGN). Our use of these models depends on the scaling of the torus model and the AGN bolometric luminosity, rather than on the individual torus parameters. Alonso-Herrero et al. (2011) recently showed that the values of Lbol(AGN) derived from the modeling of the nuclear near- and mid-IR emission of local Seyfert galaxies with the CLUMPY models were in good agreement with literature estimates.
Details of the AGN+SB decomposition method are given in the Appendix. Figure 1 shows a few examples of the results of the AGN+SB best fits for four different LIRGs with increasing AGN contributions. MCG +12-02-001 shows no evidence for the presence of an AGN, while the mid-IR continuum emission of IC 4518W is dominated by the AGN component. NGC 5135 and NGC 7469 are intermediate cases. The AGN is clearly detected in NGC 5135 and dominates the ∼6 μm emission within the IRS slit, but the SB component accounts for most of the continuum emission at λ > 15 μm. The AGN and SB components of NGC 7469 have similar contributions within the IRS slit up to ∼20 μm, but then at >20 μm the SB component clearly takes over. The AGN+SB best fits for the rest of the sample are presented in Figures 10 and 11. For those galaxies requiring an AGN component to fit their IRS spectra, Table 2 gives the AGN contribution within the Spitzer/IRS slit to the continuum emission at four different reference wavelengths relatively free of features: 6, 20, 24, and 30 μm.

Figure 1. Examples of the AGN+SB best fits of the SL+LL IRS spectra for four LIRGs in our sample with increasing AGN contributions from top left to bottom right. The rest of the fits for the sample are presented in Figures 10 and 11. For reference, the best-fit model of MCG +12-02-001 does not require AGN emission, whereas the AGN contribution within the Spitzer/IRS slit at λ ⩾ 20 μm increases from NGC 5135, to NGC 7469, and IC 4518W (see Table 2). For each galaxy, the black line is the observed spectrum in the rest-frame wavelength, the dash-dotted (green) line is the fitted torus model, the dashed (purple) line is the scaled SB template, and the solid red line is the sum of the fitted SB and AGN components. Note that for the AGN component the models only produce the continuum emission. Thus in the case of IC 4518W the bright AGN emission lines are not reproduced by the sum of the AGN and SB components.
Download figure:
Standard image High-resolution imageTable 2. AGN Fractional Contributions within the IRS Slit from the AGN+SB Decomposition
| Galaxy | CIRS6 μm[AGN] | CIRS20 μm[AGN] | CIRS24 μm[AGN] | CIRS30 μm[AGN] |
|---|---|---|---|---|
| NGC 23 | 0.16 | 0.10 | 0.06 | 0.02 |
| NGC 633 | 0.15 | 0.07 | 0.03 | 0.01 |
| CGCG 468-002-NED01 | 0.54 | 0.83 | 0.82 | 0.79 |
| UGC 3351 | 0.25 | 0.15 | 0.11 | 0.06 |
| NGC 2369 | 0.26 | 0.16 | 0.10 | 0.04 |
| NGC 3690 | 0.81 | 0.70 | 0.60 | 0.47 |
| MCG−02-33-098-W | 0.09 | 0.42 | 0.33 | 0.23 |
| MCG−03-34-064 | 0.77 | 0.93 | 0.91 | 0.85 |
| NGC 5135 | 0.54 | 0.26 | 0.16 | 0.09 |
| UGC 08739 | 0.33 | 0.14 | 0.08 | 0.03 |
| NGC 5653 | 0.12 | 0.10 | 0.05 | 0.02 |
| NGC 5743 | 0.39 | 0.28 | 0.18 | 0.09 |
| IC 4518W | 0.53 | 0.71 | 0.69 | 0.60 |
| NGC 5936 | 0.30 | 0.13 | 0.08 | 0.04 |
| NGC 5990 | 0.33 | 0.30 | 0.21 | 0.12 |
| NGC 6156 | 0.49 | 0.73 | 0.65 | 0.57 |
| IC 4687 | 0.12 | 0.09 | 0.05 | 0.02 |
| NGC 6701 | 0.25 | 0.15 | 0.08 | 0.04 |
| MCG +04-48-002 | 0.20 | 0.40 | 0.41 | 0.34 |
| NGC 7130 | 0.36 | 0.26 | 0.18 | 0.11 |
| NGC 7469 | 0.49 | 0.52 | 0.43 | 0.34 |
| NGC 7679 | 0.27 | 0.33 | 0.24 | 0.15 |
| NGC 7769 | 0.41 | 0.29 | 0.19 | 0.13 |
| NGC 7770 | 0.58 | 0.40 | 0.27 | 0.15 |
| NGC 7771 | 0.19 | 0.09 | 0.05 | 0.02 |
Download table as: ASCIITypeset image
3.2. Line and Feature Measurements
Most of the galaxies in our sample of LIRGs were part of the compilation of Spitzer/IRS SH and LH fluxes of fine-structure lines of Pereira-Santaella et al. (2010b). For those not included there, the emission line fluxes were measured by fitting a Gaussian to the line plus a first-order polynomial to the local continuum (see Pereira-Santaella et al. 2010b for more details). The lines were considered as detected if the peak of the emission line was 3σ or move above the local continuum, where σ is the standard deviation of the local continuum. The errors in the measured line fluxes depend on the signal-to-noise ratio of the detected line, but are typically 10% for the bright lines [Ne ii]12.81 μm and [Ne iii]15.56 μm. For the fainter lines ([O iv]25.89 μm and [Ne v]) the uncertainties are higher (15%–30%), except in bright AGNs as these lines are intense and the uncertainties are approximately 10%. The [O iv]25.89 μm line fluxes (or upper limits) are given in Table 3, together with those of the [Ne ii]12.81 μm and [Ne iii]15.56 μm emission lines. Additionally, we detected the [Ne v]14.32 μm line in five galaxies in our sample not included in Pereira-Santaella et al. (2010b): CGCG 468-002-NED01, NGC 5990, NGC 6156, MCG +04-48-002, and NGC 7679 (see also Petric et al. 2011). Table 4 lists the [Ne v]14.32 μm line detections for our complete sample of LIRGs.
Table 3. New IRS SH+LH Line Fluxes
| Galaxy | [O iv] | [Ne ii] | [Ne iii] |
|---|---|---|---|
| ESO 297-G012 | 1.09 | 46.68 | 12.38 |
| UGC 02982 | 1.58 | 75.13 | 9.07 |
| CGCG 468-002-NED01 | 8.98 | 9.01 | 7.47 |
| CGCG 468-002-NED02 | <1.07 | 43.32 | 5.91 |
| ESO 264-G057 | 0.91 | 46.67 | 3.52 |
| ESO 173-G015 | <1.97 | 224.85 | 27.34 |
| IC 4280 | <0.18 | 50.76 | 3.76 |
| UGC 08739 | <0.77 | 28.85 | 4.12 |
| ESO 221-IG010 | 2.18 | 86.74 | 11.81 |
| NGC 5990 | 11.77 | 61.92 | 17.86 |
| NGC 6156 | 6.96 | 35.47 | 10.73 |
| IRAS 17578−0400 | <0.98 | 56.29 | 11.46 |
| MCG +04-48-002 | 8.42 | 93.19 | 20.00 |
| NGC 7679 | 34.1 | 77.29 | 30.05 |
| NGC 7770 | <0.8 | 30.82 | 7.82 |
Note. Fluxes are in units of 10−17 W m−2.
Download table as: ASCIITypeset image
Table 4. AGN Indicators
| Galaxy Name | Spectral Class | [Ne v] | Ctot6 μm[AGN] | Ctot24 μm[AGN] | [O iv]/[Ne ii] | EW(6.2 μm PAH) | SSi |
|---|---|---|---|---|---|---|---|
| Detection | |||||||
| NGC 23 | Composite | No | 0.06 | 0.05 | 0.014 | 0.52 | −0.36 |
| MCG +12-02-001 | H ii | No | <0.05 | <0.05 | 0.016 | 0.56 | −0.33 |
| NGC 633 | Composite | No | 0.08 | 0.03 | 0.037 | 0.48 | −0.30 |
| ESO 297-G012 | H ii | No | <0.06 | <0.05 | 0.023 | 0.61 | −0.65 |
| UGC 1845 | Composite | No | <0.07 | <0.05 | 0.029 | 0.51 | −0.94 |
| UGC 02982 | H ii | No | <0.03 | <0.04 | 0.021 | 0.57 | −0.58 |
| CGCG 468-002-NED01 | AGN | Yes | 0.34 | 0.80 | 0.997 | 0.10 | −0.16 |
| CGCG 468-002-NED02 | ... | No | <0.08 | <0.05 | <0.025 | 0.37 | −1.19 |
| UGC 3351 | Sy2 | No | 0.07 | 0.07 | 0.012 | 0.42 | −1.16 |
| NGC 2369 | Composite | No | 0.14 | 0.08 | 0.015 | 0.41 | −0.78 |
| NGC 2388 | H ii | No | <0.08 | <0.05 | 0.012 | 0.50 | −0.51 |
| MCG +02-20-003 | Composite | No | ... | <0.05a | <0.019 | 0.12 | −1.47 |
| NGC 3110 | H ii | No | <0.04 | <0.04 | 0.016 | 0.57 | −0.33 |
| NGC 3256 | H ii | No | <0.05 | <0.04 | <0.026 | 0.53 | −0.45 |
| ESO 264-G057 | H ii | No | <0.03 | <0.04 | 0.019 | 0.51 | −0.60 |
| NGC 3690 | Sy2 | No | 0.44 | 0.28 | 0.143 | 0.16 | −0.60 |
| IC 694 | LINER | No | <0.04 | <0.02 | <0.064 | 0.60 | −1.80 |
| ESO 320-G030 | H ii | No | <0.07 | <0.04 | <0.008 | 0.51 | −0.46 |
| MCG−02-33-098-W | Composite | No | 0.05 | 0.37 | <0.017 | 0.48 | −0.02 |
| MCG−02-33-098-E | H ii | No | <0.08 | <0.09 | 0.039 | 0.61 | −0.37 |
| IC 860 | No | No | <0.05 | <0.05 | <0.173 | 0.36 | −1.58 |
| MCG−03-34-064 | Sy1 | Yes | 0.64 | 0.85 | 2.054 | 0.01 | −0.19 |
| NGC 5135 | Sy2 | Yes | 0.39 | 0.14 | 0.658 | 0.33 | −0.37 |
| ESO 173-G015 | ... | No | <0.04 | <0.04 | <0.009 | 0.33 | −1.75 |
| IC 4280 | H ii | No | <0.02 | <0.03 | <0.004 | 0.52 | −0.43 |
| UGC 08739 | ... | No | 0.12 | 0.06 | <0.027 | 0.42 | −1.18 |
| ESO 221-IG010 | H ii | No | <0.02 | <0.04 | 0.025 | 0.55 | −0.32 |
| NGC 5653 | H ii | No | 0.03 | 0.04 | <0.018 | 0.49 | −0.33 |
| NGC 5734 | Composite | No | <0.03 | <0.04 | 0.012 | 0.42 | −0.45 |
| NGC 5743 | Composite | Yes | 0.14 | 0.15 | 0.065 | 0.43 | −0.57 |
| IC 4518W | Sy2 | Yes | 0.34 | 0.67 | 2.119 | 0.05 | −1.22 |
| IC 4518E | No | No | <0.04 | <0.04 | 0.019 | 0.47 | −0.56 |
| Zw 049.057 | Composite | No | <0.06 | <0.05 | <0.029 | 0.40 | −1.09 |
| NGC 5936 | Composite | No | 0.09 | 0.07 | 0.013 | 0.50 | −0.47 |
| NGC 5990 | Sy2 | Yes | 0.22 | 0.18 | 0.190 | 0.13 | −0.64 |
| NGC 6156 | AGN | Yes | 0.05 | 0.43 | 0.196 | 0.34 | 0.57 |
| IRAS 17138−1017 | Composite | No | <0.07 | <0.05 | <0.028 | 0.54 | −0.66 |
| IRAS 17578−0400 | ... | No | <0.09 | <0.04 | <0.017 | 0.52 | −1.10 |
| IC 4687 | H ii | No | 0.07 | 0.05 | 0.017 | 0.63 | −0.26 |
| IC 4734 | H ii | No | <0.05 | <0.05 | <0.028 | 0.40 | −1.01 |
| NGC 6701 | Composite | No | 0.09 | 0.06 | 0.029 | 0.50 | −0.56 |
| MCG +04-48-002 | Composite | Yes | 0.09 | 0.41 | 0.090 | 0.50 | −0.92 |
| NGC 7130 | Sy2 | Yes | 0.20 | 0.15 | 0.186 | 0.34 | −0.30 |
| IC 5179 | H ii | No | <0.04 | <0.03 | 0.017 | 0.58 | −0.28 |
| NGC 7469 | Sy1 | Yes | 0.32 | 0.40 | 0.125 | 0.21 | −0.13 |
| NGC 7591 | Composite | No | <0.04 | <0.04 | <0.010 | 0.38 | −0.87 |
| NGC 7679 | Sy1/Sy2 | Yes | 0.12 | 0.23 | 0.441 | 0.56 | −0.05 |
| NGC 7769 | Composite | No | 0.06 | 0.10 | 0.032 | 0.41 | −0.23 |
| NGC 7770 | H ii | No | 0.29 | 0.27 | <0.026 | 0.28 | −0.33 |
| NGC 7771 | Composite | No | 0.08 | 0.04 | 0.011 | 0.45 | −0.59 |
Notes. The spectral class is from Table 1. If a galaxy is classified as H ii or composite, we list the composite classification. Those galaxies with [Ne v]14.32 μm detections not classified as Seyfert galaxies from optical spectroscopy are labeled as "AGN" or "composite" depending on whether the observed [O iv]25.89 μm/[Ne ii]12.81 μm line ratio is high or low, respectively (see Section 5.1). The [Ne v] column indicates if the [Ne v]14.32 μm high-excitation line is detected. Ctot6 μm[AGN] and Ctot24 μm[AGN] are the AGN fractional contributions to the total 6 and 24 μm emission, respectively. [O iv]/[Ne ii] is the observed line ratio, with typical uncertainties of 10%–15% for bright AGNs and 15%–30% for the rest. The EWs of the 6.2 μm PAH features are measured in μm, and the typical uncertainties are 0.05 μm. SSi is the apparent strength of the 9.7 μm silicate feature and the typical uncertainties are 0.02. aThe integrated flux density is from IRAS 25 μm converted to MIPS 24 μm.
Download table as: ASCIITypeset image
To measure the apparent strength of the 9.7 μm silicate feature from the SL spectra, we used the definition of Spoon et al. (2007), SSi = ln (fobs/fcont) evaluated at 9.7 μm. To estimate the continuum emission, we used the same method as Pereira-Santaella et al. (2010a), that is, we fitted a power law between the feature-free continuum pivots at 5.5 μm and 13 μm. We also measured the equivalent width (EW) of the 6.2 μm aromatic feature, also known as a polycyclic aromatic feature (PAH). The local continuum was measured using a linear fit between 5.75 μm and 6.7 μm, and the feature was measured between 5.9 and 6.5 μm. Table 4 reports the values of SSi and EW(6.2 μm PAH) for our sample of LIRGs. For objects with the silicate feature in emission SSi is positive, whereas it is negative for objects with the feature in absorption.
4. RESULTS FROM THE DECOMPOSITION OF THE SPITZER/IRS SPECTRA
4.1. AGN Dust Emission within the Spitzer/IRS Slits
Using the AGN+SB spectral decomposition of the IRS low-resolution data, we detected an AGN component in half of the LIRGs in our sample (25/50) with available data. Table 2 gives the AGN fractional contribution within the slit at 6, 20, 24, and 30 μm for each of them. Figure 2 shows the distributions of the AGN fractional contributions within the IRS slit at two of the reference continuum wavelengths. On average the AGN fractional contribution within the IRS slits is relatively small, as can be seen from Table 2. There are only six galaxies with a dominant AGN contribution within the IRS slit at the four reference continuum wavelengths: CGCG 468-002-NED01, MCG−03-34-064, IC 4518W, NGC 6156, NGC 7469, and NGC 3690.

Figure 2. Distributions of the AGN fractional contributions within the Spitzer/IRS slit of local LIRGs at 6 μm (lower panel) and 24 μm (upper panel). The AGN detections are shown as filled histograms, while the non-detections are shown as empty histograms. Also marked are the medians of the AGN fractional contribution (detections) distributions within the Spitzer/IRS slit (see Table 5).
Download figure:
Standard image High-resolution imageFor the sample of LIRGs the median values of the AGN fractional contributions tend to be similar at 6 and 20 μm for our sample (median CIRS6 μm[AGN] ≃ C20 μmIRS[AGN] = 0.3, see Table 5), although individual galaxies show larger variations. For the majority of local LIRGs, the AGN fractional contributions decrease significantly at λ > 20–30 μm, as also found in local Seyfert galaxies (Deo et al. 2009) and X-ray-selected AGNs (Mullaney et al. 2011). The median value of the AGN fractional contribution at 24 and 30 μm for the LIRGs with AGN detections are CIRS24 μm[AGN] = 0.18 and CIRS30 μm[AGN] = 0.11, respectively. For the four Seyfert galaxies in our sample in common with Deo et al. (2009), the AGN fractional contributions within the IRS slit at the common continuum wavelengths are in good agreement.
Table 5. Statistics of the AGN Contribution in LIRGs with AGN Detections from Spectral Decomposition
| Quantity | Mean | Median | 16th–84th |
|---|---|---|---|
| Within IRS Slit | |||
| CIRS6 μm[AGN] | 0.36 | 0.33 | 0.16–0.54 |
| CIRS20 μm[AGN] | 0.34 | 0.28 | 0.10–0.71 |
| CIRS24 μm[AGN] | 0.28 | 0.18 | 0.06–0.65 |
| CIRS30 μm[AGN] | 0.21 | 0.11 | 0.02–0.57 |
| Total Emission | |||
| Ctot6 μm[AGN] | 0.18 | 0.12 | 0.07–0.34 |
| Ctot24 μm[AGN] | 0.24 | 0.15 | 0.05–0.43 |
| AGN Bolometric Contribution | |||
| Lbol[AGN]/LIR | 0.12 | 0.05 | 0.02–0.26 |
Notes. The columns are the mean, median (50th percentile), and the 16th and 84th percentiles. The numbers in the last column are the 68% confidence interval. This would be equivalent to ±1σ of the distribution around the mean value in a normal distribution.
Download table as: ASCIITypeset image
The fractional AGN contributions listed in Table 2 can also be used to get a rough estimate of the sensitivity of our AGN+SB decomposition method to the presence of a low-luminosity AGN. As discussed in the Appendix, we only considered an AGN detection when its contribution was greater than 5%–7% at 20 μm. Therefore, it appears that our fitting method can only detect an AGN for fractional contributions CIRS6 μm[AGN] ≳ 0.15, CIRS24 μm[AGN] ≳ 0.05, and CIRS30 μm[AGN] ≳ 0.02–0.04.
Valiante et al. (2009) estimated the AGN emission at 6 μm of a sample of LIRGs by subtracting a SB template from the observed spectra in a much more limited spectral range, 5.6–6.9 μm. They employed the M82 spectrum and the average spectrum of Brandl et al. (2006), the latter to account for the dispersion of properties in star-forming galaxies. Both templates tend to have a lower 6 μm continuum than the LIRG templates of Rieke et al. (2009). A large fraction of the galaxies in our sample were included in their work. For the AGN detections we find a relatively good agreement, within 10%–50% of each other, for the AGN flux densities at 6 μm. The largest discrepancy is for NGC 5135 for which we find a clear AGN component (see Figure 1) at 6 μm, whereas the Valiante et al. (2009) upper limit is well below our estimate. Apart from our much broader spectral range, the differences may also arise from the different SB templates. We found a similar behavior from our fits. In those cases where we obtained comparable fits with the Brandl et al. (2006) average spectrum and the LIRG 11.50 L☉ template, the AGN fractional contribution within the IRS slit at 6 μm using the latter template was lower, almost by a factor of two, than using the former. For those galaxies for which Valiante et al. (2009) did not detect an AGN component, our estimated AGN 6 μm flux densities are compatible with their upper limits.
4.2. AGN Contribution to the Total Mid-IR Continuum Emission
The extent of the mid-IR emission of LIRGs shows no clear dependence on the IR luminosity of the system; some galaxies show relatively compact emission (∼1 kpc), while others show extended emission over a few kiloparsecs (Soifer et al. 2001; Alonso-Herrero et al. 2006a; Díaz-Santos et al. 2008; Pereira-Santaella et al. 2010a). It is only at the high-luminosity end of LIRGs (log (LIR/L☉) ≳ 11.80) and in ULIRGs, that the mid-IR emission starts appearing very compact (Soifer et al. 2000; Díaz-Santos et al. 2010). Moreover, the extent of the emission may depend markedly on the wavelength of the emission. For instance, several studies found that in LIRGs and star-forming galaxies the PAH emission tends to be more extended than the mid-IR continuum (see, e.g., Helou et al. 2004; Alonso-Herrero et al. 2009b; Pereira-Santaella et al. 2010a).
The IRS slits do not generally cover the full extent of the galaxies. For the median distance of our LIRGs the ∼13'' slits cover approximately the central 4 kpc. In this section, we derive the AGN contribution to the total emission at two continuum wavelengths. To do so, we measured the total galaxy emission in the mid-IR using Spitzer imaging at two wavelengths IRAC 5.8 μm and MIPS 24 μm. The integrated flux densities were then compared with the AGN emission at these wavelengths from the AGN+SB decomposition. Table 4 lists the AGN contribution to the 6 and 24 μm total emission, Ctot6 μm[AGN] and Ctot24 μm[AGN]. For the AGN non-detections we give the upper limits based on our estimated AGN detection limits as explained in Section 4.1.
The median AGN contribution to the total 6 and 24 μm emission is 0.12 and 0.15, respectively, for those galaxies with an AGN mid-IR detection (see Table 5). Only ∼6% of local LIRGs have their 24 μm emission dominated by the AGN. Unlike what we found for the AGN fractional contributions within the IRS slits, for some LIRGs the AGN contribution to the total emission can be higher at 24 μm than at 6 μm, especially for those LIRGs dominated by the AGN contribution. It is possible that the IRAC 5.8 μm maps include a significant contribution from the 6.2 μm PAH feature (see Helou et al. 2004 and references therein), as well as some photospheric emission. Additionally, the emission from CLUMPY torus models is expected to be mostly isotropic at 24 μm, whereas that might not be the case at 6 μm for obscured views (i.e., type 2) of the AGN (see, e.g., Nenkova et al. 2008b).
In summary, the mid-IR emission is only dominated by the AGN (Ctot24 μm[AGN] > 0.5) in 6% (3/50) of local LIRGs. About one-quarter of the sample (12/50) have intermediate AGN contributions (Ctot24 μm[AGN] = 0.1–0.5), while the remaining ∼70% (35/50) have little (Ctot24 μm[AGN] ≃ 0.04–0.1) or no AGN contribution in the mid-IR.
5. COMPARISON WITH OTHER AGN DIAGNOSTICS
5.1. Spectroscopic Activity Class
The nuclear activity (AGN versus star formation activity) of local LIRGs has been the subject of numerous studies using optical spectroscopy (see among others; Veilleux et al. 1995; Wu et al. 1998; Kewley et al. 2001; Alonso-Herrero et al. 2009a; Yuan et al. 2010). These works made use of the classical optical spectral diagnostic diagrams (Veilleux & Osterbrock 1987) and/or the more recent classification scheme based on observations of large numbers of galaxies and modeling (Kauffmann et al. 2003; Kewley et al. 2006). Table 1 lists the spectral activity class for the 53 galaxies in our sample and the relevant references. Out of the 42 individual LIRGs with an optical class there are 17 pure H ii-like nuclei, 15 composite8 (AGN/SB) nuclei, and 10 AGN (Seyfert 1, Seyfert 2, LINER). Two more LIRGs do not have an optical class but have [Ne v]14.32 μm detections and high [O iv]25.89 μm/[Ne ii]12.81 μm ratios (Table 4, and see also Petric et al. 2011), and thus are clearly AGNs. Finally, NGC 5743 and MCG+04-48-002 were optically classified as H ii, but both have an [Ne v] detection. Both have also relatively low [O iv]25.89 μm/[Ne ii]12.81 μm ratios, which are typical of star-forming galaxies (see Table 4 and Section 5.4). Therefore, although these two galaxies do contain an AGN, they are likely to be composite in nature. The rest (seven LIRG nuclei) do not have an optical classification. In summary, 23% of our sample are AGNs, 32% are H ii-like, 32% are AGN/SB composites, and the remaining 13% do not have a spectral classification.
As can be seen from Table 4, all 13 LIRGs with an optical classification as Seyfert nuclei and/or an [Ne v]14.32 μm detection have an AGN component detected through the AGN+SB decomposition of the IRS spectra. The AGN contributions at 24 μm for these vary from 7% for UGC 3351 to almost 90% for MCG−03-34-064. Among the 14 optically composite nuclei with IRS spectra, 8 have an AGN component detected with AGN contributions at 24 μm in the range 4%–28%. Three of the fifteen pure H ii nuclei have an AGN component, but with a small AGN contribution at 24 μm except for NGC 7770.
5.2. AGN Bolometric Luminosities and Comparison with X-Ray Estimates
The AGN bolometric luminosities derived from the torus model fits (Section 3.1) are between 0.4 and 50 × 1043 erg s−1, with a median value of Lbol[AGN] = 2 × 1043 erg s−1. Galaxies classified as Seyfert galaxies tend to show the highest values of Lbol[AGN], whereas the non-Seyfert galaxies have a median value of Lbol[AGN] ∼ 1 × 1043 erg s−1. The AGN bolometric contribution to the IR luminosity of the individual nuclei ranges between 1% and 70%, with an average value of Lbol[AGN]/LIR = 12% (median of 5%) for those LIRGs with an AGN detection (see Table 5). For the AGN non-detections we estimate that if an AGN is present its bolometric contribution would be Lbol[AGN]/LIR < 1%.
Pereira-Santaella et al. (2011) studied the X-ray emission of a representative, in terms of LIR and nuclear activity, sample of local LIRGs drawn from the sample presented in this paper. Table 6 lists the eight Seyfert galaxies in common with their work. In this section, we compare our estimates of the AGN bolometric luminosity for the Seyfert galaxies with those obtained by Pereira-Santaella et al. (2011) from the hard 2–10 keV luminosities, as well as with the values derived from the luminosity of the 6.4 keV FeKα line for the Compton-thick sources. The AGN bolometric luminosities were computed using the bolometric corrections of Marconi et al. (2004). All of these values are listed in Table 6. The last column in Table 6 gives the differences of the two estimates (taken in logarithmic units) of the AGN bolometric luminosity, which are on average 0.4 dex. This is similar to the differences in bolometric luminosity estimates found by Alonso-Herrero et al. (2011) for a sample of nearby Seyfert galaxies. We excluded NGC 7679 because it appears to be highly variable in X-rays (see the discussions by Della Ceca et al. 2001; Pereira-Santaella et al. 2011).
Table 6. Comparison between X-Ray and AGN+SB Decomposition AGN Bolometric Luminosities
| Galaxy | L2–10 kev | Lbol[AGN] | Lbol[AGN] | Diff. |
|---|---|---|---|---|
| X-Ray | IRS Fit | |||
| NGC 3690 | 3.9a | 55. | 88. | −0.20 |
| MCG−03-34-064 | 15 | 290. | 330. | −0.06 |
| NGC 5135 | 10a | 180. | 53. | 0.53 |
| IC 4518W | 2.2 | 26. | 71. | −0.44 |
| MCG +04-48-002 | 6.9 | 120. | 21. | 0.76 |
| NGC 7130 | 10a | 180. | 40. | 0.65 |
| NGC 7469 | 17 | 340. | 460. | −0.13 |
| NGC 7679 | 3.7/0.4b | 56./4. | 75. | ... |
Notes. All the luminosities are in units of 1042 erg s−1. The 2–10 keV luminosities (corrected for absorption) and the Lbol[AGN] from X-rays are from Pereira-Santaella et al. (2011). The typical uncertainties are 5%–10% and 25%, respectively. The formal errors for Lbol[AGN] from the IRS spectral decomposition are 0.1–0.2 dex. The last column is the difference between the two estimates of the AGN bolometric luminosity taken in logarithmic units. aEstimated from the luminosity of the FeKα line. bVariable? First value is from Della Ceca et al. (2001) and second value from Pereira-Santaella et al. (2011).
Download table as: ASCIITypeset image
From the upper limits of the luminosity of the hard X-ray FeKα emission line, Pereira-Santaella et al. (2011) concluded that in the rest of their sample, if there is an AGN the bolometric luminosity should be ≲ 1043 erg s−1. This is again consistent with the typical AGN bolometric luminosities for the non-Seyfert LIRGs in our sample.
5.3. The [O iv] 25.89 μm High-excitation Line
AGNs can be readily identified in the mid-IR via the detection of high-excitation emission lines (see, e.g., Genzel et al. 1998; Sturm et al. 2002; Meléndez et al. 2008), especially the [Ne v]14.32 μm and [Ne v]24.32 μm lines. These are unlikely to be produced by star formation, but they are not always detected in relatively bright AGNs (see Weedman et al. 2005; Pereira-Santaella et al. 2010b). The detection rate of the [Ne v]14.32 μm line in our complete sample of local LIRGs is ∼22% (11/50), as can be seen from Table 4.
Because the [O iv]25.89 μm emission line has a lower ionization potential (54.9 eV) than the [Ne v] lines (97.1 eV), the mid-IR oxygen line is detected in a larger fraction of known AGNs (Pereira-Santaella et al. 2010b). Moreover, the [O iv]25.89 μm line appears to be a good indicator of the AGN power (Meléndez et al. 2008; Diamond-Stanic et al. 2009; Rigby et al. 2009), although it can also be produced in star-forming galaxies (Lutz et al. 1998; Pereira-Santaella et al. 2010b).
The [O iv]25.89 μm line is detected in 70% of our sample of local LIRGs (35/50 of the individual nuclei with IRS LH spectra available). In this statistic we include NGC 3256 and IC 694 for which the line was detected using IRS staring mode spectra by Bernard-Salas et al. (2009) and Alonso-Herrero et al. (2009b), respectively. The detection rate in the GOALS9 LIRG sample (53% of their sources; see Petric et al. 2011) is slightly lower than in our sample. By comparison the [O iv]25.89 μm line is detected in ∼26% of the ULIRGs studied by Veilleux et al. (2009), but mostly in those galaxies classified as Seyfert and LINER. The detection of this line in the Farrah et al. (2007) ULIRG sample is just under 50%.
In terms of the spectral class the [O iv]25.89 μm line is detected in all (11) of those galaxies optically classified as AGN, that is, Seyfert galaxies and/or [Ne v]14.32 μm detections. Eleven of the 17 galaxies optically classified as composites also show [O iv]25.89 μm emission. Interestingly, eight LIRGs optically classified as H ii-like galaxies are detected in [O iv]25.89 μm, but have no evidence of a hot dust component from the IRS AGN+SB decomposition analysis.
Figure 3 (upper panel) shows the distribution of the [O iv]25.89 μm luminosities of our sample. We also show in this figure as filled histograms those LIRGs with an AGN detection, including Seyfert galaxies, composites, [Ne v]14.32 μm detections, and LIRGs with an AGN component from the AGN+SB decomposition. It is clear from this figure that all the LIRGs with ![$L_{[{\rm O\,\mathsc{iv}}]}\ge 10^7\,{L_\odot }$](https://content.cld.iop.org/journals/0004-637X/744/1/2/revision1/apj406692ieqn2.gif) have an AGN detected. For the merger LIRG NGC 3256, we plotted here our upper limit from the IRS spectral mapping data, but the flux measurement of Bernard-Salas et al. (2009) from an IRS staring mode spectrum provides a luminosity of
have an AGN detected. For the merger LIRG NGC 3256, we plotted here our upper limit from the IRS spectral mapping data, but the flux measurement of Bernard-Salas et al. (2009) from an IRS staring mode spectrum provides a luminosity of ![$L_{[{\rm O\,\mathsc{iv}}]}\sim 6 \times 10^6\,{L_\odot }$](https://content.cld.iop.org/journals/0004-637X/744/1/2/revision1/apj406692ieqn3.gif) . At luminosities
. At luminosities ![${\sim}10^5\,{L}_\odot < L_{[{\rm O\,\mathsc{iv}}]}\le 10^7\,{L_\odot }$](https://content.cld.iop.org/journals/0004-637X/744/1/2/revision1/apj406692ieqn4.gif) approximately 50% of the LIRGs are found to host an AGN.
approximately 50% of the LIRGs are found to host an AGN.

Figure 3. Upper panel: distribution of the [O iv]25.89 μm emission line luminosities (detections and upper limits) of our sample of local LIRGs. The filled histograms correspond to those LIRGs with an AGN detection using optical and mid-IR methods. The arrows mark the upper limits to the [O iv]25.89 μm luminosity in each bin. Lower panel: comparison between the observed [O iv]25.89 μm luminosities and the IR luminosities of local LIRGs. The solid line is the relation expected for purely star-forming galaxies derived by Pereira-Santaella et al. (2010b) (see the text for details), while the dotted lines are the ±1σ dispersion of the relation. The LIRG observations are color coded according to the AGN contribution to the integrated 24 μm emission: Ctot24 μm[AGN] > 0.5, Ctot24 μm[AGN] = 0.1–0.5, and Ctot24 μm[AGN] = 0.04–0.1, and the AGN non-detections, for which Ctot24 μm[AGN] ≲ 0.02–0.05.
Download figure:
Standard image High-resolution imageAs mentioned above the [O iv]25.89 μm line appears to be a good indicator of the AGN power. For those LIRGs with an AGN detection, we compare in Figure 4 Lbol(AGN) from the IRS spectral decomposition and the observed ![$L_{[{\rm O\,\mathsc{iv}}]}$](https://content.cld.iop.org/journals/0004-637X/744/1/2/revision1/apj406692ieqn5.gif) . The values for LIRGs with AGN detections are between those observed in Seyfert 1 and Seyfert 2 galaxies from the Revised Shapley-Ames (RSA) sample (Rigby et al. 2009), and thus consistent with the [O iv]25.89 μm emission being produced mostly by the AGN.
. The values for LIRGs with AGN detections are between those observed in Seyfert 1 and Seyfert 2 galaxies from the Revised Shapley-Ames (RSA) sample (Rigby et al. 2009), and thus consistent with the [O iv]25.89 μm emission being produced mostly by the AGN.

Figure 4. AGN bolometric luminosity (from the AGN+SB fit to the IRS spectral) vs. the observed [O iv]25.89 μm luminosity for those LIRGs with an AGN detection. The galaxies are color coded according to the AGN contribution to the integrated 24 μm emission as in Figure 3. The solid lines are the relations found for Seyfert 1 galaxies (top, and +1σ dispersion dashed line) and Seyfert 2 galaxies (bottom and −1σ dispersion) in the RSA sample (Rigby et al. 2009). The error bar on the upper left corner reflects the typical uncertainties in the derived AGN bolometric luminosities from the comparison in Section 5.2, and the typical uncertainty in the [O iv] fluxes (see Section 3.2).
Download figure:
Standard image High-resolution imageThe [O iv]25.89 μm line can also be produced by star formation if the AGN contribution to the total luminosity of the galaxy is below 5% (Pereira-Santaella et al. 2010b). This is indeed the case for non-AGN detections in our sample as we showed in Section 5.2. In Figure 3 (lower panel), we compare the observed [O iv]25.89 μm luminosities with those expected from pure star formation activity following Pereira-Santaella et al. (2010b). We used the typical [O iv]25.89 μm/[Ne ii]12.81 μm line ratios for high-metallicity SBs (Verma et al. 2003) and the empirical relation between the [Ne ii]12.81 μm luminosity and LIR (Ho & Keto 2007) to predict the [O iv]25.89 μm luminosity due to star formation. As can be seen from Figure 3, all the galaxies with no AGN component detected through the AGN+SB decomposition are consistent with pure star formation. On the other hand, all the galaxies but one with Ctot24 μm[AGN] > 0.1 are more than 1σ above the relation expected for star formation. Moreover, for all galaxies with ![$L_{[{\rm O\,\mathsc{iv}}]}\ge 10^7\,{L_\odot }$](https://content.cld.iop.org/journals/0004-637X/744/1/2/revision1/apj406692ieqn6.gif) , this emission line is mostly produced by the AGN, rather than by star formation.
, this emission line is mostly produced by the AGN, rather than by star formation.
5.4. The [O iv] 25.89 μm/[Ne ii] 12.81 versus EW(6.2 μm PAH) Diagram
Diagnostic diagrams comparing the [O iv]25.89 μm/[Ne ii]12.81 μm line ratio with the EW of one of the mid-IR PAH features are commonly used to assess the AGN contribution to the IR emission of galaxies (see, e.g., Genzel et al. 1998; Dale et al. 2006). In particular, this diagram has been used for ULIRGs (Farrah et al. 2007; Armus et al. 2007; Veilleux et al. 2009) and LIRGs (Petric et al. 2011). This is because the [Ne ii]12.81 μm line is expected to be produced mostly by star formation, while the [O iv]25.89 μm line tends to be more luminous in AGNs (Pereira-Santaella et al. 2010b). In this section we will assess if this diagram and the AGN fraction of the total 24 μm emission provide consistent results.
Figure 5 presents this diagram for our sample, where the galaxies have been color coded according to the AGN contribution at 24 μm. We also show in this diagram a mixing curve of pure star formation and pure AGN emission. For the pure AGN emission we used the median [O iv]25.89 μm/[Ne ii]12.81 μm line ratio for Seyfert galaxies 2.0 ± 1.2 (Pereira-Santaella et al. 2010b) and EW(6.2 μm PAH) = 0.1 μm. For the pure star formation we used the average value for high-metallicity SBs without AGN detections observed by the Infrared Space Observatory in the sample of Verma et al. (2003), [O iv]25.89 μm/[Ne ii]12.81 μm = 0.011. We also use the median value EW(6.2 μm PAH) = 0.54 ± 0.07 μm (see Table 4) of the H ii-like LIRGs with no AGN detection for the pure star formation value.

Figure 5. [O iv]25.89 μm/[Ne ii]12.81 μm line ratio vs. EW(6.2 μm PAH) diagram for our sample of LIRGs, which are color coded according to the AGN contribution to the integrated 24 μm emission, as in Figure 3. The solid line is a mixing curve between pure star formation and pure AGN emission (see the text for details), whereas the dotted lines represent the 1σ dispersion in the [O iv]25.89 μm/[Ne ii]12.81 μm line ratio for Seyfert galaxies and EW(6.2 μm PAH) feature for purely star-forming galaxies. The percentage numbers on the curves indicate the AGN contribution.
Download figure:
Standard image High-resolution imageIt is clear from Figure 5 that the AGN fractions derived from this diagram are entirely consistent with the AGN contribution to the total 24 μm emission. For instance, the three galaxies with Ctot24 μm[AGN] > 0.5 have [O iv]25.89 μm/[Ne ii]12.81 μm > 1 and small values of the EW, which correspond to >50% AGN fractions in the simplistic mixing curve plotted in this figure. Most LIRGs with Ctot24 μm[AGN] = 0.1–0.5 have [O iv]25.89 μm/[Ne ii]12.81 μm ratios consistent with AGN fractions of 5%–50%. Those LIRGs with small AGN contributions (Ctot24 μm[AGN] < 0.1) tend to have values of the line ratio and the EW consistent with those observed in nuclear and extra-nuclear star-forming regions (e.g., Dale et al. 2006). On the other hand, the observed value of EW(6.2 μm PAH) by itself is only found to be a good indicator of the nuclear activity when the AGN contribution is dominant Ctot24 μm[AGN] > 0.5. For intermediate AGN contributions there is a range of observed values of the EW of the 6.2 μm PAH feature, and thus deriving the AGN contribution is not so readily done.
5.5. The Spoon et al. (2007) Diagram
Spoon et al. (2007) put forward a diagram comparing the EW of the 6.2 μm PAH feature and the strength of the 9.7 μm silicate feature to provide a general classification of IR galaxies. This diagram has proven useful to assess the presence of an AGN not only for local galaxies but also for high-z IR bright galaxies (e.g., Farrah et al. 2008; Hernán-Caballero et al. 2009). Figure 6 shows the Spoon et al. diagram for our sample of LIRGs, where the galaxies are color coded according to the AGN contribution at 24 μm. Pereira-Santaella et al. (2010a) presented this diagram for the nuclei, integrated emission, and spatially resolved measurements of those LIRGs in our sample observed in spectral mapping mode.

Figure 6. Apparent strength of the silicate feature SSi vs. EW(6.2 μm PAH) for our LIRGs color coded as in Figure 3. If SSi is positive the silicate feature is in emission, and if SSi is negative the feature is in absorption. The regions shown in the diagram correspond to those defined by Spoon et al. (2007) for their sample of ULIRGs. Class 1A is occupied by unobscured AGNs, class 1C by starburst galaxies (i.e., PAH-dominated galaxies), and class 1B by composite (AGN/SB activity) galaxies. Classes 2A through 2C are moderately obscured galaxies with increasing EW(6.2 μm PAH). Classes 3A through 3C (not shown here) represent the most deeply embedded objects, although no ULIRGs are found in class 3C.
Download figure:
Standard image High-resolution imageOn the Spoon et al. diagram a large fraction (40%) of the LIRGs appear mostly concentrated in the region occupied by SB galaxies or class 1C. Approximately 25% are in class 1B, which is where composite (AGN/SB activity) galaxies are located. Only one LIRG is in the region of unobscured AGNs (Seyfert 1 galaxies and quasars) or class 1A, which typically tend to show low values of the EW of the PAH features (Roche et al. 1991; Rigopoulou et al. 1999; Buchanan et al. 2006; Tommasin et al. 2008). The rest of the sample, approximately 30%, lie in those regions occupied by moderately obscured nuclei (−2 < SSi < −0.8), classes 2B and 2C. Only one LIRG is in region 2A. There are no deeply embedded (SSi < −2) nuclei among the LIRGs in our sample. On this diagnostic diagram ULIRGs are mostly located along two branches. The first one is a horizontal branch that goes from class 1A to class 1C, and the second is a diagonal going from class 3A, which are deeply obscured nuclei (not shown here), to class 1C (see Spoon et al. 2007 for more details).
The Spoon et al. diagnostic diagram for LIRGs only provides a relatively good separation between AGN-dominated LIRGs, LIRGs with intermediate AGN contributions and LIRGs with very little or no AGN contribution. Only one of the galaxies dominated by the AGN emission (Ctot24 μm[AGN] > 0.5) appears in the 1A class, whereas the other two are in the composite region and in the 2A class. Most of those with intermediate AGN contributions (Ctot24 μm[AGN] = 0.1–0.5) are in the composite region, as expected. However, two of them appear in region 1C, which is that occupied by PAH-dominated galaxies. Those with little (Ctot24 μm[AGN] = 0.1–0.04) or no AGN contribution are mostly either in the 1C region (SB region), or near the border between class 2B and class 2C, and therefore are not easily identified as having an AGN from this diagram.
It is interesting to note here that the Nenkova et al. (2008a, 2008b) clumpy torus models never produce a very deep silicate feature (i.e., the models have SSi ≳ −1). This means that for deeply embedded galaxies the AGN templates used here (see the discussion by Levenson et al. 2007) may not be appropriate and an AGN component might be missed. For instance, two galaxies with relatively deep silicate features, IC 694 and MCG+02-20-003, are classified as LINER and composite, respectively, but an AGN component has not been detected through our spectral decomposition fit. However, it is important to note here that deeply embedded sources are rare among local LIRGs.
6. DISCUSSION
6.1. AGN Detection Rate in Local LIRGs
In this section, we summarize the results of Sections 4 and 5 in terms of the AGN detection rate in our complete volume-limited sample of local LIRGs and investigate any possible dependence with the IR luminosity. We also compare the AGN detection rate in LIRGs with other types of galaxies.
Out of the 50 galaxies with IRS spectroscopy, we detected an AGN component in 25 using the AGN+SB spectral decomposition (see Table 2, and Figures 1 and 10). An additional eight galaxies are classified spectroscopically as composite or LINER. Of these, one did not have IRS spectroscopy (the IRS spectrum of NGC 1614 was not well centered) and for the remaining seven the AGN was not detected based on our spectral decomposition (UGC 1845, MCG +02-20-003, IRAS 17138−1017, IC 694, NGC 5734, NGC 7591, Zw049.057). This brings the combined optical+IR AGN detection rate in the individual nuclei of our sample of LIRGs to ∼62%. In terms of the 45 IRAS systems, an AGN is found in 32, that is, ∼70%. This AGN detection rate is in good agreement with that derived from optical emission lines (Yuan et al. 2010) and X-ray emission (Risaliti et al. 2000; Pereira-Santaella et al. 2011).
Figure 7 shows the number of AGN detections for the individual nuclei of our sample of LIRGs in three IR luminosity bins. As can be seen from this figure, the AGN detection rate stays approximately constant at a ∼60%–65% rate for the three luminosity bins log (LIR/L☉) < 11, log (LIR/L☉) = 11–11.3, and log (LIR/L☉) = 11.3–11.7.
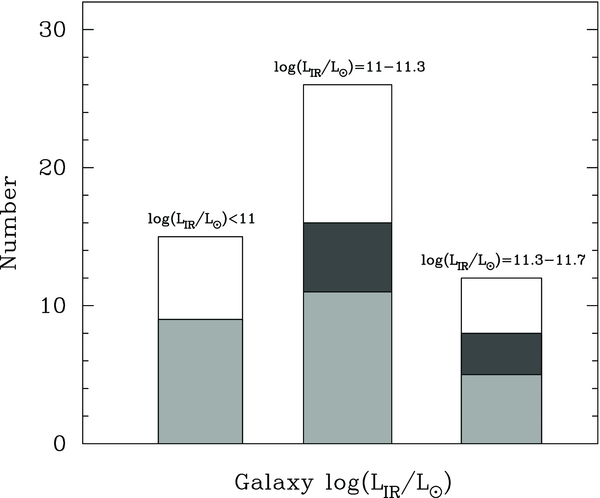
Figure 7. Number of AGN detections (shaded histograms) as a function of the IR luminosity of the galaxy for the 53 individual nuclei of our volume-limited sample of local LIRGs (open histograms). The galaxies have been divided into three luminosity bins. The light gray shaded histograms correspond to detections based on the IRS spectral decomposition, while the dark shaded histograms are LIRGs optically classified as AGNs but not detected from the AGN+SB decomposition.
Download figure:
Standard image High-resolution imagePetric et al. (2011) have conducted a study similar to ours using the GOALS sample of 248 LIRGs. They identified AGNs through [Ne v]14.32 μm detections in 18% of their sample, virtually identical to the 22% detection rate for us. They also detected [O iv]25.89 μm in 53% of their galaxies, whereas we detected it in 70% (see Section 5.3). They do not count the [O iv] detections as AGN, whereas we find that many of these galaxies do indeed harbor active nuclei (from the spectral decomposition and/or optical class, see Section 5.3). Petric et al. (2011) also used the EW of the 6.2 μm aromatic feature and the 5–15 μm continuum flux ratios as AGN indicators, and concluded that ∼10% of their sample are dominated by AGN in the mid-IR. We find that ∼6% (Table 4) of our sample have a mid-IR AGN contribution greater than 50% of the total luminosity at 24 μm. The difference may arise from slightly different methodologies, but both studies agree that the AGN plays a substantial role in the mid-IR energetics only in a relatively small minority of these galaxies. However, we also find that 50% of the galaxies in our sample contain AGNs, based on our mid-IR spectral decomposition method, and ∼60% if we combine optical and mid-IR indicators. Our ability to find many more AGNs than Petric et al. (2011) did in the larger but similar sample suggests that our spectral decomposition method is a powerful way to identify subtle AGN features. As a result, we can show that AGNs accompany star formation activity in a large proportion of local LIRGs, although in most cases the AGNs are not energetically important.
The AGN detection rate in local LIRGs is very similar to that of local ULIRGs. The latter is found to be 70% on average using mid-IR diagnostics (Imanishi et al. 2007; Nardini et al. 2010). In lower luminosity galaxies, AGNs are detected in much smaller fractions. For instance, in the optically selected RSA sample Maiolino & Rieke (1995) found a 5%–16% AGN incidence, based on optical indicators. The AGN fraction in nearby (d < 15 Mpc) moderately IR luminous galaxies (LIR ≳ 109 L☉) is slightly higher, 27%, when including [Ne v]14.32 μm detections, as demonstrated by Goulding & Alexander (2009).
6.2. AGN Bolometric Contribution in Local LIRGs
Although the combined optical+IR AGN detection rate in local LIRGs is relatively high, ∼62%, and only slightly less than in local ULIRGs, the important quantity is the AGN bolometric contribution to the IR luminosity of the galaxies. Using the AGN bolometric luminosities derived from the spectral decomposition (Section 5.2), we can derive the AGN bolometric contribution to the total IR luminosity of local LIRGs (both with and without AGN detections). We find that AGNs contribute 5+8−3% of the IR luminosity.10 The upper and lower limits take into account the uncertainties in the derived AGN bolometric luminosities. For the nine galaxies with an AGN optical classification but no AGN emission detected from the AGN+SB decomposition, we assumed the typical AGN bolometric luminosity of the composite sources (see Section 5.2). This estimate proves that the bulk of the IR luminosity of local LIRGs is due to star formation activity.
Our estimate of the AGN contribution to the total IR luminosity of LIRGs is in excellent agreement with that estimated from the X-ray properties of the representative sample studied by Pereira-Santaella et al. (2011). Petric et al. (2011) estimated that AGNs supply ∼12% of the total energy emitted by the GOALS LIRGs, which is compatible with our upper limit of the AGN contribution.
Taking the newly determined IR luminosity density produced by LIRGs in the local universe of ΩIR = 6 × 10⁶ L☉ Mpc−3 (Goto et al. 2011), we estimate that the AGN IR luminosity density in the LIRG luminosity range is ΩAGNIR = 3−2+5 × 10⁵ L☉ Mpc−3. Our estimate of the AGN IR luminosity density is about seven times lower than that of Goto et al. (2011), probably because these authors assumed that in those LIRGs classified as active galaxies and especially those classified as composite the IR luminosity is entirely due to the AGN.
Finally, we can also compare Ctot6 μm[AGN] and Ctot24 μm[AGN] with the AGN bolometric contribution to the IR luminosity of the galaxies (Figure 8). The relation between the AGN contribution in the mid-IR and the AGN bolometric contribution is slightly better at 24 μm than at 6 μm. As explained above, the IRAC 5.8 μm images of some LIRGs may include a sizable contribution from the 6.2 μm PAH feature, and/or the 6 μm emission of type 2 AGNs might not be fully isotropic. It can also be seen from Figure 8 that, although Ctot24 μm[AGN] and Lbol[AGN]/LIR do not follow a 1:1 relation, the relation is nearly linear. On average Ctot24 μm[AGN] = (2.9 ± 1.6) × Lbol[AGN]/LIR. We conclude that estimating the AGN fraction at 24 μm is a good proxy for the bolometric AGN contribution in LIRGs. Moreover, because the fractional AGN contribution is on average higher in the mid-IR than bolometrically, the mid-IR spectral range is very appropriate to study the fractional AGN/SB contribution. Wu et al. (2011) reached a similar conclusion for a sample of IR luminous galaxies at z ∼ 0.3.
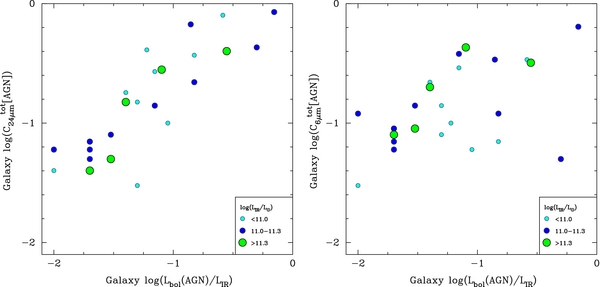
Figure 8. Left panel: comparison between the AGN fraction at 24 μm and the ratio of the AGN bolometric luminosity to the IR luminosity of the galaxy for our sample of local LIRGs. The symbols are size (and color) coded according to the IR luminosity of the galaxy. Right panel: a similar comparison but at 6 μm.
Download figure:
Standard image High-resolution image6.3. Comparison with Local ULIRGs and High-z IR Bright Galaxies
We summarize the AGN bolometric contribution for our sample of local LIRGs (with and without AGN detections) in Figure 9. We also compare in this figure our estimates for local LIRGs with those for local ULIRGs of Nardini et al. (2010). This comparison is meaningful because both our work and that of Nardini et al. quantify the AGN bolometric luminosities. In this figure, we separated the AGN bolometric contributions Lbol[AGN]/LIR in three ranges: <0.05, 0.05–0.25, > 0.25. In approximately one-third of local LIRGs the AGN bolometric contribution is mild, Lbol[AGN]/LIR ⩾ 0.05. Only ≃ 8% of local LIRGs have a significant AGN contribution, Lbol[AGN]/LIR > 0.25.

Figure 9. Summary of the fractional AGN bolometric contribution to the IR luminosity for the local sample of LIRGs and comparison with local ULIRGs from Nardini et al. (2010).
Download figure:
Standard image High-resolution imageIt is clear from Figure 9 that the fraction of galaxies with Lbol[AGN]/LIR > 0.05 increases at higher LIR, going from 30% in local LIRGs to ∼50% to ULIRGs with LIR < 3 × 10¹² L☉. However, it is only at LIR > 5 × 10¹² L☉ that the AGNs start dominating bolometrically the IR luminosity in a large fraction of local ULIRGs; 40% of ULIRGs in the high-luminosity bin in Figure 9 have Lbol[AGN]/LIR > 0.60 (see Figure 9 of Nardini et al. 2010).
In summary, in the local universe there is an increasing bolometric contribution from AGNs at higher IR luminosities, going from 5% in LIRGs to an average of 27% in ULIRGs (Nardini et al. 2010) and 35%–40% for the 1 Jy ULIRG sample (Veilleux et al. 2009).
While the trend for an increased AGN bolometric dominance at high IR luminosities is well established locally, at high-z it is still a matter of debate. For instance, Valiante et al. (2009) needed to introduce an evolution in the AGN contribution to model the submillimeter to mid-IR number counts and redshift distribution of high-z IR galaxies. In particular they found that at a given IR luminosity high-z IR galaxies needed a smaller AGN contribution than locally. This is in line with results of Fadda et al. (2010) using deep mid-IR spectroscopy of z ∼ 1 LIRGs and z ∼ 2 ULIRGs. In both populations the fraction of AGN-dominated sources is small, being ∼12% in ULIRGs and ∼5% in LIRGs. Also Wu et al. (2011) found no significant change in the overall star formation contribution to LIR from LIRGs to ULIRGs at z ∼ 0.3. However, other works found evidence for higher AGN contributions for the most IR luminous galaxies at high-z. Indeed, Menéndez-Delmestre et al. (2009) found that, although submillimeter galaxies are dominated by intense star formation, the average AGN bolometric contribution could be as high as 30%. Moreover, Rujopakarn et al. (2011) found a strict upper limit of ∼5 × 10¹²–1013 L☉ for the IR luminosity to be due to star formation in galaxies at all redshifts. Above that limit, AGNs are expected to provide the power.
7. CONCLUSIONS
We have decomposed the Spitzer/IRS ∼ 5–38 μm spectra of a complete volume-limited (d ∼ 40–78 Mpc) sample of local LIRGs into AGN and SB components. The main goal of this work is to quantify the AGN contribution to the mid-IR and IR emission of these systems. For the SB component we used SB and LIRG templates, whereas the AGN component was fitted with the Nenkova et al. (2008a, 2008b) clumpy torus models. We have also compared our mid-IR AGN detections with this method with other AGN indicators, including mid-IR spectral features, optical classification, and X-ray properties. Our main conclusions can be summarized as follows.
- 1.Using the AGN+SB spectral decomposition, we detected an AGN component in 25 out of the 50 individual LIRG nuclei with IRS spectroscopy. For an additional nine galaxies optically classified as composite (AGN/SB) we did not detect an AGN with our method. The combined optical and mid-IR AGN detection rate is ∼62% (33/53) for the individual nuclei of local LIRGs. This is in good agreement with the AGN detection rate obtained from optical spectroscopy, if composite objects do contain an AGN.
- 2.The AGN contribution to the mid-IR continuum emission within the IRS slits is small and decreases toward longer wavelengths. The median values range from CIRS6 μm[AGN] = 0.30, and CIRS24 μm[AGN] = 0.18 to CIRS30 μm[AGN] = 0.11.
- 3.We used IRAC 5.8 μm and MIPS 24 μm images to derive the AGN contribution to the total emission at these mid-infrared wavelengths. The median AGN contributions for those LIRGs with an AGN detection are Ctot6 μm[AGN] = 0.12 and Ctot24 μm[AGN] = 0.15, with only ∼6% (3/50) of local LIRGs having a dominant AGN contribution at 24 μm (Ctot24 μm[AGN] > 0.5).
- 4.We detected the [O iv]25.89 μm high-excitation emission line in 70% (35/50) of the individual LIRG nuclei. All the galaxies in our sample with
![$L_{[{\rm O\,\mathsc{iv}}]}\ge 10^7\,{L_\odot }$](data:image/png;base64,iVBORw0KGgoAAAANSUhEUgAAAAEAAAABCAQAAAC1HAwCAAAAC0lEQVR42mNkYAAAAAYAAjCB0C8AAAAASUVORK5CYII=) contain an AGN and these luminosities are consistent with those expected from their derived AGN bolometric luminosities. On the other hand, the [O iv]25.89 μm luminosities of those galaxies without an AGN detection can be explained as produced by star formation activity.
contain an AGN and these luminosities are consistent with those expected from their derived AGN bolometric luminosities. On the other hand, the [O iv]25.89 μm luminosities of those galaxies without an AGN detection can be explained as produced by star formation activity. - 5.When compared with other mid-IR spectral AGN diagnostics, we found that our 24 μm AGN fractional components are consistent with those derived from the [O iv]/[Ne ii] versus EW(6.2 μm PAH) diagram. Using the Spoon et al. diagram we can identify the presence of an AGN when Ctot24 μm[AGN] ≳ 0.1.
- 6.From the scaling of the fitted torus models to the AGN component of the IRS spectra, we derived AGN bolometric luminosities in the range Lbol(AGN) = (0.4–50) × 1043 erg s−1 with a median value of Lbol(AGN) = 2 × 1043 erg s−1. These are in a fairly good agreement with those estimated from hard X-ray measurements after applying a bolometric correction.
- 7.One-third of local LIRGs have Lbol[AGN]/LIR ⩾ 0.05, with only ≃ 8% having a significant AGN contribution Lbol[AGN]/LIR > 0.25. This is in contrast with the ∼20% of local ULIRGs with LIR < 3 × 10¹² L☉ and the ∼60% of ULIRGs with LIR > 3 × 10¹² L☉ having Lbol[AGN]/LIR > 0.25, respectively.
- 8.Adding up the AGN bolometric luminosities in our sample, we find that AGNs are only responsible for 5+8−3% of the total IR luminosity produced by local LIRGs. This translates into an AGN IR luminosity density of ΩAGNIR = 3−2+5 × 10⁵ L☉ Mpc−3 in local LIRGs. Our results prove that the bulk of the IR luminosity of local LIRGs is due to star formation activity.
![$L_{[{\rm O\,\mathsc{iv}}]}\ge 10^7\,{L_\odot }$](https://content.cld.iop.org/journals/0004-637X/744/1/2/revision1/apj406692ieqn7.gif)
In summary, mid-IR spectral decomposition is a powerful tool for estimating the AGN contribution to both the mid-IR emission and the total emission of IR-selected sources. This is because not only are we able to identify all Seyfert-like AGNs in local LIRGs but also because this technique is powerful enough to identify subtle AGN features (i.e., low-luminosity AGN) that might be missed by other mid-IR methods. As a result, we have shown that AGNs accompany star formation activity in the large majority of local LIRGs, although in most cases the AGNs are not energetically important.
We thank Emanuele Nardini, Guido Risaliti, and Jane Rigby for sharing some of their results with us. We are very grateful to Moshe Elitzur for the CLUMPY torus models and to Andrés Asensio Ramos and Cristina Ramos Almeida for their continuing work in developing the BayesClumpy fitting tool. We thank Cristina Ramos Almeida and Pilar Esquej for a careful reading of the manuscript and for their suggestions. A.A.-H. is grateful to the Astrophysics Department, Oxford University, where part of this research was conducted, for their hospitality. We thank the referee for useful suggestions and comments.
A.A.-H. and M.P.-S. acknowledge support from the Spanish Plan Nacional de Astronomía y Astrofísica under grants AYA2009-05705-E and AYA2010-21161-C02-1. M.P.-S. acknowledges support from the CSIC under grant JAE-Predoc-2007.
This research has made use of the NASA/IPAC Extragalactic Database (NED) which is operated by the Jet Propulsion Laboratory, California Institute of Technology, under contract with the National Aeronautics and Space Administration.
APPENDIX
A.1. The CLUMPY Torus Models
We used the CLUMPY models (Nenkova et al. 2008a, 2008b) to represent the AGN continuum emission in the mid-IR. These models are described by six parameters that deal with the torus geometry and cloud properties. These are (1) the radial thickness of the torus Y = Ro/Rd, where Ro and Rd are the outer and inner radii of the torus, respectively; the inner radius of the torus in these models is set by the dust sublimation temperature, which is assumed to be Tsub ≈ 1500 K; (2) the angular distribution of the clouds, which is assumed to have a smooth boundary, is described as a Gaussian with a width parameter σtorus; (3) the radial distribution of the clouds, which is described as a declining power law with index q (∝r−q); (4) the mean number of clouds along a radial equatorial ray N0; (5) the optical depth of the clouds τV; and (6) the viewing angle to the torus, i. In the models the radiative transfer equations are solved for each clump and thus the solutions depend mainly on the location of each clump within the torus, its optical depth, and the chosen dust composition. For the fits done in this work we adopted a dust extinction profile corresponding to a standard cold oxygen-rich interstellar medium dust (Ossenkopf et al. 1992). The total torus emission is calculated by integrating the source function of the total number of clumps convolved with the radiation propagation probability along the torus (Nenkova et al. 2002). For unobscured views of the AGN, it is also possible to include its contribution to the resulting IR emission. The AGN continuum emission in these models is characterized with a piecewise power-law distribution (see Nenkova et al. 2008a for details). In addition to the six torus model parameters, there is an extra parameter to account for the vertical displacement needed to match the fluxes of a given model to the observations. This vertical shift, which we allow to vary freely, scales with the AGN bolometric luminosity (see Nenkova et al. 2008b).
Given the large number of CLUMPY models (currently more than 106) and the inherent degeneracy in the torus model parameters, Asensio Ramos & Ramos Almeida (2009) took a Bayesian approach to fit models to the data and to derive meaningful confidence levels for the fitted parameters. To this end, they developed a tool called BayesClumpy that allows fitting both photometric points and/or mid-IR spectra. For the Bayesian inference of BayesClumpy we used an interpolated version of the CLUMPY dusty torus models. We refer the reader to Asensio Ramos & Ramos Almeida (2009) for details on the interpolation methods and algorithms used by BayesClumpy to perform the torus model fits to the data.
A.2. AGN+SB Spectral Decomposition Fits
We used an iterative method to perform the AGN+SB decomposition. In the first step we started by using only two AGN templates given the large number of CLUMPY torus models and their degeneracy (see Ramos Almeida et al. 2009, 2011; Asensio Ramos & Ramos Almeida 2009 for detailed discussions on this issue). We used the best-fit CLUMPY torus model of the average spectral energy distributions of Seyfert 1 galaxies and Seyfert 2 galaxies inferred by Ramos Almeida et al. (2011). We obtained the best fit to the IRS spectra for each LIRG in our sample with this initial combination of AGN+SB templates. We next subtracted the SB component from the original IRS spectrum to obtain the AGN-only mid-IR spectrum. This AGN-only spectrum was then fitted with the BayesClumpy routine (Asensio Ramos & Ramos Almeida 2009) to infer the best-fit torus model and the corresponding scaling for each galaxy. We finally refitted the observed IRS spectrum of the LIRG using its corresponding best-fit torus model, allowing for rescaling, and the appropriate SB template that minimized χ2. The fits were done in the 6–30 μm spectral range to avoid the edges of the spectra and the slightly decreased signal-to-noise ratio of some of the spectra observed in mapping mode at λ > 30 μm. We note, however, that the fits tend to be good also at λ > 30 μm. We considered an AGN detection when its contribution was greater than 5%–7% at 20 μm. Below this limit we were not able to fit the AGN-only spectra with BayesClumpy. This is because after subtracting the SB template in these cases a large proportion of the data points were close to zero or even negative. For each fit the formal errors of the AGN fractional contribution within the IRS slit were calculated using the observational errors of the IRS spectra and the covariance matrix. The typical errors of the AGN fractional contribution within the IRS slit at 6 μm are 0.01–0.03. If the models fit the data, as is the case for most galaxies, these can be taken as the typical uncertainties of the AGN fractional contributions. This is because the variation of the fitted parameters is compatible with the data observational errors. The uncertainties associated with the use of different SB templates are discussed briefly in Section 4.1.
We present the best AGN+SB fits for all the LIRGs in our sample in Figures 1, 10, and 11. As can be seen from Figure 11 a few LIRGs deemed not to have a mid-IR AGN detection have a best fit requiring a small AGN contribution. These are NGC 5734, which is optically classified as composite, and ESO 221−G010 and IC 4734, which are classified as H ii (see Table 1). The AGN fraction at 20 μm for all of them was, however, below the imposed limit. In these cases we were not able to fit the AGN-only emission with the torus models, and the AGN template corresponds to the Seyfert 2 template used in the first step of the iteration.
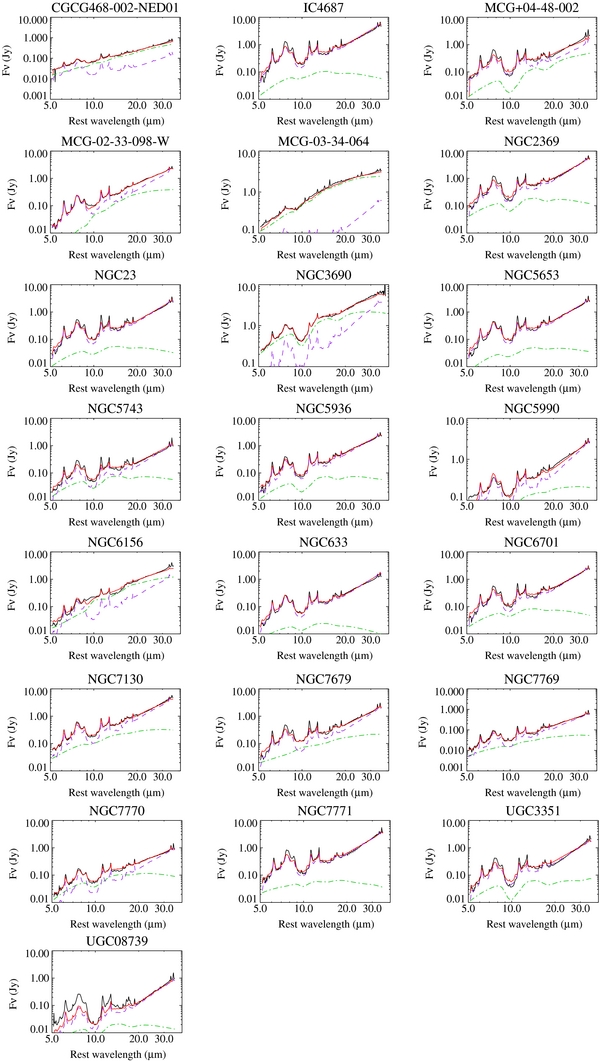
Figure 10. AGN+SB decomposition fits for those LIRGs with a mid-IR AGN detection. Lines are as in Figure 1.
Download figure:
Standard image High-resolution image
Download figure:
Standard image High-resolution image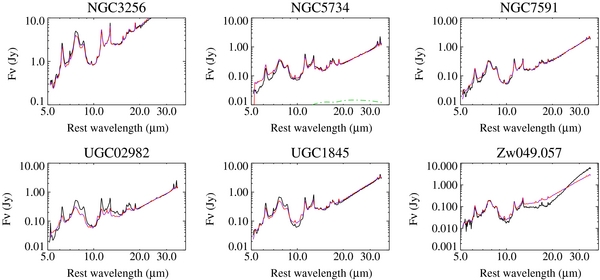
Figure 11. AGN+SB decomposition fits for those LIRGs without a mid-IR AGN detection. Lines are as in Figure 1.
Download figure:
Standard image High-resolution image
Footnotes
- *
This work is based on observations made with the Spitzer Space Telescope, which is operated by the Jet Propulsion Laboratory, California Institute of Technology under NASA contract 1407.
- 6
IC 4686 and NGC 6921 were not observed, and the slit was not properly centered on the nuclear region of NGC 1614.
- 7
The IRSCLEAN package is available at http://irsa.ipac.caltech.edu/data/SPITZER/docs/dataanalysistools/tools/irsclean/.
- 8
- 9
The GOALS sample contains a total of 248 individual LIRG nuclei in the IRAS RBGS, and thus our sample is part of it.
- 10
Strictly speaking, this is just an upper limit to the AGN contribution because we are assuming that in LIRGs Lbol(AGN) ≃ LIR(AGN).