


ABSTRACT
We obtained Spitzer Space Telescope Multiband Imaging Photometer for Spitzer (MIPS) 24 μm and 70 μm observations of 182 nearby, Hipparcos F- and G-type common proper motion single and binary systems in the nearest OB association, Scorpius-Centaurus. We also obtained Magellan/MIKE R ∼ 50,000 visual spectra at 3500–10500 Å for 181 candidate ScoCen stars in single and binary systems. Combining our MIPS observations with those of other ScoCen stars in the literature, we estimate 24 μm F+G-type disk fractions of 9/27 (33% ± 11%), 21/67 (31% ± 7%), and 25/71 (35% ± 7%) for Upper Scorpius (∼10 Myr), Upper Centaurus Lupus (∼15 Myr), and Lower Centaurus Crux (∼17 Myr), respectively. We confirm previous IRAS and MIPS excess detections and present new discoveries of 41 protoplanetary and debris disk systems, with fractional infrared luminosities ranging from LIR/L* = 10−5 to 10−2 and grain temperatures ranging from Tgr = 40–300 K. We searched for an increase in 24 μm excess at an age of 15–20 Myr, consistent with the onset of debris production predicted by coagulation N-body simulations of outer planetary systems. We found such an increase around 1.5 M☉ stars but discovered a decrease in the 24 μm excess around 1.0 M☉ stars. We additionally discovered that the 24 μm excess around 1.0 M☉ stars is larger than predicted by self-stirred models. Finally, we found a weak anti-correlation between fractional infrared luminosity (LIR/L*) and chromospheric activity (R'HK), that may be the result of differences in stellar properties, such as mass, luminosity, and/or winds.
Export citation and abstract BibTeX RIS
1. INTRODUCTION
Planets are believed to form in circumstellar disks of gas and dust. Recent high contrast imaging has revealed the presence of a 9 ± 3 MJup planet in the dusty, debris disk around β Pic at 8–13 AU from the central star, suggesting that giant planets may form at ages as young as ∼12 Myr (Lagrange et al. 2010). Although planets have not been widely detected in young debris disks (with ages 5–100 Myr), coronagraphic imaging has revealed the presence of structures, such as brightness peaks, asymmetries, and warps, that indicate that planets may have formed or may be forming (Wyatt 2008). Since debris disks are expected to be common around stars with ages ∼10–20 Myr, many Spitzer Multiband Imaging Photometer for Spitzer (MIPS) photometric surveys (e.g., Rebull et al. 2008; Low et al. 2005) have been carried out to search for infrared excess around stars in nearby (<75 pc from the Sun) moving groups with ages <100 Myr (e.g., the ∼10 Myr old TW Hya association, ∼12 Myr old β Pic moving group, etc.). Observations of stars in nearby, star-forming regions are needed to improve statistics.
Numerical coagulation N-body models have been developed to describe the formation of oligarchs (1000 km radius planetary embryos) in outer planetary systems and the destruction of planetesimals by collisions in circumstellar disks (e.g., Kenyon & Bromley 2005, 2008). These models assume that disks initially possess (1) planetesimals (with radii between 1 m and 1 km) at 30–150 AU from the central star and (2) gas that maintains circular orbits and low relative velocities between small bodies, leading to constructive collisions that build successively larger planetesimals. They predict that large bodies continue to grow until they reach a radius of ∼1000 km (at an age of ∼104 years) and are massive enough to gravitationally perturb smaller objects (with radii 0.1–10 km) into crossing orbits, generating debris dust that can be detected via thermal emission. The models are able to reproduce the general amplitude and evolution of 24 μm excess around A-type stars at ages >20 Myr (Su et al. 2006); however, they may or may not correctly describe the production of debris dust at younger ages. In particular, the Kenyon & Bromley (2005, 2008) models predict a peak in 24 μm excess at an age of ∼10–20 Myr.
The Scorpius-Centaurus OB association (ScoCen), with typical stellar distances of ∼100–200 pc, is the closest OB association to the Sun and contains three subgroups: Upper Scorpius (US), Upper Centaurus Lupus (UCL), and Lower Centaurus Crux (LCC), with estimated ages of ∼10 Myr (Pecaut et al. 2011), ∼15 Myr, and ∼17 Myr (Mamajek et al. 2002), respectively. The close proximity of ScoCen and the age of its constituent stars make this association an excellent laboratory for studying the formation and evolution of planetary systems. Several hundred candidate members have been identified to date; although, the association probably contains thousands of low-mass members. Member stars with spectral type F and earlier have been identified using moving group analysis of Hipparcos positions, parallaxes, and proper motions (de Zeeuw et al. 1999), while later type members have been identified using youth indicators (i.e., high coronal X-ray activity and large lithium abundance; Preibisch & Mamajek 2008; Slesnick et al. 2006). Demographic studies of infrared excess in ScoCen, combined with demographic studies of other young clusters, is expected to provide constraints on debris production in young debris disk systems and input into self-stirred disk models.
We report the results of a Spitzer MIPS 24 μm and 70 μm survey of 182 F- and G-type Hipparcos common proper motion members of ScoCen, building on our initial results (Chen et al. 2005). Our previous study included preliminary MIPS 24 and 70 μm photometry of 41 candidate ScoCen single and binary systems. The current study has been expanded to include (1) Magellan/Magellan Inamori Kyocera Echelle (MIKE) stellar radial and rotational velocity, lithium equivalent width, and Ca ii activity measurements for 181 candidate ScoCen members, (2) membership analysis for the F- and G-type candidate ScoCen members in the de Zeeuw et al. (1999) sample, and (3) new MIPS 24 μm and 70 μm observations of 142 candidate ScoCen single and binary systems. We re-examine membership using Li abundance to determine stellar youth and convergent point analysis to determine whether stellar luminosity, radial velocity, and proper motion are consistent with ScoCen membership. Refinements in the calibration of the MIPS data have allowed us to improve the accuracy of the measured fluxes; therefore, we rereduce and reanalyze the complete sample. We list the targets for the full sample, along with their spectral types, distances, and subgroup memberships in Table 1.
Table 1. Stellar Properties
| HIP | Spectral | Distance | Av | Li | L* | RV | PM | Final | Subgroup | vrad | ROSAT | Fx | EW(Li) | vsin i | log R'HK |
|---|---|---|---|---|---|---|---|---|---|---|---|---|---|---|---|
| Type | (pc) | (mag) | (km s−1) | (counts s−1) | (erg s−1 cm−1) | (mÅ) | (km s−1) | ||||||||
| 55334 | F2V (4) | 86+4−4 | 0.11 ± 0.01 | Y | Y | Y? | Y? | Y? | LCC | 21.3 ± 0.9 | 0.092 | 6.4 × 10⁶ | 18 ± 4 | 106 ± 6 | −4.54 |
| 56227 | F0III (4) | 118+8−7 | 0.00 ± 0.04 | Y | Y | Y? | Y? | Y? | LCC | 7.8 ± 0.7 | ... | <5.6 × 10⁶ | 70 ± 4 | 79 ± 6 | −4.64 |
| 56420 | Gwl (12) | 176+213−62 | ... | N | Y | Y | Y | N | ... | 12.6 ± 0.3 | ... | <3.2 × 10⁷ | 101 ± 6 | 10 ± 1 | −5.43 |
| 56673** | F5IV (4) | 94+5−4 | 0.12 ± 0.04 | Y | Y | Y? | Y? | Y? | LCC | 19.7 ± 0.6 | 0.492 | 7.4 × 10⁶ | 114 ± 3 | 152 ± 11 | −4.16 |
| 56814 | K2/3IIICNII (5) | 144+17−14 | 0.61 ± 0.32 | N | N | Y | Y | N | ... | −17.4 ± 0.3 | ... | <1.3 × 10⁵ | 45 ± 5 | 10 ± 1 | −5.57 |
| 57524†, ** | F9IV (8) | 92+12−10 | 0.13 ± 0.04 | Y | Y | Y | Y | Y | LCC | 12.0 ± 0.3 | 0.535 | 4.7 × 10⁷ | 171 ± 4 | 31 ± 2 | −4.01‡ |
| 57595 | F5V (4) | 283+370−102 | 0.00 ± 0.03 | Y? | Y | Y | Y | Y? | LCC | 8.3 ± 0.1 | ... | <9.0 × 10⁶ | <13 | 19 ± 2 | −4.78 |
| 57950 | F2IV/V (4) | 98+8−7 | 0.00 ± 0.02 | Y | Y | Y | Y | Y | LCC | 14.2 ± 0.3 | 0.07 | 6.8 × 10⁶ | 51 ± 3 | 57 ± 4 | −4.54 |
| 58075 | F2V (11) | 182+48−31 | 0.12 ± 0.03 | Y | Y | Y | Y | Y | LCC | 16.5 ± 0.1 | ... | <7.6 × 10⁶ | 75 ± 6 | 13 ± 1 | −4.43 |
| 58146 | F2IV V (4) | 117+7−6 | 0.00 ± 0.04 | Y | Y | Y | Y | Y | LCC | 6.8 ± 0.8 | ... | <2.7 × 10⁶ | 134 ± 4 | 126 ± 8 | −4.53 |
| 58167 | F3IV (4) | 93+9−7 | 0.08 ± 0.02 | Y? | Y | Y? | Y? | Y? | LCC | 21.3 ± 2.0 | 0.04 | 4.1 × 10⁶ | <14 | 180 ± 10 | −4.45 |
| 58220 | F3V (4) | 99+9−8 | 0.00 ± 0.06 | Y | Y | Y | Y | Y | LCC | 15.4 ± 0.3 | ... | <4.3 × 10⁶ | 62 ± 5 | 66 ± 6 | −4.61 |
| 58528 | F5V (4) | 110+13−11 | 0.00 ± 0.06 | Y | Y | Y | Y | Y | LCC | 13.5 ± 0.3 | 0.041 | 2.5 × 10⁶ | 70 ± 5 | 36 ± 2 | −4.74 |
| 58899 | F3V (5) | 116+16−13 | 0.01 ± 0.02 | Y | Y | Y | Y | Y | LCC | 13.6 ± 0.3 | ... | <4.4 × 10⁶ | 93 ± 3 | 18 ± 2 | −4.87 |
| 58921** | M2III (4) | 210+17−14 | 0.33 ± 0.18 | Y | N | Y? | Y? | N | ... | 1.0 ± 0.2 | ... | <4.1 × 10³ | 69 ± 7 | 10 ± 1 | −5.49‡ |
| 58996** | G2IV (13) | 110+14−11 | 0.08 ± 0.05 | Y | Y | Y | Y | Y | LCC | 12.5 ± 0.3 | 0.219 | 2.0 × 10⁷ | 213 ± 7 | 35 ± 2 | −4.11‡ |
| 59084 | F0V (4) | 140+18−14 | 0.00 ± 0.22 | Y | Y | Y? | Y? | Y? | LCC | −10.8 ± 0.9 | ... | <6.6 × 10⁶ | 25 ± 3 | 98 ± 9 | −4.58 |
| 59481** | F3V (5) | 113+14−11 | 0.00 ± 0.04 | Y | Y | Y | Y | Y | LCC | 12.2 ± 1.2 | ... | <4.7 × 10⁶ | 54 ± 3 | 93 ± 5 | −4.6 |
| 59603 | F2V (4) | 104+12−10 | 0.00 ± 0.02 | Y | Y | Y? | Y? | Y? | LCC | 19.3 ± 0.7 | 0.03 | 4.6 × 10⁶ | 45 ± 3 | 137 ± 9 | −4.4 |
| 59693 | F6IV (5) | 137+30−21 | 0.10 ± 0.04 | Y | Y | Y | Y | Y | LCC | 15.3 ± 0.3 | ... | <9.8 × 10⁶ | 80 ± 5 | 10 ± 1 | −4.80‡ |
| 59716 | F5V (4) | 97+14−11 | 0.03 ± 0.02 | Y | Y | Y | Y | Y | LCC | 15.5 ± 1.1 | 0.565 | 5.2 × 10⁷ | 107 ± 6 | 96 ± 8 | −4.36 |
| 59764 | G1V (13) | 129+13−11 | 0.21 ± 0.06 | Y | Y | Y | Y | Y | LCC | 14.0 ± 0.4 | 0.385 | 2.6 × 10⁷ | 176 ± 9 | 83 ± 8 | −4.09‡ |
| 59781† | F7V (13) | 82+9−8 | 0.04 ± 0.04 | ... | Y | Y | Y | Y | LCC | ... | 0.065 | 7.0 × 10⁶ | ... | ... | ... |
| 59854†, ** | G1IV (8) | 108+20−14 | 0.24 ± 0.10 | Y | Y | Y | Y | Y | LCC | 14.4 ± 0.3 | 0.362 | 4.4 × 10⁷ | 181 ± 5 | 27 ± 2 | −4.07‡ |
| 59960 | F5V (4) | 92+6−6 | 0.00 ± 0.02 | Y | Y | Y | Y | Y | LCC | 15.1 ± 0.3 | ... | <2.1 × 10⁶ | 84 ± 3 | 55 ± 4 | −4.64 |
| 60205 | F7V (10) | 170+84−42 | 0.00 ± 0.02 | Y | Y | Y | Y? | Y? | LCC | 15.4 ± 0.4 | 0.029 | 9.5 × 10⁶ | 99 ± 4 | 29 ± 2 | −4.57‡ |
| 60245 | F2V (5) | 141+22−17 | 0.09 ± 0.02 | Y? | Y | Y? | Y | Y? | LCC | −3.0 ± 0.3 | 0.046 | <7.8 × 10⁶ | <9 | 35 ± 3 | −4.71 |
| 60348** | F5V (5) | 94+18−13 | 0.00 ± 0.06 | ... | Y | Y | Y | Y | LCC | 12.5 ± 0.4 | 0.041 | 6.0 × 10⁶ | ... | 72 ± 4 | −4.5 |
| 60513 | F3V (4) | 100+9−8 | 0.00 ± 0.01 | Y? | Y | Y? | Y? | Y? | LCC | 22.6 ± 0.5 | ... | <4.5 × 10⁶ | <11 | 133 ± 10 | −4.49 |
| 60567 | F6/7V (5) | 503+∞−256 | 0.03 ± 0.04 | Y | Y | Y | Y | Y | LCC | 7.7 ± 0.6 | 0.057 | 1.5 × 10⁷ | 139 ± 6 | 67 ± 5 | −4.25‡ |
| 60885** | G0IV (8) | 135+22−17 | 0.14 ± 0.04 | Y | Y | Y | Y | Y | LCC | 14.2 ± 0.4 | 0.168 | 1.4 × 10⁷ | 154 ± 4 | 56 ± 4 | −4.21‡ |
| 60913** | G4.5IV (8) | 99+10−9 | 0.34 ± 0.11 | Y | Y | Y | Y | Y | LCC | 14.0 ± 0.4 | 0.042 | 2.4 × 10⁶ | 184 ± 6 | 15 ± 2 | −4.49‡ |
| 61049 | F7V (4) | 97+10−8 | 0.08 ± 0.13 | Y | Y | Y | Y | Y | LCC | 5.0 ± 0.1 | ... | <3.4 × 10⁶ | 112 ± 7 | 8 ± 1 | −4.92 |
| 61086 | F1V (10) | 164+125−49 | 0.14 ± 0.09 | Y | Y | Y | Y | Y | LCC | −1.6 ± 0.2 | ... | <3.5 × 10⁷ | 41 ± 4 | 38 ± 3 | −4.68 |
| 61087 | F6V (4) | 97+7−6 | 0.04 ± 0.01 | Y | Y | Y | Y | Y | LCC | 17.8 ± 0.6 | ... | <2.3 × 10⁶ | 109 ± 6 | 64 ± 5 | −4.46 |
| 61241 | G0 (11) | 137+57−31 | 0.17 ± 0.09 | Y | Y | Y | Y | Y | LCC | 13.1 ± 0.3 | ... | <1.1 × 10⁷ | 160 ± 5 | 17 ± 1 | −4.29‡ |
| 61248† | G8III (5) | 212+44−31 | 0.59 ± 0.12 | N | N | Y? | Y | N | ... | 4.2 ± 0.2 | ... | <3.8 × 10⁵ | 30 ± 3 | 10 ± 1 | −5.02 |
| 62032 | F0V (5) | 141+34−23 | 0.11 ± 0.02 | Y | Y | Y | Y | Y | LCC | 12.7 ± 1.2 | ... | <8.0 × 10⁶ | 20 ± 3 | 73 ± 5 | −4.65 |
| 62056 | F6V (10) | 167+105−46 | 0.11 ± 0.03 | Y | Y | Y | Y | Y | LCC | 16.6 ± 0.2 | ... | <2.1 × 10⁷ | 45 ± 4 | 10 ± 1 | −5.04 |
| 62134 | F2V (5) | 116+16−13 | 0.03 ± 0.06 | Y | Y | Y? | Y? | Y? | LCC | 23.8 ± 0.7 | ... | <5.8 × 10⁶ | 60 ± 3 | 140 ± 9 | −4.5 |
| 62171 | F3V (4) | 114+20−15 | 0.09 ± 0.03 | Y | Y | Y | Y | Y | LCC | 13.6 ± 0.3 | 0.026 | 3.7 × 10⁶ | 95 ± 7 | 40 ± 2 | −4.8 |
| 62427 | F8 (2) | 143+30−21 | 0.00 ± 0.03 | Y | Y | Y | Y | Y | LCC | 13.7 ± 0.3 | 0.145 | 2.6 × 10⁷ | 85 ± 8 | 34 ± 3 | −4.66 |
| 62428 | F0III (4) | 124+9−8 | 0.16 ± 0.02 | Y | N? | Y | Y | N? | ... | 11.4 ± 0.3 | ... | <1.9 × 10⁶ | 43 ± 5 | 16 ± 1 | −4.6 |
| 62431† | F0 (2) | 132+21−16 | 0.13 ± 0.06 | Y | Y | Y | Y | Y | LCC | 15.9 ± 0.3 | 0.145 | 1.1 × 10⁷ | 60 ± 3 | 34 ± 3 | −4.65 |
| 62657 | F5/6V (5) | 109+14−11 | 0.05 ± 0.05 | Y | Y | Y | Y | Y | LCC | 10.9 ± 0.3 | 0.042 | 5.0 × 10⁶ | 76 ± 5 | 42 ± 3 | −4.6 |
| 62674 | F3V (10) | 262+228−83 | 0.00 ± 0.03 | Y? | Y | Y | Y | Y? | LCC | −9.1 ± 0.4 | ... | <2.5 × 10⁷ | <12 | 57 ± 4 | −4.61 |
| 62677† | F0/2V: (4) | 186+150−57 | 0.17 ± 0.04 | Y | Y | Y? | Y | Y? | LCC | −17.4 ± 0.5 | ... | <7.5 × 10⁶ | 80 ± 7 | 66 ± 6 | −4.53 |
| 63022 | F0V (5) | 194+74−42 | 0.19 ± 0.05 | Y | Y | Y | Y | Y | LCC | −8.2 ± 0.2 | ... | <1.7 × 10⁷ | 40 ± 4 | 18 ± 2 | −4.65 |
| 63041 | F0V (4) | 103+9−8 | 0.07 ± 0.01 | Y | Y | Y | Y | Y | LCC | 28.9 ± 3.1 | ... | <3.6 × 10⁶ | 46 ± 4 | 83 ± 5 | −4.49 |
| 63272 | F3IV/V (5) | 105+11−9 | 0.04 ± 0.05 | Y | Y | Y | Y | Y | LCC | 11.4 ± 0.4 | 0.027 | 3.5 × 10⁶ | 37 ± 8 | 59 ± 6 | −4.67 |
| 63435 | F5V (5) | 151+33−23 | 0.01 ± 0.04 | Y? | Y | Y | Y | Y? | LCC | −1.5 ± 0.1 | ... | <7.1 × 10⁶ | <11 | 10 ± 1 | −4.68 |
| 63439 | F3/5IV/V (5) | 143+26−19 | 0.00 ± 0.02 | Y | Y | Y? | Y? | Y? | LCC | 15.7 ± 0.6 | ... | <7.9 × 10⁶ | 28 ± 4 | 82 ± 5 | −4.72 |
| 63527 | F0/2V (5) | 157+22−17 | 0.06 ± 0.04 | Y | Y | Y | Y | Y | LCC | 14.4 ± 0.7 | ... | <2.9 × 10⁶ | <11 | 190 ± 14 | −4.59 |
| 63797 | G3.5IV (8) | 93+9−7 | 0.23 ± 0.06 | N | Y | Y? | Y? | N | ... | 39.8 ± 0.3 | ... | <2.0 × 10⁶ | 13 ± 4 | 10 ± 1 | −5.28 |
| 63836 | F6/8 (5) | 107+15−11 | 0.00 ± 0.04 | Y | Y | Y | Y | Y | LCC | 9.0 ± 0.6 | ... | <5.9 × 10⁶ | 97 ± 7 | 101 ± 8 | −4.37 |
| 63847 | G3IV (8) | 120+18−14 | 0.22 ± 0.09 | Y | Y | Y | Y | Y | LCC | 11.8 ± 0.3 | ... | <3.7 × 10⁶ | 241 ± 8 | 33 ± 3 | −3.97‡ |
| 63886 | F2V (4) | 107+13−10 | 0.00 ± 0.04 | Y | Y | Y | Y | Y | LCC | 12.3 ± 0.3 | ... | <3.5 × 10⁶ | 56 ± 5 | 49 ± 3 | −4.77 |
| 63962 | G0V (4) | 236+105−55 | 0.12 ± 0.05 | N | Y | Y | Y | N | ... | 12.6 ± 0.2 | ... | <5.7 × 10⁶ | <9 | 16 ± 1 | −5.02 |
| 63975A | F3/5V (5) | 123+17−13 | 0.04 ± 0.04 | Y | Y | Y | Y | Y | LCC | 5.2 ± 0.4 | 0.034 | 9.2 × 10⁵ | 25 ± 4 | 83 ± 6 | −4.62 |
| 63975B | F6V (14) | ... | ... | ... | ... | ... | ... | ... | ... | 13.2 ± 1.0 | ... | ... | 72 ± 5 | 93 ± 7 | −4.57 |
| 64044 | F5V (5) | 112+17−13 | 0.10 ± 0.02 | Y | Y | Y | Y | Y | LCC | 12.6 ± 0.7 | 0.126 | 1.5 × 10⁷ | 132 ± 4 | 93 ± 7 | −4.23‡ |
| 64184 | F3V (4) | 85+6−5 | 0.00 ± 0.07 | Y | Y | Y | Y | Y | LCC | 10.2 ± 0.3 | ... | <3.3 × 10⁶ | 84 ± 4 | 43 ± 3 | −4.72 |
| 64216 | K0III (5) | 202+43−30 | 0.59 ± 0.14 | N | N | Y | Y | N | ... | −11.4 ± 0.1 | ... | <3.7 × 10⁵ | 44 ± 3 | 11 ± 1 | −5.32 |
| 64316 | F3V (10) | 188+112−51 | 0.18 ± 0.04 | Y | Y | Y | Y | Y | LCC | 6.1 ± 0.3 | 0.011 | 1.6 × 10⁶ | 76 ± 5 | 49 ± 4 | −4.63 |
| 64322 | F0/2IV/V (4) | 100+10−8 | 0.13 ± 0.04 | Y | Y | Y | Y | Y | LCC | 5.2 ± 0.5 | ... | <3.7 × 10⁶ | 31 ± 5 | 67 ± 6 | −4.6 |
| 64877 | F5V (4) | 125+18−14 | 0.02 ± 0.06 | Y | Y | Y | Y | Y | LCC | 13.3 ± 0.7 | ... | <4.2 × 10⁶ | 95 ± 6 | 74 ± 5 | −4.55 |
| 64995 | F2IV/V (4) | 110+1210 | 0.00 ± 0.04 | Y | Y | Y | Y | Y | LCC | 12.3 ± 0.3 | ... | <3.7 × 10⁶ | 38 ± 7 | 61 ± 6 | −4.68 |
| 65136 | F0V (5) | 161+31−22 | 0.16 ± 0.06 | Y | Y | Y | Y | Y | LCC | 7.2 ± 1.1 | ... | <1.1 × 10⁷ | 27 ± 4 | 81 ± 4 | −4.63 |
| 65423** | G0V (8) | 124+34−22 | 0.10 ± 0.05 | Y | Y | Y | Y | Y | LCC | 17.4 ± 0.3 | 0.122 | 2.4 × 10⁷ | 165 ± 5 | 38 ± 2 | −4.23‡ |
| 65517** | G1.5IV (8) | 111+22−16 | 0.11 ± 0.15 | Y | Y | Y | Y | Y | LCC | 11.7 ± 0.3 | 0.237 | 4.5 × 10⁷ | 185 ± 6 | 37 ± 3 | −4.03‡ |
| 65617 | F7/G0V (4) | 146+40−26 | 0.07 ± 0.06 | Y | Y | Y | Y | Y | LCC | 31.0 ± 1.2 | ... | <9.6 × 10⁶ | 126 ± 5 | 126 ± 9 | −4.19 |
| 65875 | F6V (4) | 110+14−11 | 0.00 ± 0.03 | Y | Y | Y | Y | Y | LCC | 9.7 ± 0.3 | ... | <2.5 × 10⁶ | 100 ± 6 | 40 ± 2 | −4.78 |
| 65891 | K0III (4) | 136+12−10 | 0.34 ± 0.13 | N | N | Y? | Y? | N | ... | 1.8 ± 0.3 | ... | <2.1 × 10⁵ | 25 ± 4 | 10 ± 1 | −5.44 |
| 66285A | F7/8V (4) | 83+14−11 | 0.04 ± 0.02 | N | Y | Y? | Y? | N | ... | 33.3 ± 0.3 | ... | <2.9 × 10⁶ | 32 ± 5 | 13 ± 1 | −5.5 |
| 66285B | G0V (14) | 83+14−11 | ... | N | Y | Y? | Y? | N | ... | 29.0 ± 0.3 | ... | ... | 24 ± 3 | 11 ± 2 | ... |
| 66782 | K0III (5) | 124+9−7 | 0.43 ± 0.11 | N | N | Y? | Y? | N | ... | 1.0 ± 0.3 | ... | <1.9 × 10⁵ | 37 ± 3 | 10 ± 1 | −5.39 |
| 66941** | G0.5IV (8) | 123+13−11 | 0.42 ± 0.06 | Y | Y | Y? | Y? | Y? | LCC | 5.0 ± 0.9 | 0.844 | 1.9 × 10⁷ | 306 ± 7 | 145 ± 9 | −4.3 |
| 67003 | K0III/IVCNII/(5) | 222+48−33 | 0.77 ± 0.13 | N | N | Y | Y | N | ... | −3.1 ± 0.2 | ... | <3.4 × 10⁵ | <11 | 10 ± 1 | −5.25 |
| 67068 | F3V (5) | 92+9−7 | 0.00 ± 0.01 | Y | Y | Y | Y | Y | LCC | 11.2 ± 0.8 | ... | <4.7 × 10⁶ | 101 ± 4 | 124 ± 9 | −4.62 |
| 67230 | F5V (4) | 131+17−13 | 0.01 ± 0.02 | Y | Y | Y | Y | Y | LCC | 13.6 ± 1.0 | ... | <2.5 × 10⁶ | 134 ± 6 | 98 ± 7 | −4.56 |
| 67428 | F5V (4) | 127+21−16 | 0.05 ± 0.01 | Y | Y | Y | Y | Y | LCC | 10.4 ± 0.3 | ... | <5.2 × 10⁶ | 117 ± 3 | 37 ± 3 | −4.61 |
| 67497 | F0V (5) | 107+10−9 | 0.00 ± 0.04 | Y | Y | Y | Y | Y | UCL | 12.1 ± 0.6 | ... | <4.8 × 10⁶ | 20 ± 4 | 70 ± 5 | −4.65 |
| 67522 | G0.5IV (8) | 148+40−26 | 0.19 ± 0.03 | Y | Y | Y? | Y? | Y? | UCL | −2.3 ± 0.4 | 0.154 | 2.8 × 10⁷ | 195 ± 5 | 57 ± 3 | −4.08‡ |
| 67957 | F8V (5) | 114+18−14 | 0.10 ± 0.06 | Y | Y | Y? | Y? | Y? | UCL | 17.5 ± 0.3 | ... | <5.6 × 10⁶ | 161 ± 7 | 14 ± 2 | −4.50‡ |
| 67970 | F3V (5) | 119+21−16 | 0.02 ± 0.02 | Y | Y | Y | Y | Y | UCL | 9.6 ± 0.3 | ... | <5.8 × 10⁶ | 70 ± 6 | 50 ± 3 | −4.52 |
| 68328** | G0 (11) | 120+28−19 | 0.53 ± 0.18 | Y | Y | Y | Y | Y | UCL | 9.1 ± 0.3 | ... | <5.7 × 10⁶ | 252 ± 4 | 10 ± 1 | −3.94‡ |
| 68335 | F5V (5) | 121+14−11 | 0.05 ± 0.03 | Y | Y | Y | Y | Y | UCL | 6.9 ± 0.9 | ... | <3.6 × 10⁶ | 75 ± 3 | 184 ± 12 | −4.31 |
| 68534† | F2V (10) | 96+28−18 | 0.01 ± 0.37 | ... | Y | Y | Y | Y | LCC | ... | ... | <1.1 × 10⁷ | ... | ... | ... |
| 68726† | G0.5III (8) | 163+18−15 | 0.44 ± 0.14 | N | N | Y | Y | N | ... | 7.3 ± 0.1 | ... | <5.2 × 10⁵ | <8 | 12 ± 1 | −4.63 |
| 69291 | F2V (6) | 132+20−16 | 0.00 ± 0.04 | Y | Y | Y? | Y? | Y? | UCL | 8.7 ± 0.4 | ... | <5.3 × 10⁶ | 66 ± 7 | 71 ± 5 | −4.81 |
| 69327 | F0IV (4) | 136+21−16 | 0.00 ± 0.01 | Y | Y | Y? | Y? | Y? | UCL | −4.7 ± 0.3 | ... | <6.0 × 10⁶ | 37 ± 4 | 48 ± 4 | −4.73 |
| 69395 | K2II (5) | 152+56−32 | 0.84 ± 0.17 | N | Y | Y | Y | N | ... | 29.2 ± 0.1 | ... | <5.9 × 10⁵ | 35 ± 6 | 10 ± 1 | −5.35‡ |
| 69720 | F0V (4) | 13320−16 | 0.00 ± 0.01 | Y | Y | Y | Y | Y | UCL | 9.9 ± 0.5 | ... | <6.4 × 10⁶ | 60 ± 5 | 115 ± 10 | −4.66 |
| 70350 | F7V (5) | 118+14−12 | 0.12 ± 0.05 | Y | Y | Y | Y | Y | UCL | 6.0 ± 0.3 | 0.412 | 2.3 × 10⁷ | 160 ± 7 | 23 ± 2 | −4.37‡ |
| 70376A | F7V (5) | 133+46−27 | 0.16 ± 0.06 | Y | Y | Y | Y | Y | UCL | 67.6 ± 0.3 | 0.181 | 2.1 × 10⁷ | 182 ± 6 | 17 ± 1 | −4.34‡ |
| 70376B | G0V (14) | 133+46−27 | ... | Y | Y | Y | Y | Y | UCL | 21.5 ± 1.0 | ... | ... | 185 ± 8 | 92 ± 5 | −4.17‡ |
| 70558 | F2V (5) | 136+24−18 | 0.11 ± 0.02 | Y | Y | Y | Y | Y | UCL | 9.6 ± 0.6 | ... | <8.9 × 10⁶ | 52 ± 7 | 100 ± 7 | −4.73 |
| 70689 | F2V (5) | 91+8−7 | 0.01 ± 0.03 | Y | Y | Y | Y | Y | UCL | 6.8 ± 0.3 | 0.043 | 5.2 × 10⁶ | 60 ± 3 | 19 ± 2 | −4.73 |
| 70833A | F3V (5) | 121+22−16 | 0.00 ± 0.01 | N | Y | Y | Y | N | ... | −35.2 ± 0.4 | ... | <6.5 × 10⁶ | 69 ± 4 | 97 ± 5 | −4.87 |
| 70833B | K3IV (14) | ... | ... | N | ... | Y | ... | N | ... | 6.6 ± 0.3 | ... | ... | 13 ± 3 | 10 ± 1 | ... |
| 70919 | G8III (5) | 179+53−33 | 0.85 ± 0.22 | N | N | Y | Y | N | ... | −15.0 ± 0.2 | 0.135 | 4.5 × 10⁶ | <12 | 13 ± 1 | −4.34 |
| 71023 | F0V (5) | 202+48−32 | 0.02 ± 0.04 | Y | Y | Y | Y | Y | UCL | 8.3 ± 0.2 | 0.108 | 1.9 × 10⁷ | 63 ± 5 | 38 ± 3 | −4.61 |
| 71178** | G8IVe (8) | 97+17−13 | 0.13 ± 0.07 | Y | Y | Y | Y | Y | UCL | 2.7 ± 0.3 | ... | <7.1 × 10⁶ | 316 ± 8 | 10 ± 1 | −3.80‡ |
| 71767 | F3V (5) | 225+106−55 | 0.16 ± 0.05 | Y | Y | Y | Y | Y | UCL | 5.6 ± 1.1 | 0.085 | 1.4 × 10⁷ | 88 ± 5 | 97 ± 6 | −4.29 |
| 72033A | F7IV/V (5) | 156+42−27 | 0.28 ± 0.05 | Y | Y | Y | Y | Y | UCL | 3.8 ± 1.2 | 0.094 | 1.4 × 10⁷ | 18 ± 3 | 196 ± 13 | −4.27 |
| 72033Ba | K8IV (14) | ... | ... | Y | ... | Y | ... | Y? | UCL | 10.6 ± 1.4 | ... | ... | 386 ± 9 | ... | ... |
| 72070 | G1V (8) | 133+36−23 | 0.05 ± 0.02 | Y | Y | Y | Y | Y | UCL | −13.9 ± 0.1 | ... | <5.6 × 10⁶ | 91 ± 4 | 32 ± 2 | −4.25‡ |
| 72099 | F6V (6) | 158+55−32 | 0.09 ± 0.03 | Y | Y | Y | Y | Y | UCL | 4.3 ± 0.2 | ... | <1.0 × 10⁷ | 135 ± 6 | 38 ± 3 | −4.36 |
| 72164† | F2III/IV (6) | 188+74−41 | 0.00 ± 0.13 | Y | Y | Y | Y | Y | UCL | −10.3 ± 0.2 | ... | <7.4 × 10⁶ | 30 ± 4 | 33 ± 2 | −4.66 |
| 73666 | F3IV (6) | 152+20−16 | 0.31 ± 0.03 | Y | Y | Y? | Y? | Y? | UCL | −21.4 ± 0.9 | ... | <2.2 × 10⁶ | 48 ± 4 | 145 ± 11 | −4.75 |
| 73667† | F3V (5) | 164+56−33 | 0.09 ± 0.04 | Y? | Y | Y | Y | Y? | UCL | 20.3 ± 0.1 | ... | <5.4 × 10⁶ | <11 | 18 ± 2 | −4.62 |
| 73742 | F8V (5) | 166+30−22 | 0.01 ± 0.02 | Y? | Y | Y | Y | Y? | UCL | −10.6 ± 0.1 | ... | <3.4 × 10⁶ | <14 | 8 ± 1 | −4.67 |
| 73783 | M0III (6) | 233+69−43 | 0.38 ± 0.36 | ... | N | Y | Y | N | ... | 19.9 ± 0.1 | ... | <1.2 × 10⁵ | ... | 10 ± 1 | −5.41‡ |
| 74177 | K0III (4) | 142+22−17 | 0.90 ± 0.11 | N | N | Y | Y | N | ... | 1.5 ± 0.1 | ... | <4.0 × 10⁵ | 23 ± 4 | 11 ± 1 | −5.37‡ |
| 74224 | G6III (6) | 131+8−7 | 0.41 ± 0.09 | N | N | Y? | Y? | N | ... | −35.2 ± 0.3 | ... | <1.5 × 10⁵ | 12 ± 4 | 10 ± 1 | −5.25 |
| 74499 | F3/5V (6) | 90+9−8 | 0.05 ± 0.05 | Y | Y | Y | Y | Y | UCL | 0.9 ± 0.3 | ... | <5.4 × 10⁶ | 81 ± 3 | 37 ± 3 | −4.89 |
| 74501 | G1.5III (8) | 206+34−25 | 0.56 ± 0.17 | N | N | Y | Y | N | ... | −29.6 ± 0.1 | 0.2 | 3.0 × 10⁶ | 23 ± 5 | 15 ± 2 | −4.53 |
| 74688† | K2III (4) | 223+67−42 | 0.99 ± 0.23 | N | N | Y | Y | N | ... | −7.0 ± 0.1 | ... | <3.4 × 10⁵ | 26 ± 3 | 9 ± 1 | −5.55 |
| 74772 | F3V (14) | 310+259−97 | 0.09 ± 0.05 | Y | Y | Y | Y | Y | UCL | −37.9 ± 0.1 | ... | <1.5 × 10⁷ | 17 ± 3 | 10 ± 1 | −4.47 |
| 74865 | F3V (6) | 115+19−14 | 0.06 ± 0.15 | Y | Y | Y | Y | Y | UCL | 2.1 ± 0.3 | ... | <5.9 × 10⁶ | 85 ± 6 | 85 ± 6 | −4.65 |
| 74959 | F5V (6) | 133+29−20 | 0.00 ± 0.05 | Y | Y | Y | Y | Y | UCL | 2.2 ± 0.1 | ... | <8.3 × 10⁶ | 125 ± 7 | 33 ± 2 | −4.29 |
| 75367 | F9V (14) | 124+31−21 | 0.00 ± 0.23 | Y | Y | Y | Y | Y | UCL | 0.6 ± 0.3 | ... | <1.6 × 10⁷ | 73 ± 5 | 10 ± 1 | −4.55 |
| 75459† | F3V (6) | 126+26−19 | 0.06 ± 0.10 | Y | Y | Y? | Y? | Y? | UCL | 7.7 ± 0.3 | ... | <4.6 × 10⁶ | 35 ± 5 | 25 ± 2 | −4.98 |
| 75480 | F0V (6) | 115+13−11 | 0.04 ± 0.04 | Y | Y | Y | Y | Y | UCL | 0.1 ± 0.3 | ... | <4.4 × 10⁶ | 63 ± 3 | 29 ± 2 | −4.67 |
| 75491 | F3V (6) | 169+31−23 | 0.10 ± 0.02 | Y | Y | Y | Y | Y | UCL | 19.2 ± 0.4 | ... | <4.6 × 10⁶ | 69 ± 4 | 55 ± 5 | −4.54 |
| 75683 | F3 (3) | 137+65−34 | 0.00 ± 0.03 | Y | Y | Y | Y | Y | UCL | 3.5 ± 0.3 | ... | <9.1 × 10⁶ | 78 ± 3 | 39 ± 3 | −4.66 |
| 75824 | F3V (6) | 162+41−27 | 0.08 ± 0.05 | N? | Y | Y | Y | N? | ... | −23.1 ± 0.2 | ... | <6.0 × 10⁶ | <8 | 28 ± 2 | −4.53 |
| 75891 | F2V (5) | 132+20−16 | 0.04 ± 0.01 | Y | Y | Y | Y | Y | UCL | 5.5 ± 0.6 | 0.04 | 5.2 × 10⁶ | 70 ± 6 | 61 ± 4 | −4.48 |
| 75916 | F9V (9) | 168+87−43 | 0.00 ± 0.05 | N | Y | Y? | Y | N | ... | −31.3 ± 0.3 | ... | <7.6 × 10⁶ | 69 ± 7 | 10 ± 1 | −5.53 |
| 75924A** | G2.5IV (8) | 102+24−16 | 0.21 ± 0.20 | Y | Y | Y | Y | Y | UCL | 6.3 ± 0.3 | 0.609 | 4.1 × 10⁷ | 239 ± 5 | 45 ± 3 | −3.94‡ |
| 75924B** | G8IV (14) | 102+24−16 | ... | Y | Y | Y | Y | Y | UCL | −8.5 ± 0.3 | ... | ... | 283 ± 7 | 39 ± 4 | −3.91‡ |
| 75933 | F3V (6) | 181+38−27 | 0.18 ± 0.02 | Y | Y | Y? | Y | Y? | UCL | −31.1 ± 0.3 | ... | <6.0 × 10⁶ | 65 ± 5 | 36 ± 3 | −4.52 |
| 76084 | F2V (6) | 143+25−19 | 0.28 ± 0.02 | Y | Y | Y | Y | Y | UCL | −1.4 ± 0.3 | 0.025 | 3.5 × 10⁶ | 64 ± 4 | 43 ± 3 | −4.66 |
| 76197 | G5/8III+F (5) | 177+29−22 | 0.44 ± 0.15 | N | N | Y? | Y? | N | ... | −2.2 ± 0.3 | ... | <1.2 × 10⁶ | 24 ± 4 | 10 ± 1 | −4.76‡ |
| 76457† | F2V (6) | 120+15−12 | 0.00 ± 0.02 | Y | Y | Y? | Y? | Y? | UCL | −25.4 ± 0.3 | ... | <3.6 × 10⁶ | 40 ± 7 | 49 ± 4 | −4.82 |
| 76472 | G1IV (8) | 116+26−18 | 0.43 ± 0.09 | Y | Y | Y | Y | Y | UCL | −17.0 ± 0.8 | 0.307 | 3.1 × 10⁷ | 246 ± 6 | 97 ± 7 | −3.96‡ |
| 76501† | F2V (6) | 168+42−28 | 0.15 ± 0.07 | Y | Y | Y | Y | Y | UCL | −20.4 ± 1.8 | ... | <4.7 × 10⁶ | 23 ± 4 | 112 ± 8 | −4.51 |
| 76875 | F2V (6) | 91+10−8 | 0.03 ± 0.03 | Y | Y | Y | Y | Y | UCL | −4.6 ± 1.1 | ... | <4.6 × 10⁶ | 70 ± 6 | 128 ± 11 | −4.67 |
| 77015 | G0.5V (8) | 91+14−11 | 0.00 ± 0.03 | N | Y | Y? | Y? | N | ... | −31.0 ± 0.3 | ... | <8.3 × 10⁶ | 60 ± 4 | 10 ± 1 | −5.41 |
| 77038 | F3V (6) | 137+32−22 | 0.05 ± 0.02 | Y | Y | Y | Y | Y | UCL | 2.6 ± 0.3 | ... | <6.9 × 10⁶ | 97 ± 5 | 46 ± 3 | −4.71 |
| 77135A | G4IV (8) | 107+37−22 | 0.36 ± 0.08 | Y | Y | Y | Y | Y | UCL | 1.9 ± 0.3 | 0.115 | 2.1 × 10⁷ | 245 ± 4 | 13 ± 1 | −4.22‡ |
| 77135B | K2IV (14) | 107+37−22 | ... | Y | Y | Y | Y | Y | UCL | −15.6 ± 0.5 | ... | ... | 360 ± 7 | ... | ... |
| 77144 | G0IV (8) | 140+31−21 | 0.07 ± 0.12 | Y | Y | Y | Y | Y | UCL | −8.9 ± 0.8 | 0.251 | 3.4 × 10⁷ | 194 ± 7 | 73 ± 5 | −3.97‡ |
| 77157 | K3Ve (10) | 141+52−30 | 1.35 ± 0.38 | Y | Y | Y? | Y? | Y? | UCL | ... | 0.137 | 6.6 × 10⁶ | ... | ... | ... |
| 77432 | F5V (5) | 96+14−11 | 0.00 ± 0.01 | Y | Y | Y | Y | Y | UCL | 2.4 ± 0.6 | ... | <6.0 × 10⁶ | 100 ± 6 | 83 ± 5 | −4.62 |
| 77502 | F3V (6) | 198+46−32 | 0.00 ± 0.08 | Y | Y | Y | Y | Y | UCL | −23.5 ± 0.2 | ... | <6.3 × 10⁶ | 64 ± 4 | 40 ± 3 | −4.43 |
| 77520A | F3V (6) | 101+17−13 | 0.08 ± 0.05 | Y | Y | Y | Y | Y | UCL | 2.7 ± 0.3 | ... | <8.2 × 10⁶ | 105 ± 4 | 30 ± 3 | −4.88 |
| 77520Bb | K8IV (14) | ... | ... | ... | ... | ... | ... | ... | UCL | 2.8 ± 0.3 | ... | ... | 361 ± 6 | ... | ... |
| 77713 | F5V (6) | 178+49−31 | 0.00 ± 0.07 | Y? | Y | Y? | Y? | Y? | UCL | −8.8 ± 0.3 | ... | <8.0 × 10⁶ | <12 | 48 ± 4 | −4.73 |
| 77780 | F7/8V (5) | 172+49−31 | 0.03 ± 0.12 | Y? | Y | Y | Y | Y? | UCL | −27.8 ± 0.1 | ... | <6.1 × 10⁶ | <10 | 13 ± 1 | −4.35 |
| 77813 | F8V (7) | 105+17−13 | 0.50 ± 0.09 | Y | Y | Y | Y | Y | US | −5.4 ± 0.4 | 0.119 | 1.4 × 10⁷ | 137 ± 4 | 81 ± 7 | −4.38‡ |
| 78043 | F3V (6) | 144+32−22 | 0.01 ± 0.11 | Y | Y | Y | Y | Y | UCL | 1.6 ± 0.3 | ... | <6.7 × 10⁶ | 91 ± 3 | 66 ± 5 | −4.41 |
| 78133 | G3V (13) | 211+172−65 | 0.00 ± 0.03 | Y | Y | Y | Y | Y | UCL | ... | 0.106 | 2.3 × 10⁷ | ... | ... | ... |
| 78432 | G5III (5) | 155+40−26 | 2.08 ± 0.29 | ... | N | Y? | Y? | N | ... | ... | ... | <4.2 × 10⁵ | ... | ... | ... |
| 78555 | F0V (6) | 106+12−10 | 0.07 ± 0.02 | Y | Y | Y | Y | Y | UCL | 1.2 ± 0.5 | ... | <6.2 × 10⁶ | 59 ± 5 | 73 ± 5 | −4.64 |
| 78581 | G1V (6) | 91+11−9 | 0.00 ± 0.10 | Y | Y | Y? | Y? | Y? | US | −0.3 ± 0.3 | 0.154 | 2.1 × 10⁷ | 153 ± 3 | 27 ± 2 | −4.22‡ |
| 78663 | F5V (6) | 144+29−21 | 0.00 ± 0.01 | Y | Y | Y? | Y? | Y? | US | −11.3 ± 0.3 | ... | <5.4 × 10⁶ | 92 ± 3 | 10 ± 1 | −4.73 |
| 78684 | G9.5IV (8) | 166+95−44 | 0.34 ± 0.11 | Y | Y | Y | Y | Y | UCL | 3.0 ± 0.3 | 0.409 | 3.2 × 10⁷ | 405 ± 10 | 71 ± 4 | −3.99‡ |
| 78881† | F3V (6) | 110+12−10 | 0.19 ± 0.08 | Y | Y | Y? | Y? | Y? | UCL | −6.7 ± 2.1 | 0.32 | 1.7 × 10⁷ | 86 ± 6 | 189 ± 12 | −4.38 |
| 78977 | F7V (13) | 117+18−14 | 0.30 ± 0.07 | Y | Y | Y | Y | Y | US | 14.8 ± 0.3 | 0.11 | 1.1 × 10⁷ | 164 ± 7 | 85 ± 7 | −4.31 |
| 79054 | F0V (7) | 139+23−17 | 0.28 ± 0.05 | Y | Y | Y | Y | Y | US | −4.1 ± 0.7 | 0.031 | 6.9 × 10⁶ | 65 ± 5 | 72 ± 5 | −4.79 |
| 79252 | G7IV(e) (13) | 126+48−27 | 0.65 ± 0.23 | Y | Y | Y | Y | Y | US | −3.8 ± 0.3 | 0.25 | 2.9 × 10⁷ | 223 ± 5 | 48 ± 3 | −3.99‡ |
| 79258 | F3V (6) | 114+17−13 | 0.07 ± 0.06 | Y? | Y | Y | Y | Y? | ... | −18.0 ± 0.3 | ... | <8.7 × 10⁶ | <8 | 10 ± 1 | −5.38 |
| 79288 | F0V (7) | 150+26−20 | 0.20 ± 0.05 | Y? | Y | Y | Y | Y? | US | −2.9 ± 0.3 | ... | <6.8 × 10⁶ | <15 | 40 ± 3 | −4.6 |
| 79369 | F0V (7) | 122+26−18 | 0.53 ± 0.12 | Y | Y | Y | Y | Y | US | −6.7 ± 0.3 | ... | <5.6 × 10⁶ | 46 ± 4 | 57 ± 4 | −4.75 |
| 79516 | F5V (5) | 134+24−18 | 0.00 ± 0.02 | Y | Y | Y | Y | Y | UCL | 2.8 ± 0.3 | 0.054 | 8.4 × 10⁶ | 99 ± 3 | 43 ± 3 | −4.52 |
| 79610A | G0.5V (8) | 88+16−12 | 0.00 ± 0.16 | N | Y | Y | Y | N | ... | 19.0 ± 0.3 | ... | <5.7 × 10⁶ | 24 ± 4 | ... | −5.17 |
| 79610B | G1V (14) | 88+16−12 | ... | N | Y | Y | Y | N | ... | 12.5 ± 0.3 | ... | ... | 35 ± 6 | 10 ± 1 | −5.19 |
| 79673 | F2V (5) | 117+17−13 | 0.00 ± 0.04 | Y | Y | Y | Y | Y | UCL | 2.9 ± 0.4 | 0.041 | 5.1 × 10⁶ | 69 ± 4 | 113 ± 7 | −4.55 |
| 79710 | F0V (5) | 127+20−15 | 0.00 ± 0.02 | Y | Y | Y | Y | Y | UCL | 4.6 ± 0.5 | ... | <5.4 × 10⁶ | 47 ± 4 | 61 ± 5 | −4.61 |
| 79742 | F6V (10) | 146+42−27 | 0.00 ± 0.05 | Y | Y | Y | Y | Y | UCL | 1.2 ± 0.3 | ... | <6.9 × 10⁶ | 69 ± 6 | 30 ± 3 | −4.53 |
| 79908 | F9IV (8) | 99+14−11 | 0.08 ± 0.06 | Y | Y | Y | Y | Y | UCL | −2.8 ± 0.3 | 0.162 | 1.6 × 10⁷ | 113 ± 5 | 44 ± 3 | −4.16‡ |
| 79910 | F3V (7) | 149+43−27 | 0.40 ± 0.03 | Y | Y | Y | Y | Y | US | −6.6 ± 0.7 | ... | <4.8 × 10⁶ | 38 ± 5 | 158 ± 9 | −4.4 |
| 79977 | F2/3V (7) | 123+18−14 | 0.26 ± 0.06 | Y | Y | Y | Y | Y | US | −2.8 ± 0.3 | ... | <6.6 × 10⁶ | 66 ± 7 | 57 ± 4 | −4.6 |
| 80320 | G3IV (13) | 142+28−20 | 0.05 ± 0.06 | Y | Y | Y | Y | Y | US | 1.7 ± 0.3 | 0.116 | 1.7 × 10⁷ | 181 ± 8 | 33 ± 2 | −4.17‡ |
| 80535** | G0V (6) | 120+20−15 | 0.00 ± 0.04 | Y | Y | Y | Y | Y | US | −4.0 ± 0.3 | 0.257 | 2.3 × 10⁷ | 125 ± 6 | 58 ± 3 | −4.27‡ |
| 80586† | F5V (6) | 120+18−14 | 0.00 ± 0.10 | Y? | Y | Y? | Y | Y? | US | −40.3 ± 0.3 | ... | <3.0 × 10⁶ | <11 | 10 ± 1 | −4.58 |
| 80636** | G0.5IV (8) | 111+21−15 | 0.29 ± 0.07 | Y | Y | Y | Y | Y | UCL | −2.0 ± 0.6 | 0.34 | 3.6 × 10⁷ | 236 ± 6 | 76 ± 6 | −4.10‡ |
| 80663† | F1V (10) | 306+758−127 | 0.60 ± 0.12 | ... | Y | Y | Y | Y | UCL | ... | ... | <1.6 × 10⁷ | ... | ... | ... |
| 80921 | F2IV (10) | 111+34−21 | 0.54 ± 0.21 | ... | Y | Y | Y | Y | UCL | ... | ... | <1.7 × 10⁷ | ... | ... | ... |
| 81136 | A7/8+G (6) | 285+76−50 | 1.73 ± 0.25 | ... | Y | Y | Y | Y | UCL | ... | 0.057 | <6.6 × 10⁵ | ... | ... | ... |
| 81380 | G0IV (8) | 202+156−61 | 0.34 ± 0.11 | Y | Y | Y | Y | Y | UCL | −3.6 ± 0.3 | 0.054 | 1.3 × 10⁷ | 200 ± 7 | 50 ± 3 | −4.29‡ |
| 81447 | G0.5IV (8) | 184+48−31 | 0.00 ± 0.14 | Y | Y | Y | Y | Y | UCL | ... | 0.033 | 3.6 × 10⁶ | ... | ... | ... |
| 81455 | F3V (6) | 105+18−13 | 0.00 ± 0.03 | Y | Y | Y | Y | Y | US | −3.2 ± 0.5 | 0.067 | 1.5 × 10⁷ | 75 ± 3 | 89 ± 8 | −4.45‡ |
| 81775 | G1IV (8) | 148+35−24 | 0.00 ± 0.03 | N | Y | Y | Y | N | ... | ... | ... | <6.5 × 10⁶ | ... | ... | ... |
| 81851 | F2V (6) | 129+27−19 | 0.00 ± 0.03 | Y | Y | Y? | Y? | Y? | US | −51.7 ± 0.4 | ... | <4.6 × 10⁶ | 24 ± 3 | 57 ± 4 | −4.7 |
| 82135 | K0III (6) | 88+3−3 | 0.32 ± 0.11 | ... | N | Y? | Y? | N | ... | ... | ... | <6.6 × 10⁴ | ... | ... | ... |
| 82218 | F2/3V (7) | 136+24−17 | 0.22 ± 0.03 | Y | Y | Y | Y | Y | US | −6.7 ± 0.3 | ... | <6.6 × 10⁶ | 85 ± 4 | 37 ± 2 | −4.7 |
| 82534 | F0V (6) | 127+15−12 | 0.00 ± 0.02 | Y? | Y | Y | Y | Y? | US | −39.8 ± 0.5 | ... | <4.0 × 10⁶ | <13 | 83 ± 7 | −4.63 |
| 82569 | F3V (6) | 183+48−31 | 0.12 ± 0.05 | Y | Y | Y | Y | Y | UCL | −2.6 ± 0.4 | 0.113 | 1.5 × 10⁷ | 106 ± 5 | 81 ± 5 | −4.35 |
| 82747** | F5V (6) | 103+27−18 | 1.08 ± 0.39 | ... | Y | Y | Y | Y | UCL | −30.0 ± 0.3 | ... | <2.8 × 10⁶ | ... | ... | −4.43 |
| 83159 | F5V (6) | 147+42−27 | 0.00 ± 0.09 | Y | Y | Y | Y | Y | UCL | 4.2 ± 0.4 | 0.049 | 4.9 × 10⁶ | 94 ± 6 | 68 ± 4 | −4.48 |
Notes. Lower Centaurus Crux (LCC), Upper Centaurus Lupus (UCL), Upper Scorpius (US).
†Binary system.
‡Ca ii H and K core emission.
*Visual variable: ΔV < 0.06 mag.
**Visual variable: 0.06 mag <ΔV < 0.6 mag.
aAt the time our Magellan observations were made (2009 April 15), HIP 72033B possessed an angular separation 2 6 and a position angle 106° E from N from the primary.
bAt the time our Magellan observations were made (2007 March 10), HIP 77520B possessed an angular separation 27 and a position angle −128
6 and a position angle 106° E from N from the primary.
bAt the time our Magellan observations were made (2007 March 10), HIP 77520B possessed an angular separation 27 and a position angle −128 9 E from N from the primary.
References. (1) Cannon & Pickering 1919; (2) Cannon & Pickering 1920; (3) Glaspey 1972; (4) Houk & Cowley 1975; (5) Houk 1978; (6) Houk 1982; (7) Houk & Smith-Moore 1988; (8) Mamajek et al. 2002; (9) E. E. Mamajek & M. Pecaut 2010, private communication; (10) Pecaut et al. 2010; (11) Spencer-Jones & Jackson 1939; (12) Stock & Wroblewski 1972; (13) Torres et al. 2006; (14) this work.
9 E from N from the primary.
References. (1) Cannon & Pickering 1919; (2) Cannon & Pickering 1920; (3) Glaspey 1972; (4) Houk & Cowley 1975; (5) Houk 1978; (6) Houk 1982; (7) Houk & Smith-Moore 1988; (8) Mamajek et al. 2002; (9) E. E. Mamajek & M. Pecaut 2010, private communication; (10) Pecaut et al. 2010; (11) Spencer-Jones & Jackson 1939; (12) Stock & Wroblewski 1972; (13) Torres et al. 2006; (14) this work.
Finally, our ScoCen sample is sufficiently large that it can be used to search for signatures of mass-dependent disk evolution. The physical properties of central stars are expected to shape the evolution of circumstellar disks. For example, Spitzer photometric measurements of 204 stars in Upper Sco indicate that disk properties depend on spectral type. At ∼10 Myr, M-type stars possess optically thick, accreting disks; F- and G-type stars do not apparently possess disks; and B- and A-type stars posses optically thin, debris disks, suggesting that disk evolution is most advanced around intermediate-mass stars (Carpenter et al. 2006). During the debris disk phase, (1) infrared excess is expected to be dependent on the luminosity of the central star with more luminous stars warming larger surface areas within their circumstellar disks, producing larger infrared excesses and (2) the timescale for disk evolution is expected to be dependent on the orbital timescale with disks evolving more rapidly around higher mass stars. Therefore, we also search for disk trends as a function of stellar properties to determine how stellar properties impact the production and removal of debris dust around main-sequence stars.
2. OBSERVATIONS
The Hipparcos satellite enabled high-precision measurements of stellar position, parallax, and proper motion for stars with V-band magnitudes, mV < 9, providing the ability to identify candidate members of nearby OB associations with spectral types later than B for the first time. De Zeeuw et al. (1999, hereafter dZ99) analyzed the Hipparcos measurements of stars in a dozen nearby OB associations using de Bruijne's refurbished convergent point method and Hoogerwerf & Aguilar's "Spaghetti method" to determine the average position and space motions of each association, including the US, UCL, and LCC subgroups of ScoCen. By cross correlating the Hipparcos measurements of individual stars with mean subgroup properties, dZ99 carried out a detailed census of high- and intermediate-mass stars in ScoCen. In particular, they identified almost 200 probable new solar-like members of US (22 F-type, 9 G-type, 4 K-type, and 2 M-type stars), UCL (55 F-type, 25 G-type, 6 K-type, and 1 M-type stars), and LCC (61 F-type, 15 G-type, 6 K-type, and 1 M-type stars). However, they cautioned that up to ∼30% of their candidate members may be interlopers because the stellar radial velocities were not measured.
We sought to obtain MIPS 24 μm and 70 μm photometry of all of the solar-like ScoCen members identified by dZ99. In fact, we obtained MIPS observations of 13 F-type and 4 G-type stars in US. Carpenter et al. (2009b) observed eight F-type and two G-type dZ99 US candidates as part of a detailed study focusing on US. We obtained MIPS observations of 54 F-type, 25 G-type, 6 K-type, and 1 M-type star in UCL. The remaining one F-type star (HIP 73777) was observed by F. Low as part of a GTO program search for MIPS excess around nearby, young stars (Spitzer PID 72). Smith et al. (2006) published the excess sources discovered in this survey; HIP 73777 did not apparently possess a MIPS excess. We obtained MIPS observations of 61 F-type, 13 G-type, 6 K-type, and 1 M-type star in LCC. The remaining two G-type stars (HIP 62445 and HIP 66001) were observed by the formation and evolution of planetary systems (FEPS) legacy team led by M. Meyer. Carpenter et al. (2009a) published the MIPS results from this study; neither HIP 62445 and HIP 66001 apparently possess MIPS excess.
Similarly, we sought to obtain Magellan/MIKE spectra of all of the solar-like ScoCen members identified by dZ99. The higher angular resolution of the 6.5 m Magellan Clay Telescope at visual wavelengths additionally afforded us the opportunity to obtain spectra of primary and secondary stars in ScoCen binary systems that could not be resolved by Spitzer at mid-infrared wavelengths. Therefore, we collected MIKE spectra of individual components whenever possible. We obtained Magellan/MIKE observations of the majority of candidate solar-like ScoCen members that we observed with MIPS including the primary and secondary components of nine binary systems (HIP 63975, HIP 66285, HIP 70376, HIP 70833, HIP 72033, HIP 75924, HIP 77135, HIP 77520, and HIP 79610). We were not able to obtain Magellan/MIKE observations for three F-type (HIP 80663, HIP 80921, and HIP 81136), four G-type (HIP 78133, HIP 78432, HIP 81447, and HIP 81775), and two K-type (HIP 77157 and HIP 82135) stars in UCL; and two F-type stars in LCC (HIP 59781 and HIP 68534).
2.1. MIPS Observations
We obtained Spitzer (Werner et al. 2004) MIPS (Rieke et al. 2004) observations of 183 candidate ScoCen single and binary systems in photometry mode at 24 μm and 70 μm (default scale). Each system was observed once between 2004 February and 2008 March, using 1 cycle of 3 s integrations at 24 μm and 1–6 cycle(s) of 10 s integrations at 70 μm, corresponding to on-source intergation times of 24.1 s and 125.8 s–754.8 s at 24 μm and 70 μm, respectively. All data were processed using the MIPS instrument team Data Analysis Tool (Gordon et al. 2005) for basic reduction (dark subtraction, flat-fielding/illumination correction). A series of additional steps designed to provide homogeneous reduction for MIPS data was applied as part of a Spitzer legacy catalog (Su et al. 2010). In short, a second flat field constructed from the 24 μm data itself was applied to all the 24 μm data to remove scattered-light gradient and dark latency to improve sensitivity (e.g., Engelbracht et al. 2007) except for observations that possess complex background. The known transient behaviors associated with the MIPS 70 μm array were removed by masking out bright sources in the field of view and time filtering the data (for details see Gordon et al. 2007). The processed data were then combined using the World Coordinate System information to produce final mosaics with pixels half the size of the physical pixel scale. For 70 μm data, an additional outlier rejection was performed using the spatial redundancy of each processed data frame to further remove hot pixels in the data. This extra process can improve the data quality, especially for observations where sources are not detected (K. Y. L. Su et al., in preparation).
Since the majority of the sources in the sample are not resolved, we extract the photometry using point-spread function (PSF) fitting. The input PSFs were constructed using observed calibration stars and smoothed STinyTim model PSFs, and have been tested to ensure that photometric results are consistent with the MIPS calibration (Engelbracht et al. 2007; Gordon et al. 2007). The systematic errors were estimated based on the pixel-to-pixel variation on the source-free (PSF-subtracted) images. We also performed aperture photometry (using the multiple aperture setting in Su et al. 2006). The aperture photometry measurements were used as a reference to screen targets that might be contaminated by nearby sources, background nebulosity, or source extension. We list our measurements in Table 2; stars with 24 μm contamination are noted with a dagger. All of the targets were detected at 24 μm. Each target position was refined using two-dimensional Gaussian fitting and then compared to the SIMBAD stellar position to ensure the correct source extraction. For the sources that were not detected at 70 μm, the PSF was fixed at the position of 24 μm source position to extract PSF fitting photometry using the minimum χ2 technique. We quote 3σ upper limit for systems that were not detected. The total photometric uncertainty is the sum in quadrature of (1) the source photon counting uncertainty, (2) the detector repeatability uncertainty (0.4% and 4.5% of the total flux at 24 and 70 μm, respectively), and (3) the absolute calibration uncertainty (2% and 5% of the total flux at 24 and 70 μm, respectively).
Table 2. MIPS 24 μm and 70 μm Fluxes (Not Color-corrected)
| Measured | Measured | Predicted | Measured | Measured | Predicted | |||||
|---|---|---|---|---|---|---|---|---|---|---|
| HIP | Name | AOR | Fν(24 μm) | σF24‡ | Fν(24 μm) | χ24 | Fν(70 μm) | σF70‡ | Fν(70 μm) | χ70 |
| ID | (mJy) | (mJy) | (mJy) | (mJy) | (mJy) | (mJy) | ||||
| 55334 | HD 98660 | 4778752 | 11.4 | 0.1 | 10.6 | 1.9 | <36.1 | ... | 1.2 | ... |
| 56227† | HD 100282 | 4779008 | 7.1 | 0.1 | 6.4 | 2.6 | <28.6 | ... | 0.7 | ... |
| 56420† | CD-47 6947 | 4779264 | 0.8 | 0.1 | ... | ... | <20.7 | ... | ... | ... |
| 56673 | HD 101088 | 4779520 | 72.8 | 0.1 | 54.3 | 8.4 | <34.8 | ... | 6.0 | ... |
| 56814 | HD 101247 | 22771200 | 159.4 | 0.1 | 162.4 | −0.5 | <16.9 | ... | 18.0 | ... |
| 57524† | HD 102458 | 4779776 | 11.4 | 0.1 | 7.3 | 11.8 | <22.4 | ... | 0.8 | ... |
| 57595 | HD 102597 | 22772224 | 3.71 | 0.06 | 3.77 | −0.5 | <14.6 | ... | 0.4 | ... |
| 57950† | HD 103234 | 4780032 | 17.4 | 0.1 | 8.9 | 18.4 | <30.5 | ... | 1.0 | ... |
| 58075 | HD 103441 | 22773248 | 6.06 | 0.07 | 4.90 | 5.6 | <46.8 | ... | 0.5 | ... |
| 58146 | HD 103589 | 22773504 | 14.4 | 0.3 | 13.3 | 1.8 | <59.8 | ... | 1.5 | ... |
| 58167 | HD 103599 | 4780544 | 9.9 | 0.1 | 8.8 | 3.1 | <31.9 | ... | 1.0 | ... |
| 58220† | HD 103703 | 4780800 | 25.5 | 0.2 | 8.0 | 29.4 | <39.4 | ... | 0.9 | ... |
| 58528† | HD 104231 | 4781056 | 16.0 | 0.2 | 7.8 | 17.5 | <39.8 | ... | 0.9 | ... |
| 58899† | HD 104897 | 4781312 | 8.0 | 0.1 | 8.3 | −1.0 | <31.1 | ... | 0.9 | ... |
| 58921 | HD 104933 | 22775552 | 2294.0 | 0.3 | 2798.1 | −5.2 | 220 | 20 | 310 | −3.1 |
| 58996 | HD 105070 | 4781568 | 9.3 | 0.1 | 8.8 | 1.6 | <28.4 | ... | 1.0 | ... |
| 59084† | HD 105233 | 4781824 | 5.9 | 0.4 | 5.9 | 0.2 | <63.9 | ... | 0.6 | ... |
| 59481† | HD 105994 | 4782080 | 8.6 | 0.2 | 7.1 | 4.6 | <32.2 | ... | 0.8 | ... |
| 59603† | HD 106218 | 4782336 | 8.1 | 0.1 | 7.7 | 1.1 | <25.9 | ... | 0.8 | ... |
| 59693 | HD 106389 | 4782592 | 7.5 | 0.1 | 3.5 | 17.3 | <23.3 | ... | 0.4 | ... |
| 59716 | HD 106444 | 4782848 | 10.4 | 0.1 | 8.9 | 4.1 | <25.5 | ... | 1.0 | ... |
| 59764† | HD 106506 | 22777856 | 15.0 | 0.6 | 13.3 | 2.1 | <166.4 | ... | 1.5 | ... |
| 59781† | HD 106538 | 22778112 | 9 | 2 | 7 | 0.5 | <1010 | ... | 0.8 | ... |
| 59854 | HD 106725 | 4783616 | 7.2 | 0.1 | 6.8 | 1.5 | <24.3 | ... | 0.7 | ... |
| 59960† | HD 106906 | 4783872 | 103.1 | 0.2 | 15.3 | 40.7 | 281 | 9 | 1.7 | 13.3 |
| 60205 | CD-51 6597 | 4784128 | 2.9 | 0.1 | 2.1 | 4.9 | <42.7 | ... | 0.2 | ... |
| 60245† | HD 107437 | 4784384 | 4.9 | 0.1 | 4.5 | 1.9 | <35.9 | ... | 0.5 | ... |
| 60348† | HD 107649 | 4784640 | 12.2 | 0.1 | 6.2 | 17.8 | <32.0 | ... | 0.7 | ... |
| 60513† | HD 107920 | 4784896 | 7.5 | 0.1 | 7.5 | −0.2 | <37.5 | ... | 0.8 | ... |
| 60567† | HD 108016 | 22780416 | 3.81 | 0.07 | 3.24 | 4.0 | <15.1 | ... | 0.4 | ... |
| 60885 | HD 108568 | 4785152 | 9.4 | 0.1 | 9.0 | 1.3 | <36.8 | ... | 1.0 | ... |
| 60913† | HD 108611 | 4785408 | 11.4 | 0.2 | 10.6 | 1.8 | <55.4 | ... | 1.2 | ... |
| 61049 | HD 108857 | 22781440 | 40.3 | 0.2 | 10.9 | 32.6 | <30.8 | ... | 1.2 | ... |
| 61086† | CD-51 6746 | 22781696 | 1.02 | 0.03 | 1.00 | 0.0 | <17.5 | ... | 0.1 | ... |
| 61087† | HD 108904 | 22781952 | 109.9 | 0.5 | 14.6 | 40.8 | <113.0 | ... | 1.6 | ... |
| 61241† | CD-50 7070 | 4785920 | 2.9 | 0.1 | 2.6 | 1.6 | <22.4 | ... | 0.3 | ... |
| 61248 | HD 109173 | 22782208 | 74.3 | 0.1 | 76.7 | −0.9 | <13.9 | ... | 8.4 | ... |
| 62032 | HD 110484 | 22784512 | 5.94 | 0.07 | 4.99 | 4.7 | <15.9 | ... | 0.5 | ... |
| 62056† | CD-49 7315 | 22784768 | 1.55 | 0.05 | 1.62 | −1.6 | <13.0 | ... | 0.2 | ... |
| 62134† | HD 110634 | 4786176 | 8.6 | 0.1 | 5.9 | 9.5 | <23.9 | ... | 0.6 | ... |
| 62171 | HD 110697 | 4786432 | 6.3 | 0.1 | 5.8 | 2.1 | <25.5 | ... | 0.6 | ... |
| 62427 | HD 111103 | 4786688 | 11.0 | 0.2 | 4.1 | 23.1 | <36.9 | ... | 0.4 | ... |
| 62428† | HD 111102 | 4786944 | 21.9 | 0.5 | 21.6 | 0.4 | <87.5 | ... | 2.4 | ... |
| 62431 | HD 111104 | 4787200 | 11.7 | 0.2 | 11.7 | 0.0 | <46.0 | ... | 1.3 | ... |
| 62657 | HD 111520 | 4787456 | 41.0 | 0.1 | 5.9 | 40.5 | 214 | 8 | 0.7 | 13.0 |
| 62674† | CD-46 8204 | 22786304 | 1.53 | 0.04 | 1.38 | 1.8 | <12.7 | ... | 0.2 | ... |
| 62677† | HD 111466 | 22786560 | 4.66 | 0.07 | 4.31 | 2.2 | <17.2 | ... | 0.5 | ... |
| 63022 | HD 112146 | 22787840 | 2.11 | 0.05 | 2.09 | 0.1 | <13.5 | ... | 0.2 | ... |
| 63041† | HD 112109 | 22788096 | 10 | 4 | 10 | 0.0 | <5170 | ... | 1.1 | ... |
| 63272† | HD 112509 | 4787968 | 8.4 | 0.1 | 7.5 | 2.9 | <37.5 | ... | 0.8 | ... |
| 63435 | HD 112794 | 22789120 | 4.90 | 0.07 | 4.67 | 1.3 | <13.5 | ... | 0.5 | ... |
| 63439† | HD 112810 | 4788224 | 10.3 | 0.1 | 4.4 | 20.8 | 90 | 10 | 0.5 | 7.9 |
| 63527 | HD 112951 | 4788480 | 13.1 | 0.1 | 13.0 | 0.2 | <27.1 | ... | 1.4 | ... |
| 63797 | HD 113376 | 4788736 | 15.1 | 0.2 | 15.6 | −0.8 | <42.7 | ... | 1.7 | ... |
| 63836† | HD 113524 | 4788992 | 8.2 | 0.1 | 5.2 | 11.5 | <37.1 | ... | 0.6 | ... |
| 63847† | HD 113466 | 22789632 | 9.4 | 0.4 | 8.6 | 1.7 | <182.7 | ... | 0.9 | ... |
| 63886 | HD 113556 | 4789504 | 19.4 | 0.2 | 9.3 | 19.8 | 160 | 20 | 1.0 | 8.3 |
| 63962 | HD 113706 | 22789888 | 5.59 | 0.08 | 5.58 | 0.0 | <25.3 | ... | 0.6 | ... |
| 63975 | HD 113766 | 4789760 | 1459.0 | 0.2 | 18.3 | 48.4 | 390 | 11 | 2.0 | 13.6 |
| 64044† | HD 113901 | 4790528 | 9.0 | 0.1 | 7.3 | 5.4 | <30.1 | ... | 0.8 | ... |
| 64184 | HD 114082 | 4790784 | 216.5 | 0.2 | 9.9 | 46.6 | 350 | 30 | 1.1 | 9.7 |
| 64216 | HD 114196 | 22790400 | 66.6 | 0.2 | 71.3 | −1.9 | <38.2 | ... | 7.9 | ... |
| 64316† | CD-51 7328 | 22790656 | 1.93 | 0.05 | 1.83 | 1.2 | <13.1 | ... | 0.2 | ... |
| 64322† | HD 114319 | 22791168 | 10 | 1 | 10 | 0.3 | <183.6 | ... | 1.1 | ... |
| 64877† | HD 115361 | 22792192 | 19.8 | 0.9 | 7.9 | 11.8 | <176.5 | ... | 0.9 | ... |
| 64995 | HD 115600 | 4791552 | 113.8 | 0.2 | 8.3 | 45.0 | 180 | 20 | 0.9 | 7.4 |
| 65136 | HD 115875 | 22793984 | 3.37 | 0.07 | 3.38 | −0.1 | <13.8 | ... | 0.4 | ... |
| 65423† | HD 116402 | 4791808 | 6.9 | 0.2 | 4.3 | 10.5 | <40.4 | ... | 0.5 | ... |
| 65517† | HD 116650 | 4792064 | 4.9 | 0.1 | 4.3 | 2.7 | <34.4 | ... | 0.5 | ... |
| 65617† | HD 116794 | 22795520 | 3.6 | 0.2 | 3.3 | 1.2 | <36.5 | ... | 0.4 | ... |
| 65875 | HD 117214 | 4792320 | 188.7 | 0.2 | 12.6 | 45.5 | 330 | 20 | 1.4 | 11.0 |
| 65891 | HD 117253 | 4792576 | 125.3 | 0.2 | 127.8 | −0.6 | <53.3 | ... | 14.1 | ... |
| 66285† | HD 117945 | 4792832 | 11.1 | 0.2 | 11.1 | −0.1 | <63.2 | ... | 1.2 | ... |
| 66782 | HD 118962 | 4793088 | 143.1 | 0.1 | 145.1 | −0.4 | 44 | 7 | 16.0 | 3.7 |
| 66941 | HD 119022 | 4793344 | 39.1 | 0.1 | 37.4 | 1.2 | <28.3 | ... | 4.1 | ... |
| 67003 | HD 119341 | 22797312 | 75.7 | 0.2 | 81.7 | −2.1 | <17.1 | ... | 9.0 | ... |
| 67068† | HD 119511 | 4793600 | 9.9 | 0.1 | 7.3 | 7.8 | <35.0 | ... | 0.8 | ... |
| 67230† | HD 119718 | 22798080 | 42.1 | 0.9 | 12.7 | 22.2 | <160.9 | ... | 1.4 | ... |
| 67428† | HD 120178 | 4794112 | 11.8 | 0.2 | 6.5 | 15.3 | <32.6 | ... | 0.7 | ... |
| 67497 | HD 120326 | 4794368 | 87.5 | 0.2 | 7.1 | 44.6 | 162 | 8 | 0.8 | 12.1 |
| 67522† | HD 120411 | 4794624 | 4.6 | 0.1 | 4.0 | 2.8 | <24.0 | ... | 0.4 | ... |
| 67957† | HD 121176 | 4794880 | 7.0 | 0.1 | 6.4 | 2.0 | <29.7 | ... | 0.7 | ... |
| 67970 | HD 121189 | 22757376 | 26.88 | 0.08 | 6.15 | 35.5 | <25.2 | ... | 0.7 | ... |
| 68328† | CD-51 7878 | 4795136 | 6.8 | 0.2 | 6.4 | 1.3 | <40.4 | ... | 0.7 | ... |
| 68335† | HD 121835 | 4795392 | 9.9 | 0.1 | 9.5 | 1.3 | <33.5 | ... | 1.0 | ... |
| 68534† | CPD-60 5147 | 22798848 | 8 | 5 | 3.9 | 0.8 | <4670 | ... | 0.4 | ... |
| 68726 | HD 122683 | 22767104 | 62.6 | 0.2 | 67.0 | −1.8 | <20.8 | ... | 7.4 | ... |
| 69291 | HD 123889 | 4795904 | 7.5 | 0.2 | 6.2 | 4.6 | <21.1 | ... | 0.7 | ... |
| 69327 | HD 123800 | 4796160 | 7.3 | 0.1 | 5.9 | 4.8 | <35.3 | ... | 0.7 | ... |
| 69395 | HD 124092 | 22757632 | 33.5 | 0.2 | 37.5 | −3.0 | <12.4 | ... | 4.2 | ... |
| 69720 | HD 124619 | 4796416 | 9.2 | 0.2 | 5.2 | 13.5 | <39.4 | ... | 0.6 | ... |
| 70350† | HD 125912 | 4796672 | 16.4 | 0.1 | 15.7 | 1.2 | <32.8 | ... | 1.7 | ... |
| 70376† | HD 125896 | 4796928 | 6.9 | 0.2 | 6.5 | 1.4 | <42.6 | ... | 0.7 | ... |
| 70558† | HD 126318 | 4797184 | 4.3 | 0.2 | 4.0 | 1.2 | <26.7 | ... | 0.4 | ... |
| 70689† | HD 126488 | 4797440 | 7.3 | 0.1 | 7.1 | 0.5 | <28.6 | ... | 0.8 | ... |
| 70833† | HD 126838 | 4797696 | 5.4 | 0.2 | 5.5 | −0.7 | <25.6 | ... | 0.6 | ... |
| 70919 | HD 126996 | 22757888 | 26.9 | 0.2 | 28.0 | −1.1 | <15.0 | ... | 3.1 | ... |
| 71023 | HD 127236 | 22758144 | 6.21 | 0.08 | 4.70 | 7.4 | <12.2 | ... | 0.5 | ... |
| 71178† | HD 127648 | 4797952 | 5.8 | 0.2 | 5.1 | 2.8 | <25.1 | ... | 0.6 | ... |
| 71767 | HD 128893 | 22758400 | 6.21 | 0.08 | 5.76 | 2.0 | <15.5 | ... | 0.6 | ... |
| 72033† | HD 129490 | 4798208 | 7.4 | 0.2 | 7.0 | 1.5 | <31.8 | ... | 0.8 | ... |
| 72070 | HD 129590 | 22758656 | 88.39 | 0.08 | 5.55 | 45.7 | 394 | 5 | 0.6 | 14.6 |
| 72099† | HD 129683 | 22758912 | 8.53 | 0.06 | 3.20 | 25.6 | <12.1 | ... | 0.4 | ... |
| 72164 | HD 129766 | 22759168 | 4.72 | 0.08 | 4.57 | 0.8 | <12.7 | ... | 0.5 | ... |
| 73666† | HD 133075 | 4798720 | 18.5 | 0.2 | 16.5 | 3.2 | <117.2 | ... | 1.8 | ... |
| 73667 | HD 133022 | 22759424 | 6.14 | 0.08 | 6.25 | −0.5 | <13.4 | ... | 0.7 | ... |
| 73742 | HD 133117 | 22759680 | 9.6 | 0.2 | 9.5 | 0.2 | <13.8 | ... | 1.0 | ... |
| 73783 | HD 133336 | 22759936 | 163.2 | 0.2 | 165.4 | −0.4 | <19.1 | ... | 18.5 | ... |
| 74177 | HD 133904 | 22742272 | 64.2 | 0.8 | 68.7 | −1.8 | <127.6 | ... | 7.6 | ... |
| 74224 | HD 134255 | 4799488 | 195.5 | 0.2 | 199.7 | −0.5 | <54.8 | ... | 22.0 | ... |
| 74499 | HD 134888 | 4799744 | 20.3 | 0.2 | 6.3 | 28.5 | 120 | 10 | 0.7 | 9.1 |
| 74501 | HD 134672 | 22760448 | 54.3 | 0.3 | 56.4 | −1.0 | <73.1 | ... | 6.2 | ... |
| 74688† | HD 135095 | 22760704 | 65.2 | 0.6 | 73.3 | −3.1 | <109.0 | ... | 8.1 | ... |
| 74772† | CD-49 9474 | 22760960 | 2.69 | 0.07 | 2.44 | 2.2 | <30.7 | ... | 0.3 | ... |
| 74865† | HD 135778 | 4800256 | 5.8 | 0.2 | 5.5 | 1.0 | <29.9 | ... | 0.6 | ... |
| 74959 | HD 135953 | 22761216 | 6.70 | 0.08 | 3.99 | 13.6 | 68 | 5 | 0.4 | 10.4 |
| 75367† | CD-40 9577 | 4800512 | 2.4 | 0.2 | 2.1 | 1.1 | <34.8 | ... | 0.2 | ... |
| 75459† | HD 136991 | 4800768 | 7.3 | 0.2 | 7.6 | −1.1 | <32.1 | ... | 0.8 | ... |
| 75480† | HD 137130 | 4801024 | 8.1 | 0.2 | 8.2 | −0.2 | <32.5 | ... | 0.9 | ... |
| 75491 | HD 137057 | 22761472 | 26.50 | 0.09 | 7.69 | 31.6 | <28.0 | ... | 0.8 | ... |
| 75683† | HD 137499 | 4801280 | 8.0 | 0.2 | 3.3 | 18.1 | <48.9 | ... | 0.4 | ... |
| 75824 | HD 137786 | 22761728 | 5.88 | 0.08 | 5.68 | 0.9 | <32.5 | ... | 0.6 | ... |
| 75891 | HD 137888 | 22761984 | 7.16 | 0.08 | 6.84 | 1.2 | <15.5 | ... | 0.7 | ... |
| 75916† | BD-20 4244 | 4801792 | 4.2 | 0.2 | 3.8 | 1.5 | <36.3 | ... | 0.4 | ... |
| 75924† | HD 138009 | 4801536 | 13.9 | 0.2 | 13.0 | 1.8 | <28.2 | ... | 1.4 | ... |
| 75933† | HD 137991 | 22762240 | 6.2 | 0.1 | 6.0 | 0.8 | <22.2 | ... | 0.7 | ... |
| 76084 | HD 138296 | 4802048 | 7.3 | 0.2 | 7.3 | 0.2 | <35.6 | ... | 0.8 | ... |
| 76197 | HD 138398 | 4802304 | 28.2 | 0.2 | 29.7 | −1.5 | <60.4 | ... | 3.3 | ... |
| 76457 | HD 138994 | 4802560 | 9.4 | 0.2 | 9.2 | 0.7 | <29.5 | ... | 1.0 | ... |
| 76472 | HD 138995 | 22762496 | 7.87 | 0.08 | 7.44 | 1.5 | <13.8 | ... | 0.8 | ... |
| 76501† | HD 139124 | 22762752 | 8.0 | 0.1 | 7.2 | 2.5 | <15.6 | ... | 0.8 | ... |
| 76875 | HD 139883 | 4802816 | 7.9 | 0.2 | 7.8 | 0.3 | <29.2 | ... | 0.9 | ... |
| 77015 | HD 140129 | 4803072 | 3.2 | 0.2 | 3.5 | −1.6 | <26.9 | ... | 0.4 | ... |
| 77038† | HD 140241 | 4803328 | 5.2 | 0.2 | 5.0 | 0.8 | <29.5 | ... | 0.5 | ... |
| 77135† | HD 140463 | 4803584 | 2.9 | 0.2 | 4.1 | −5.5 | <38.7 | ... | 0.5 | ... |
| 77144 | HD 140421 | 22763008 | 5.9 | 0.1 | 5.2 | 3.0 | <16.3 | ... | 0.6 | ... |
| 77157† | HT Lup | 22763264 | 3650.0 | 0.4 | 22.0 | 48.7 | 3050 | 30 | 2.4 | 14.7 |
| 77432† | HD 141011 | 4803840 | 10.2 | 0.2 | 5.1 | 16.6 | <28.3 | ... | 0.6 | ... |
| 77502† | HD 141313 | 22763520 | 5.96 | 0.09 | 5.12 | 3.9 | <15.2 | ... | 0.6 | ... |
| 77520† | HD 141254 | 4804096 | 6.5 | 0.2 | 4.6 | 7.2 | <29.6 | ... | 0.5 | ... |
| 77713 | HD 141759 | 4804352 | 4.1 | 0.2 | 4.1 | −0.1 | <29.6 | ... | 0.5 | ... |
| 77780 | HD 141803 | 22763776 | 5.1 | 0.1 | 5.0 | 0.8 | <38.2 | ... | 0.5 | ... |
| 77813 | HD 142113 | 4804608 | 10.1 | 0.2 | 9.3 | 2.0 | <32.2 | ... | 1.0 | ... |
| 78043† | HD 142446 | 22764032 | 13.0 | 0.1 | 4.8 | 25.6 | 75 | 5 | 0.5 | 10.4 |
| 78133† | CD-41 10454 | 22764288 | 2.5 | 0.1 | 2.4 | 0.2 | <25.0 | ... | 0.3 | ... |
| 78432 | HD 143138 | 22764544 | 75.6 | 0.2 | 87.7 | −4.0 | <31.2 | ... | 9.7 | ... |
| 78555 | HD 143538 | 4804864 | 6.8 | 0.2 | 5.8 | 3.3 | <61.7 | ... | 0.6 | ... |
| 78581† | HD 143637 | 4805120 | 7.0 | 0.2 | 6.9 | 0.4 | <36.4 | ... | 0.8 | ... |
| 78663† | HD 143811 | 4805376 | 8.4 | 0.2 | 6.1 | 7.8 | <32.0 | ... | 0.7 | ... |
| 78684 | HD 143677 | 4805632 | 10.2 | 0.2 | 9.2 | 2.7 | <50.8 | ... | 1.0 | ... |
| 78881† | HD 144225 | 4806888 | 14.6 | 0.2 | 14.2 | 0.6 | <42.6 | ... | 1.6 | ... |
| 78977 | HD 144548 | 4806144 | 15.4 | 0.2 | 11.4 | 8.0 | <33.8 | ... | 1.3 | ... |
| 79054† | HD 144729 | 4806400 | 8.2 | 0.2 | 5.6 | 8.3 | <32.6 | ... | 0.6 | ... |
| 79252† | HD 145208 | 4806656 | 11.0 | 0.2 | 10.0 | 2.4 | <32.0 | ... | 1.1 | ... |
| 79258† | HD 145132 | 4806912 | 3.8 | 0.2 | 3.8 | −0.3 | <63.8 | ... | 0.4 | ... |
| 79288 | HD 145263 | 4807168 | 425.9 | 0.2 | 5.2 | 48.4 | 150 | 10 | 0.6 | 9.8 |
| 79369 | HD 145467 | 4807424 | 7.6 | 0.2 | 7.2 | 1.2 | <31.6 | ... | 0.8 | ... |
| 79516 | HD 145560 | 4807680 | 49.1 | 0.3 | 5.5 | 41.3 | 320 | 20 | 0.6 | 10.7 |
| 79610† | HD 145839 | 4807936 | 5.2 | 0.2 | 5.7 | −1.9 | <38.7 | ... | 0.6 | ... |
| 79673† | HD 145984 | 22764800 | 8.1 | 0.1 | 5.3 | 10.4 | <28.7 | ... | 0.6 | ... |
| 79710† | HD 145972 | 22765056 | 19.9 | 0.9 | 6.5 | 13.5 | <175.9 | ... | 0.7 | ... |
| 79742 | HD 146181 | 4808704 | 29.4 | 0.2 | 4.3 | 39.3 | 170 | 10 | 0.5 | 9.5 |
| 79908† | HD 146610 | 4808960 | 6.6 | 0.2 | 6.1 | 1.5 | <41.6 | ... | 0.7 | ... |
| 79910† | HD 146743 | 4809216 | 7.7 | 0.2 | 7.3 | 1.2 | <32.6 | ... | 0.8 | ... |
| 79977† | HD 146897 | 4809472 | 146.8 | 0.2 | 5.6 | 47.0 | 530 | 10 | 0.6 | 14.0 |
| 80320 | HD 147594 | 4809728 | 10.0 | 0.2 | 6.4 | 11.2 | <34.0 | ... | 0.7 | ... |
| 80535 | HD 148040 | 4809984 | 11.0 | 0.2 | 9.4 | 3.7 | <74.9 | ... | 1.0 | ... |
| 80586 | HD 148153 | 4810240 | 9.9 | 0.2 | 9.6 | 0.7 | <102.4 | ... | 1.1 | ... |
| 80636† | HD 148187 | 4810496 | 7.5 | 0.2 | 6.7 | 2.7 | <37.3 | ... | 0.7 | ... |
| 80663† | HD 330719 | 22765312 | 2.1 | 0.5 | 2.4 | −0.7 | <118.7 | ... | 0.3 | ... |
| 80921 | HD 328333 | 22765568 | 12.1 | 0.3 | 2.4 | 25.1 | <54.1 | ... | 0.3 | ... |
| 81136 | HD 149090 | 22754048 | 64.9 | 0.2 | 73.0 | −3.2 | <29.3 | ... | 8.0 | ... |
| 81380 | HD 149551 | 4811008 | 5.2 | 0.2 | 4.7 | 1.6 | <56.5 | ... | 0.5 | ... |
| 81447 | HD 149735 | 22765824 | 11.0 | 0.1 | 6.9 | 12.5 | <28.2 | ... | 0.8 | ... |
| 81455† | HD 149790 | 4811264 | 4.4 | 0.2 | 4.5 | −0.3 | <31.3 | ... | 0.5 | ... |
| 81775† | HD 150418 | 22766080 | 4.4 | 0.1 | 4.6 | −0.6 | <16.9 | ... | 0.5 | ... |
| 81851† | HD 150589 | 4811520 | 7.3 | 0.2 | 7.1 | 0.7 | <35.9 | ... | 0.8 | ... |
| 82135 | HD 151078 | 22767360 | 377.6 | 0.6 | 397.2 | −1.4 | <141.3 | ... | 43.8 | ... |
| 82218 | HD 151376 | 4811776 | 12.3 | 0.2 | 5.6 | 18.7 | <28.8 | ... | 0.6 | ... |
| 82534 | HD 152057 | 4812032 | 8.2 | 0.2 | 8.2 | 0.1 | <38.8 | ... | 0.9 | ... |
| 82569† | HD 152041 | 22766336 | 7.0 | 0.5 | 7.0 | 0.0 | <75.3 | ... | 0.8 | ... |
| 82747 | AK Sco | 4812544 | 3343.0 | 0.3 | 20.3 | 48.7 | 3150 | 20 | 2.2 | 14.8 |
| 83159† | HD 153232 | 4812800 | 8.1 | 0.4 | 4.9 | 6.9 | <94.7 | ... | 0.5 | ... |
Notes. †Source suffers some contamination at 24 μm. ‡σF24 and σF70 are the statistical uncertainties in the 24 and 70 μm photometry. The total uncertainty can be calculated by adding the systematic, repeatability, and calibration uncertainties in quadrature (see Section 2.1).
The photometry reported here supercedes previously published photometry because (1) the absolute calibrations for the 24 μm and 70 μm detectors and (2) the optimal technique for measuring the brightness of point sources have been refined since Chen et al. (2005). They used preliminary calibrations for 24 μm and 70 μm photometry (1.042 μJy (DN s−1)−1 and 15.8 mJy (DN s−1)−1 at 24 μm and 70 μm, respectively) and aperture photometry to measure the brightness of point sources. They used a large aperture (with radii 15'' and 295 at 24 μm and 70 μm, respectively) and a large background annulus (with inner radii of 30'' and 40'' and outer radii of 43'' and 80'' at 24 μm and 70 μm, respectively) that was sensitive to confusion from nearby sources and diffuse background emission. Engelbracht et al. (2007) reported the final calibration for the 24 μm detector (1.067 μJy (DN s−1)−1) and determined that PSF fitting is the most reliable technique for measuring the flux of point sources. The use of PSF fitting for the photometry reported here is especially important for ScoCen sources because these sources are often located in regions with moderate diffuse emission.
2.2. MIKE Observations
We obtained visual spectra for a subsample of 181 candidate ScoCen members in single and binary systems using the MIKE spectrograph (Bernstein et al. 2003) on the 6.5 m Magellan Clay Telescope at Las Campanas Observatory on 2007 March 11 and 2009 April 15 and 16 (UT). We used the 035 × 5'' slit which gave a resolution of ∼55,000 over the wavelength range of 3200–10000 Å. We used the MIKE pipeline written by D. Kelson (Kelson 2003) to produce flat-fielded, extracted, and wavelength-calibrated spectra.
We measured heliocentric radial velocities from 44 different spectral orders using the RVCORRECT and FXCOR packages in IRAF. For each star, we list the average radial velocity and the standard error of the mean in Table 1. We fit synthetic spectra to our data to determine the projected rotational velocity (v sin i). To avoid telluric contamination, we restrict the fitting region to 4000–7000 Å. We used Richard Gray's spectral synthesis program, SPECTRUM5 along with Kurucz model atmospheres of solar metallicity to create synthetic spectra that were subsequently broadened using the rotational profile given in Gray (1992). We performed a χ2 minimization fitting to each spectrum to find the best value for v sin i.
We quantified the stellar activity by estimating the calcium H and K activity index, following the prescription outlined in Duncan et al. (1991) and White et al. (2007). First, we computed the index of core emission as defined in White et al. (2007). Then, we calculated the chromospheric emission ratio, R'HK using the Noyes et al. (1984) prescription. This conversion requires the stellar B−V color which we obtained from the Tycho-2 catalog (Høg et al. 2000) and translated to Johnson B−V colors. We did not observe any calcium standards at the time that our observations were made; therefore, our values are not calibrated and are systematically offset from those obtained by Duncan et al. (1991) and White et al. (2007). For example, we estimate that HIP 66941/HD 119022 possesses an R'HK = −4.3, somewhat lower than the values calibrated in the Mt. Wilson system (Mamajek & Hillenbrand 2008; −4.03 and −4.06). Since our R'HK values are not calibrated, we annotate objects with core Ca ii H and K emission in Table 1.
3. STELLAR MEMBERSHIP
Since the dZ99 analysis was published, we have obtained stellar radial velocities for the majority of the candidate ScoCen members and van Leeuwen (2007) have rereduced the Hipparcos data and re-derived the parallaxes for all of the stars in the Hipparcos catalog. Therefore, we re-examine ScoCen membership for the targets in our MIPS sample using (1) new and previously published lithium abundance measurements, (2) previously published stellar spectral types and new stellar luminosity estimates (based on the updated van Leeuwen 2007 distances), (3) our new radial velocity measurements, and (4) previously published Hipparcos proper motions (see Table 1). We list our best estimates for stellar spectral type (drawn from the literature) and updated distances (drawn from van Leeuwen 2007) for the single and binary target systems in our MIPS sample in Table 1. No published spectral types existed for the secondary stars in the binary systems we observed; therefore, we determined their spectral types by convolving our MIKE spectra to a lower resolution (R ∼ 1000) and comparing them with SMARTS 1.5 m spectral standards. We calculated the reddening implied by our spectral types and found that it was consistent with that estimated for other stars in our sample (AV ∼ 0.1). We estimated that the uncertainty for these spectral types is two subtypes.
The presence of strong lithium absorption in the spectra of late-type stars has long been used as a diagnostic of stellar youth (e.g., Herbig 1965). Mamajek et al. (2002) measured Li 6707 Å equivalent widths toward 30 G- through K-type dZ99 candidate UCL and LCC members to determine whether the lithium observed toward these stars was consistent with youth and therefore membership in ScoCen. By plotting the lithium equivalent width for these stars as a function of spectral type and comparing their observations with those of other young clusters (e.g., IC 2602 at 30 Myr, the Pleiades at 70–125 Myr, and M34 at 250 Myr), Mamajek et al. (2002) concluded that the lithium abundances toward HIP 63797, HIP 68726, HIP 74501, HIP 77015, HIP 79610, and HIP 81775 were too small to be consistent with ScoCen membership. More recent spectroscopic observations of HIP 56420, HIP 65891, HIP 66285, HIP 66782, HIP 70833, HIP 75916, and HIP 76197 suggest that the lithium abundances for these sources or their cooler companions (HIP 70833B and HIP 66285B) are also too small to be consistent with ScoCen membership (M. Pecaut 2010, private communication). We measured lithium equivalent widths from our Magellan/MIKE spectra and plotted their values as a function of stellar effective temperature (see Figure 1). Stars with Teff < 6000 K and EQ(Li) <60 mÅ are inconsistent with ScoCen membership and possess lithium membership flags (Li) set to "N" in Table 1. Stars with 6000 K < Teff < 6600 K and EQ(Li) <40 mÅ or 6600 K < Teff < 7200 K and EQ(Li) <20 mÅ are not lithium-rich and possess lithium membership flags (Li) set to "Y?" in Table 1.

Figure 1. Measured Magellan/MIKE Li i λ6707 EWs. Stars above the line are considered lithium-rich. Stars with Teff < 6000 K and EW(Li) < 60 mÅ are excluded as members ("N") in the "Li" column of Table 1. Stars with 6000 K < Teff < 6600 K and EW(Li) < 40 mÅ or 6600 K < Teff < 7200 K and EW(Li) < 20 mÅ are marked as possible members ("Y?") in the "Li" column of Table 1.
Download figure:
Standard image High-resolution imageWe examined the measured spectral types, distances, and stellar luminosities to determine whether measured stellar properties are consistent with ScoCen membership. Stars with spectral types and luminosities consistent with ScoCen membership possess stellar luminosity membership flags (L*) set to "Y" in Table 1. Giant stars with luminosity class III are expected to be significantly older than the mean ScoCen subgroup ages and therefore to be interlopers. We plot the Hertzsprung–Russell diagram (HRD) positions for all of the giant stars in our sample (see Figure 2). We estimate stellar effective temperatures from stellar spectral types using the Kenyon & Hartmann (1995) conversion. We calculate stellar luminosities from extinction-corrected V-band magnitudes, Hipparcos distances, and Flower (1996) bolometric corrections. The HRD positions for the majority of giant stars are consistent with an older age; however, three F-type giants have HRD positions that are inconsistent with their luminosity class: HIP 56227, HIP 62428, and HIP 72164. HIP 56227 is a F0III star (Houk & Cowley 1975); however, its HRD position is clearly near the zero-age main-sequence (ZAMS) therefore we have set its luminosity membership flag to "Y" in Table 1. HIP 62428 is a F0III star (Houk & Cowley 1975); its HRD position is consistent with the DM97 1 Myr isochrone, significantly above the other ScoCen F-stars. Since this star does not appear to have an age of 1 Myr—it is not embedded and does not possess an infrared excess, we set its L* flag to "N." HIP 72164 is a F2III/IV star (Houk 1982); however, its HRD position (with large errors) is consistent with the ZAMS therefore we have set its L* flag to "Y."

Figure 2. Hertzsprung–Russell diagram showing the estimated stellar luminosities and effective temperatures for all of the giant stars in our sample (open circles), marked with "N" or "N?" in the "L*" column of Table 1. Overlaid are D'Antona & Mazzitelli (1997) pre-main-sequence tracks for 0.6, 0.8, 1.0, 1.4, and 2.0 M☉ stars (dotted lines) and isochrones (solid lines) and Girardi et al. (2002) evolved star tracks (dashed lines).
Download figure:
Standard image High-resolution imageWe calculated updated UVW velocities for the subgroup members of de Zeeuw et al. (1999), using their updated Hipparcos positions, parallaxes, and proper motions (van Leeuwen 2007), previously published radial velocities (Gontcharov 2006), and the new radial velocity measurements described here. With these revised UVW velocities, we calculated new mean subgroup velocities using an iterative clip to remove obvious outliers. The new subgroup velocities are listed in Table 3, and represent the most precise modern values ever calculated, taking into account the best available astrometry and radial velocities. We also compared the projected and radial motions of the stars to that for an "ideal" member following the convergent point techniques discussed in Mamajek (2005). In our calculations, we assumed that the intrinsic one-dimensional velocity dispersion of each subgroup is 1.3 km s−1, based on the results of de Bruijne (1999) and Madsen et al. (2002). We flagged any star with a radial velocity more than 3σ away from its predicted radial velocity, based on the star's position and subgroup membership, with a "Y?" in the RV Membership column of Table 1. We could not exclude stars with inconsistent radial velocities as non-members because we obtained only one epoch of MIKE data for each star; stars with inconsistent measured radial velocities may be members of binary or multiple systems. A second epoch of measured radial velocities is needed for stars with discrepant radial velocities to determine whether they are members of multiple systems or interlopers. Similarly, we flagged any star with a proper motion more than 2σ away from its predicted proper motion with a "Y?" in the PM Membership column of Table 1. In our analysis, we defined proper motion as the velocity in the plane of the sky that is perpendicular to the velocity toward the convergent point. One system (HIP 62677) possesses a 3σ discrepant proper motion; however, we do not reject this system because it is a member of a wide binary system with measured orbital motion during the past century.
Table 3. Updated Velocities for ScoCen Subgroups
| Group | U | V | W | S |
|---|---|---|---|---|
| ⋅⋅⋅ | (km s−1) | (km s−1) | (km s−1) | (km s−1) |
| US | −6.4 ± 0.5 | −15.9 ± 0.7 | −7.4 ± 0.2 | 18.7 ± 0.6 |
| UCL | −5.1 ± 0.6 | −19.7 ± 0.4 | −4.6 ± 0.3 | 20.9 ± 0.5 |
| LCC | −7.8 ± 0.5 | −20.7 ± 0.6 | −6.0 ± 0.3 | 22.9 ± 0.5 |
Download table as: ASCIITypeset image
Based on lithium, stellar luminosity, radial velocity, and proper motion membership flags, we made a summary assessment of the likelihood of ScoCen membership for all of the stars in our sample. Stars with any membership flag set to "N" possess a final membership flag of "N." We find that 0/17 Upper Sco, 18/86 UCL, and 13/81 LCC candidate single and binary systems in our sample are excluded as members. Combining all of the ScoCen MIPS observations together, our final sample is composed of 27 members of Upper Sco (including 21 F-type and 6 G-type members), 69 members of UCL (including 56 F-type, 12 G-type, and 2 K-type members), and 71 members of LCC (including 59 F- and 11 G-type members).
4. DISK FRACTIONS
We estimate the stellar photospheric fluxes for our sample based on Two Micron All Sky Survey (2MASS; Cutri et al. 2003) Ks-band magnitudes and intrinsic main-sequence colors calculated by E. Mamajek.6 First, we assembled the Hipparcos B- and V-band photometry, Cousins I-band photometry (where available), and 2MASS J-, H-, and Ks-band photometry and constructed measured B−V, V − Ic, V−J, V−H, and V − Ks colors for each star. Second, we calculated the extinction in each color assuming that the stars possess intrinsic main-sequence colors. Third, we calculated an average visual extinction, AV, and its uncertainty based on the standard deviation of the extinction measurements. Fourth, we extrapolated the average AV to the Ks band assuming that AK = 0.116 AV, consistent with RV = 3.1 and a Cardelli et al. (1989) extinction law. Fifth, we corrected the measured 2MASS Ks-band magnitudes for extinction. Finally, we used Kurucz models to estimate the predicted 24 μm and 70 μm fluxes based on the extinction-corrected Ks-band magnitudes and stellar spectral types, assuming the Kenyon & Hartmann (1995) conversion between spectral type and effective temperature. For example, a star with Teff = 7200 K, is expected to possess Fν(Ks)/Fν(24 μm) = 93.9 and Fν(Ks)/Fν(70 μm) = 857.7.
For comparison with our measured (but not color-corrected) fluxes, we list the predicted photospheric 24 and 70 μm fluxes integrated over the MIPS bandpasses, Fν, in Table 2. We calculate the excess significance of each detected source, χ = (measured flux−predicted flux)/uncertainty, where the uncertainty includes absolute calibration uncertainty (2%), repeatability uncertainty (0.4%), the photospheric model uncertainty (∼3%), and statistical uncertainty of the 24 μm photometry summed in quadrature. We list excess objects with χ ⩾ 7 at 24 and/or 70 μm in Table 4. We verify our stellar atmosphere model fits by examining the Ks−[24] colors of our sources. All of our excess sources possess Ks−[24] > 0.3 mag. We plot the Ks−[24] color as a function of J − H color (as a proxy for spectral type) for all of the sources in our study in Figure 3. We show the distribution of significance of the 24 μm excesses (χ24 = (measured Fν(24 μm)−predicted Fν(24 μm))/measured σF24) in Figure 4. Our Ks−[24] selection criteria robustly identified sources with large excesses but may not identify sources with weaker excesses.

Figure 3. Ks − [24] color plotted as a function of J − H color for each subgroup of the Scorpius-Centaurus OB association: Upper Scorpius (US), Upper Centaurus Lupus (UCL), and Lower Centaurus Crux (LCC). Our sample of 125 F- and G-type members is shown with solid circles; the Su et al. (2006) sample of A-type members is shown with open circles; the Carpenter et al. (2009a) sample of F- and G-type members is shown with open stars; and the Carpenter et al. (2009b) US sample is shown with circled crosses. The solid line shows the expected colors of main-sequence stars, extrapolated from Nextgen models with solar metallicity and log g = 4.0. The dotted lines show a 3σ deviation in Ks − [24] color from the main sequence (0.15 mag). Note: AK Sco (UCL) and PDS 66 (LCC), which possess primordial disks, are not shown.
Download figure:
Standard image High-resolution image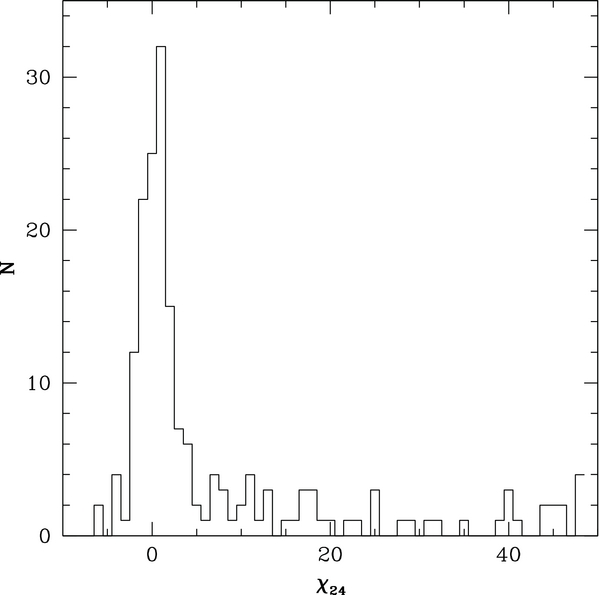
Figure 4. Histogram of the significances (χ = (Fν(24 μm)−F*(24 μm))/σF24) of observed 24 μm excesses. The histogram includes all sources in our study regardless of the membership in ScoCen. Sources with χ ⩾ 7 also possess Ks − [24] > 0.30 mag and were identified as having significant excesses.
Download figure:
Standard image High-resolution imageTable 4. Single-temperature Blackbody Model Parameters
| HIP | Name | Teff | L* | M*a | tage | Tgr | LIR/L* | amin | D | Mdust | MPB |
|---|---|---|---|---|---|---|---|---|---|---|---|
| (K) | (L☉) | (M☉) | (Myr) | (K) | (μm) | (AU) | (Mmoon) | (Mmoon) | |||
| Upper Scorpius | |||||||||||
| 78663 | HD 143811 | 6440 | 4.9+2.0−1.4 | 1.5 | 10 | >68 | 3.8 × 10⁻⁵ | 1.4 | <90 | 0.013 | >0.01 |
| 78977 | HD 144548 | 6280 | 5.0+1.6−1.2 | 1.5 | 10 | >75 | 4.2 × 10⁻⁵ | 1.4 | <67 | 0.0082 | >0.02 |
| 79054 | HD 144729 | 7200 | 5.5+1.9−1.4 | 1.5 | 10 | >69 | 3.5 × 10⁻⁵ | 1.5 | <84 | 0.011 | >0.01 |
| 79288b | HD 145263 | 7200 | 6.4+2.3−1.7 | 1.6 | 10 | 230 | 1.0 × 10⁻³ | 1.6 | 3 | 0.0042 | >5 |
| 79977 | HD 146897 | 6815 | 3.7+1.1−1.1 | 2.1c | 10 | 89 | 5.9 × 10⁻³ | 0.9 | 40 | 0.27 | >2 |
| 80320 | HD 147594 | 5830 | 3.4+1.4−1.0 | 1.4 | 10 | >73 | 8.2 × 10⁻⁵ | 1.0 | <74 | 0.014 | >0.02 |
| 82218 | HD 151376 | 6815 | 4.5+1.6−1.2 | 1.5 | 10 | >86 | 1.1 × 10⁻⁴ | 1.5 | <38 | 0.0072 | >0.04 |
| Upper Centaurus Lupus | |||||||||||
| 67497 | HD 120326 | 7200 | 4.4+0.9−0.8 | 1.6c | 15 | 105 | 1.5 × 10⁻³ | 1.1 | 25 | 0.031 | >0.7 |
| 67970 | HD 121189 | 6740 | 3.8+1.2−0.9 | 1.5c | 15 | >120 | 3.0 × 10⁻⁴ | 1.0 | <16 | 0.0024 | >0.1 |
| 69720 | HD 124619 | 7200 | 5.0+1.6−1.2 | 1.6c | 15 | >72 | 5.3 × 10⁻⁵ | 1.3 | <78 | 0.013 | >0.03 |
| 71023 | HD 127236 | 7200 | 10.1+4.8−3.2 | 1.9 | 15 | >75 | 2.3 × 10⁻⁵ | 2.0 | <70 | 0.0071 | >0.03 |
| 72070 | HD 129590 | 5945 | 2.8+1.5−1.0 | 1.3 | 15 | 84 | 6.3 × 10⁻³ | 0.9 | 47 | 0.40 | >2 |
| 72099 | HD 129683 | 6360 | 3.0+2.0−1.2 | 1.4 | 15 | >100 | 1.7 × 10⁻⁴ | 0.9 | <27 | 0.0035 | >0.06 |
| 74499 | HD 134888 | 6590 | 2.1+0.5−0.4 | 1.5c | 15 | 75 | 9.8 × 10⁻⁴ | 0.6 | 100 | 0.018 | >0.2 |
| 74959 | HD 135953 | 6440 | 2.7+1.1−0.8 | 1.3 | 15 | 62 | 8.1 × 10⁻⁴ | 0.9 | 120 | 0.33 | >0.2 |
| 75491 | HD 137057 | 6740 | 9.6+3.6−2.6 | 1.9 | 15 | >110 | 2.1 × 10⁻⁴ | 1.9 | <21 | 0.0057 | >0.2 |
| 75683 | HD 137499 | 6740 | 2.8+2.5−1.3 | 1.5c | 15 | >72 | 1.2 × 10⁻⁴ | 0.8 | <85 | 0.022 | >0.04 |
| 77157 | CD-33 10685 | 4730 | 5.0+6.1−2.8 | 1.1 | 15 | 140 | 6.8 × 10⁻² | 2.0 | 9 | 0.35 | >40 |
| 77432 | HD 141011 | 6440 | 1.9+0.6−0.4 | 1.4c | 15 | >81 | 9.5 × 10⁻⁵ | 0.6 | <55 | 0.00054 | >0.02 |
| 77520 | HD 141254 | 6740 | 1.9+0.6−0.5 | 1.5 | 15 | >67 | 3.8 × 10⁻⁵ | 0.6 | <28 | 0.000055 | >0.008 |
| 78043 | HD 142446 | 6740 | 4.7+2.2−1.5 | 1.5 | 15 | 74 | 6.9 × 10⁻⁴ | 1.3 | 67 | 0.13 | >0.4 |
| 79516 | HD 145560 | 6440 | 3.8+1.4−1.0 | 1.4 | 15 | 77 | 3.4 × 10⁻³ | 1.1 | 64 | 0.47 | >1 |
| 79673 | HD 145984 | 6890 | 3.3+1.0−0.8 | 1.5c | 15 | >72 | 4.4 × 10⁻⁵ | 0.7 | <97 | 0.0095 | >0.02 |
| 79710 | HD 145972 | 7200 | 5.8+1.9−1.4 | 1.6 | 15 | >69 | 1.4 × 10⁻⁴ | 1.5 | <89 | 0.053 | >0.09 |
| 79742 | HD 146181 | 6360 | 3.7+2.1−1.3 | 1.4 | 15 | 78 | 2.3 × 10⁻³ | 1.1 | 60 | 0.28 | >0.9 |
| 80921 | HD 328333 | 6890 | 1.2+0.8−0.5 | 1.5c | 15 | >81 | 3.8 × 10⁻⁴ | 0.5 | <50 | 0.014 | >0.05 |
| 81447 | HD 149735 | 5988 | 6.5+3.5−2.3 | 1.7 | 15 | >78 | 8.1 × 10⁻⁵ | 1.6 | <60 | 0.015 | >0.06 |
| 82747b | AK Sco | 6440 | 4.7+3.4−2.0 | 1.5 | 15 | 135 | 4.0 × 10⁻² | 1.3 | 12 | 0.24 | >20 |
| Lower Centaurus Crux | |||||||||||
| 56673 | HD 101088 | 6440 | 17.7+2.11.9 | 2.2 | 17 | >110 | 3.5 × 10⁻⁵ | 2.9 | <27 | 0.0023 | >0.08 |
| 57524 | HD 102458 | 6115 | 1.9+0.5−0.4 | 1.2 | 17 | >82 | 7.0 × 10⁻⁵ | 0.7 | <49 | 0.0038 | >0.02 |
| 57950 | HD 103234 | 6890 | 3.9+0.7−0.6 | 1.5c | 17 | >90 | 8.0 × 10⁻⁵ | 1.1 | <39 | 0.0042 | >0.04 |
| 58220 | HD 103703 | 6740 | 3.3+0.7−0.6 | 1.5c | 17 | >100 | 2.0 × 10⁻⁴ | 0.9 | <29 | 0.0047 | >0.08 |
| 58528 | HD 104231 | 6440 | 3.7+1.0−0.8 | 1.4 | 17 | >84 | 1.0 × 10⁻⁴ | 1.1 | <48 | 0.0080 | >0.05 |
| 59693 | HD 106389 | 6360 | 2.3+1.0−0.7 | 1.3 | 17 | >81 | 1.2 × 10⁻⁴ | 0.8 | <54 | 0.0089 | >0.04 |
| 59960 | HD 106906 | 6440 | 5.1+0.7−0.7 | 1.5 | 17 | 93 | 1.3 × 10⁻³ | 1.4 | 34 | 0.067 | >0.8 |
| 60348 | HD 107649 | 6440 | 2.1+0.9−0.6 | 1.4c | 17 | >82 | 9.6 × 10⁻⁵ | 0.7 | <51 | 0.0057 | >0.03 |
| 61049 | HD 108857 | 6280 | 3.1+0.7−0.6 | 1.4 | 17 | >130 | 3.4 × 10⁻⁴ | 1.0 | <13 | 0.0019 | >0.1 |
| 61087 | HD 108904 | 6360 | 5.0+0.7−0.7 | 1.5 | 17 | >120 | 6.9 × 10⁻⁴ | 1.4 | <15 | 0.0067 | >0.4 |
| 62134 | HD 110634 | 6890 | 3.7+1.1−0.9 | 1.5c | 17 | >74 | 3.8 × 10⁻⁵ | 1.0 | <74 | 0.0066 | >0.02 |
| 62427 | HD 111103 | 6200 | 3.2+1.3−0.9 | 1.4 | 17 | >82 | 1.6 × 10⁻⁴ | 1.0 | <50 | 0.013 | >0.07 |
| 62657 | HD 111520 | 6400 | 2.6+0.7−0.5 | 1.3 | 17 | 81 | 2.2 × 10⁻³ | 1.0 | 48 | 2.0 | >0.8 |
| 63439 | HD 112810 | 6590 | 3.5+1.3−0.9 | 1.4 | 17 | 67 | 1.0 × 10⁻³ | 1.0 | 100 | 0.33 | >0.5 |
| 63836 | HD 113524 | 6280 | 2.3+0.6−0.5 | 1.3 | 17 | >70 | 5.8 × 10⁻⁵ | 0.8 | <85 | 0.010 | >0.02 |
| 63886 | HD 113556 | 6890 | 4.9+1.2−1.0 | 1.5 | 17 | 66 | 7.6 × 10⁻⁴ | 1.4 | 97 | 0.31 | >0.5 |
| 63975b | HD 113766 | 6590 | 12+4−2 | 1.9 | 17 | 290 | 1.7 × 10⁻² | 2.3 | 3 | 0.011 | >30 |
| 64184 | HD 114082 | 6740 | 3.2+0.6−0.5 | 1.5c | 17 | 110 | 3.0 × 10⁻³ | 0.9 | 21 | 0.038 | >1 |
| 64877 | HD 115361 | 6440 | 5.0+1.5−1.1 | 1.5 | 17 | >67 | 1.4 × 10⁻⁵ | 1.4 | <94 | 0.055 | >0.09 |
| 64995 | HD 115600 | 6890 | 4.8+1.1−0.9 | 1.5 | 17 | 110 | 1.7 × 10⁻³ | 1.3 | 21 | 0.032 | >1 |
| 65423 | HD 116402 | 6030 | 2.0+1.1−0.7 | 1.2 | 17 | >67 | 7.5 × 10⁻⁵ | 0.7 | <96 | 0.016 | >0.02 |
| 65875 | HD 117214 | 6360 | 5.6+1.4−1.1 | 1.6 | 17 | 110 | 2.5 × 10⁻³ | 1.5 | 22 | 0.057 | >2 |
| 67068 | HD 119511 | 6740 | 2.7+0.6−0.5 | 1.5c | 17 | >68 | 3.1 × 10⁻⁵ | 0.8 | <99 | 0.0074 | >0.01 |
| 67230 | HD 119718 | 6440 | 8.7+2.2−1.8 | 1.8 | 17 | >82 | 2.2 × 10⁻⁴ | 1.8 | <54 | 0.0037 | >0.2 |
| 67428 | HD 120178 | 6440 | 4.0+1.3−1.0 | 1.5 | 17 | >80 | 8.2 × 10⁻⁵ | 1.1 | <59 | 0.0097 | >0.04 |
Notes. aMasses estimated using HR diagram fitting with D'Antona & Mazzitelli (1997) isochrones may be systematically underestimated by 25% (Hillenbrand & White 2004). bSilicate emission features. cMass estimated using assumed age (tage) rather than isochrone fitting.
Nineteen of our fifty-three 24 μm excess sources are also detected at 70 μm. Since our 70 μm integration times were short, all of the objects detected at 70 μm possess strong 70 μm excesses. Two additional sources were detected at 70 μm that apparently do not possess a 24 μm excesses (HIP 62657 and HIP 66782). HIP 67782 is probably not a member of ScoCen because it is a class III giant. We plot the Ks−[70] color as a function of J − H color for all of the sources in our study in Figure 5. In general, our results are consistent with those reported earlier (Chen et al. 2005). All of the 24 μm excess sources identified in the preliminary survey are reidentified here as excess sources with the exception of HIP 62428 (HD 111102) and HIP 73666 (HD 133075). Improvements in data processing have allowed us to revise the 24 μm fluxes for these objects downward by 36% and 20%, respectively. Improvements in photosphere modeling have allowed us to revise the 24 μm photosphere estimates upward 18% and 4%, respectively. All of the 70 μm excess sources identified in the preliminary survey are reidentified here as excess sources.

Figure 5. Ks − [70] color plotted as a function of J − H color for each subgroup of ScoCen. The symbols have the same meaning as in Figure 4. All objects that were not detected are represented by upper limit symbols. Note: AK Sco (UCL) and PDS 66 (LCC), which possess optically thick, primordial disks are not shown.
Download figure:
Standard image High-resolution imageRecent Spitzer Infrared Spectrograph spectra have revealed a lack of 10 and 20 μm silicate features around debris disks, suggesting that the grains in these systems have diameters larger than 10 μm (Jura et al. 2004; Chen et al. 2006) and the infrared excesses can be fit using single-temperature blackbodies if the grains are located in rings around their parent stars. For each 24 μm plus 70 μm excess source, we fit the MIPS 24 μm and 70 μm excess fluxes with a single-temperature blackbody, Tgr (see Table 4), and infer color temperatures Tgr = <40–290 K and fractional infrared luminosities LIR/L* = 7 × 10⁻⁴ to 3 × 10⁻³. For each 24 μm excess only source, we cannot constrain the color temperatures without additional infrared excess detections at other wavelengths; however, we estimate grain temperature lower limits. Our 70 μm flux upper limits suggest that the color temperatures for these sources are consistent with those typically measured toward debris disks. For these sources, we infer infrared dust luminosities assuming that FIR ∼ νFν(24 μm).
We measure F+G-type 24 μm disk fractions for each of the ScoCen subgroups, excluding non-members: 7/17 (41% ± 16%) for US (∼10 Myr), 21/66 (32% ± 7%) for UCL (∼15 Myr), and 25/69 (36% ± 7%) for LCC (∼17 Myr). We combine our dZ99 US F+G sample with that of Carpenter et al. (2009b) to determine a complete dZ99 US F+G disk fraction. Since the dZ99 Hipparcos study, additional F+G ScoCen members have been identified via X-ray activity searches; however, we do not include these systems in our statistics because X-ray selection may impact the presence or absence of infrared excess (Chen et al. 2005). We discovered 24 μm excesses around 6/13 F- and 1/4 G-type dZ99 US stars; Carpenter et al. (2009b) discovered 24 μm excesses around 1/8 F- and 1/2 G-type dZ99 US stars, suggesting a combined dZ99 US F+G 24 μm excess fraction: 9/27 (33% ± 11%). Similarly, we combine our UCL F+G statistics with those of Carpenter et al. (2009a) to determine a complete dZ99 UCL F+G disk fraction; they do not detect excess around the one dZ99 UCL star they searched, suggesting a combined dZ99 UCL F+G disk fraction: 21/67 (31% ± 7%). We also combine our dZ99 LCC F+G statistics with those of Carpenter et al. (2009a) to determine a complete dZ99 LCC F+G disk fraction; they do not detect excess around the two dZ99 LCC stars they searched, suggesting a combined dZ99 LCC F+G disk fraction: 25/71 (35% ± 7%). Our updated measurements of the disk fractions are consistent with those presented in our previous work, inferred from smaller stellar samples. In Chen et al. (2005), we estimated disk fractions of 20% in US, 9% in UCL, and 46% in LCC based on data from the first 40 targets observed. Despite our best efforts to remove interlopers, our ScoCen sample may still be contaminated; therefore, our disk fractions may still be lower limits. The majority of the stars in our sample are apparently not accreting. We only detect broad Hα profiles toward AK Sco and HD 101088 (Bitner et al. 2010) although we did not obtain visual spectra of HT Lup, a classical T Tauri star that is a known accretor (Cieza et al. 2007). The Hα emission profile toward AK Sco has been well studied (e.g., Alencar et al. 2003).
To quantify disk evolution, studies typically search for trends in infrared excess as a function of time. To determine whether evolution is consistent across stars of differing stellar mass, they typically divide a sample by spectral type to determine whether the evolution of A-type stars is similar to that of F- and G-type stars. Comparing stars of the same spectral type as a function of age is challenging because younger stars are more luminous and more massive for a given spectral type. In particular, high and intermediate-mass stars evolve substantially on the HRD at ages between 5 and 20 Myr. D'Antona & Mazzitelli (1997) stellar evolution models suggest that a 1.5 M☉ star is expected to possess a spectral type K0 at 5 Myr, and a spectral type F3 once it reaches the main sequence (at an age of ∼10 Myr) and that a 1.0 M☉ star is expected to possess a spectral type K3 at 5 Myr, a spectral type K1 at 15 Myr, and a spectral type G4 once it reaches the main sequence (at an age of ∼50 Myr). Therefore, we propose to search for trends in disk evolution by comparing stars of a similar mass (rather than spectral type) as a function of age. This approach has the advantage that its results can be compared directly with the result of N-body/coagulation codes that model debris disk evolution as a function of stellar mass; for stars of a given mass, these models include changes in stellar luminosity as a function of age.
The majority of F- and G-type ScoCen members in our sample correspond to stars with stellar masses 1.0–1.5 M☉. Therefore, we searched for trends in the disk fraction around 1.0–1.5 M☉ as a function of time. We expect that 1.5 M☉ stars will appear as F0 through K1 members of US and as A7 through F9 members of UCL and LCC and that 1.0 M☉ stars will appear as K2 through K6 members of US and as G7 through K6 members of UCL and LCC (Table 5). For US, we infer a disk fraction of 11/53 (21+7−5%) for 1.5 M☉ stars and 6/15 (40+13−11%) for 1.0 M☉ stars from this survey and the Carpenter et al. (2009a, 2009b) MIPS 24 μm surveys that included 31 early to mid K-type members of US. We note that five of the excess systems around K-type stars, discovered by Carpenter et al. (2009b), are classified as "primordial" based on the presence of 16 μm excess emission. Follow-up visual spectra of these targets suggest that two are classical T Tauri stars and the remaining three are weak-line T Tauri stars (Dahm & Carpenter 2009; see Table 6). The evolutionary status of WTTS at the end of the protoplanetary phase and the beginning of the debris phase may not be straightforward. Although the three WTTS are classified by Dahm & Carpenter (2009) as primordial disks, the lack of accretion and small IRAC excesses associated with at least one of these objects may suggest that they are debris disks rather than primordial disks. We measured 1.5 M☉ disk fractions of 17/55 (31+7−6%) and 20/50 (40+7−6%) in UCL and LCC, respectively, including one accreting, primordial disk in UCL (AK Sco). We measured 1.0 M☉ disk fractions of 3/21 (14+10−4%) and 4/16 (25+13−8%) in UCL and LCC, respectively, including one accreting, primordial disk in UCL (HT Lup) and another in LCC (PDS 66). Since the US disk fractions are similar to the UCL and LCC disk fractions, we do not believe that there is strong evidence for a change in the disk fraction between ages ∼10 Myr and ∼15–20 Myr for 1.0–1.5 M☉ stars.
Table 5. Spitzer Intermediate-age Disk Surveys
| Avg | 1.5 M☉ | 1.0 M☉ | ||||||
|---|---|---|---|---|---|---|---|---|
| Region | Age | Distance | Selection | Nstars | Range | Nstars | Range | References |
| (Myr) | (pc) | Criteria | ||||||
| Upper Sco | 10 | ∼146 | SpTa | 1 | K2 | ... | ... | 1 |
| SpT | 36 | F0–K1 | 15 | K2–K6 | 2 | |||
| SpT | 16 | F0–G9 | ... | ... | 10 | |||
| β Pic MG | 12 | ≲60 | SpT | 8 | A7–G7 | 3 | K0–K6 | 6 |
| UCL | 15 | ∼142 | SpTa | 1 | A7–F9 | 18 | G7–K6 | 1 |
| SpT | 54 | A7–F9 | 3 | G7–K6 | 10 | |||
| LCC | 17 | ∼118 | SpTa | ... | ... | 12 | G2–K6 | 1 |
| SpT | 50 | A7–F6 | 4 | G2–K6 | 10 | |||
| Tuc-Hor | 30 | ≲60 | SpT | 3 | A7–F6 | 1 | F9–K3 | 6 |
| SpT | ... | ... | 2 | F9–K3 | 9 | |||
| IC 2391 | 50 | ∼150 | SpT | 7 | A7–F5 | 7 | F8–K1 | 7 |
| Pleiades | 130 | ∼130 | SpTb | 7 | A7–F5 | 17 | F8–K1 | 3 |
| SpT | 11 | A7–F5 | 26 | F8–K1 | 8 | |||
| Field | 16–200 | 11–180 | SpTa | 4 | A7–F5 | 150 | F8–K1 | 1 |
| 30 | 40–60 | SpT | 3 | A7–F6 | 1 | F9–K3 | 4 | |
| 15–200 | 10–60 | SpT | 6 | A7–F5 | 35 | F8–K1 | 5 | |
Notes. aSpectral types drawn from Meyer et al. (2006). bPhotosphere estimates made based on Spitzer IRAC photometry published in Stauffer et al. (2005). References. (1) Carpenter et al. 2009a; (2) Carpenter et al. 2009b; (3) Gorlova et al. 2006; (4) Moor et al. 2009; (5) Plavchan et al. 2009; (6) Rebull et al. 2008; (7) Siegler et al. 2007; (8) Sierchio et al. 2010; (9) Smith et al. 2006; (10) this work.
Download table as: ASCIITypeset image
Table 6. Observations of 1–1.5 M☉ Stars in Upper Sco
| Name | SpT | Fν(24 μm)/F*(24 μm) | Type | Notes |
|---|---|---|---|---|
| 1.5 M☉ Stars | ||||
| HD 142361 | G3V | 1.02 ± 0.07 | No excess (2) | |
| HD 142987 | G4 | 0.99 ± 0.07 | No excess (2) | |
| HD 146516 | G0IV | 0.99 ± 0.07 | No excess (2) | |
| HD 147810 | G1 | 1.00 ± 0.07 | No excess (2) | |
| HD 149598 | G0 | 1.13 ± 0.07 | No excess (2) | |
| HIP 78233 | F2/3IV/V | 0.95 ± 0.07 | No excess (2) | |
| HIP 78483 | G0V | 0.98 ± 0.07 | No excess (2) | |
| HIP 78581 | G1V | 1.01 ± 0.04 | No excess (4) | |
| HIP 78663 | F5V | 1.38 ± 0.05 | Debris (4) | |
| HIP 78977 | F7V | 1.35 ± 0.04 | Debris (4) | |
| HIP 79054 | F0V | 1.46 ± 0.06 | Debris (4) | |
| HIP 79083 | F3V | 1.03 ± 0.07 | No excess (2) | |
| HIP 79097 | F3V | 1.00 ± 0.07 | No excess (2) | |
| HIP 79252 | G7IVe | 1.10 ± 0.04 | No excess (4) | |
| HIP 79288 | F0V | 81.9 ± 1.7 | Debris (4) | |
| HIP 79369 | F0V | 1.06 ± 0.05 | No excess (4) | |
| HIP 79462 | G2V | 1.51 ± 0.07 | Debris (2) | |
| HIP 79606 | F6 | 0.96 ± 0.07 | No excess (2) | |
| HIP 79643 | F2 | 1.85 ± 0.07 | Debris (2) | |
| HIP 79644 | F5 | 0.93 ± 0.07 | No excess (2) | |
| HIP 79910 | F3V | 1.05 ± 0.05 | No excess (4) | |
| HIP 79977 | F3/F3V | 26.2 ± 0.5 | Debris (4) | |
| HIP 80320 | G3IV | 1.56 ± 0.05 | Debris (4) | |
| HIP 80535 | G0V | 1.17 ± 0.05 | No excess (4) | |
| HIP 80586 | F5V | 1.03 ± 0.04 | No excess (4) | |
| HIP 80896 | F3V | 0.97 ± 0.07 | No excess (2) | |
| HIP 81455 | F3V | 0.98 ± 0.07 | No excess (4) | |
| HIP 81851 | F2V | 1.03 ± 0.04 | No excess (4) | |
| HIP 82218 | F2/3V | 2.20 ± 0.06 | Debris (4) | |
| HIP 82319 | F3V | 1.00 ± 0.07 | No excess (2) | |
| HIP 82534 | F0V | 1.00 ± 0.06 | No excess (4) | |
| PPM 732705 | G6 | 1.00 ± 0.07 | No excess (2) | |
| PPM 747651 | G3 | 1.05 ± 0.07 | No excess (2) | |
| PPM 747978 | G3 | 0.94 ± 0.07 | No excess (2) | |
| [PZ99] J155812.7-232835 | G2 | 2.72 ± 0.07 | Debris (2) | |
| [PZ99] J160000.7-250941 | G0 | 1.09 ± 0.07 | No excess (2) | |
| [PZ99] J161318.6-221248 | G9 | 0.98 ± 0.07 | No excess (2) | |
| [PZ99] J161329.3-231106 | K1 | 1.03 ± 0.07 | No excess (2) | |
| [PZ99] J161402.1-230101 | G4 | 1.08 ± 0.07 | No excess (2) | |
| [PZ99] J161411.0-230536 | K0 | 18.02 ± 0.07 | Primordial (2) | WTTS (3) |
| [PZ99] J161459.2-275023 | G5 | 1.57 ± 0.07 | Debris (2) | |
| [PZ99] J161618.0-233947 | G7 | 1.11 ± 0.07 | No excess (2) | |
| [PZ99] J161933.9-222828 | K0 | 1.03 ± 0.07 | No excess (2) | |
| RX J1541.1-2656 | G7 | 1.03 ± 0.07 | No excess (2) | |
| RX J1548.0-2908 | G9 | 1.05 ± 0.07 | No excess (2) | |
| RX J1550.9-2534 | F9 | 0.91 ± 0.07 | No excess (2) | |
| RX J1600.6-2159 | G9 | 1.11 ± 0.07 | No excess (2) | |
| RX J1602.8-2401A | K0 | 0.99 ± 0.07 | No excess (2) | |
| RX J1603.6-2245 | G9 | 1.00 ± 0.07 | No excess (2) | |
| SAO 183706 | G8e | 1.04 ± 0.07 | No excess (2) | |
| ScoPMS 21 | K1IV | 0.98 ± 0.07 | No excess (2) | |
| ScoPMS 52 | K0IV | 0.92 ± 0.07 | No excess (2) | |
| ScoPMS 214 | K0IV | 1.17 ± 0.03 | Debris (1) | |
| 1.0 M☉ Stars | ||||
| [PBB2002] USco J160643.8-190805 | K6 | 5.29 ± 0.07 | Primordial (2) | WTTS (3) |
| [PBB2002] USco J161420.2-190648 | K5 | 40.07 ± 0.07 | Primordial (2) | CTTS (3) |
| [PZ99] J153557.8-232405 | K3: | 0.90 ± 0.07 | No excess (2) | |
| [PZ99] J155847.8-175800 | K3 | 1.41 ± 0.07 | Debris (2) | |
| [PZ99] J160251.2-240156 | K4 | 1.22 ± 0.07 | No excess (2) | |
| [PZ99] J160357.6-203105 | K5 | 33.16 ± 0.07 | Primordial (2) | CTTS (3) |
| [PZ99] J160421.7-213028 | K2 | 58.15 ± 0.07 | Primordial (2) | WTTS (3) |
| [PZ99] J160612.5-203647 | K5 | 0.98 ± 0.07 | No excess (2) | |
| [PZ99] J160814.7-190833 | K2 | 0.97 ± 0.07 | No excess (2) | |
| [PZ99] J160856.7-203346 | K5 | 0.97 ± 0.07 | No excess (2) | |
| [PZ99] J161302.7-225744 | K4 | 1.00 ± 0.07 | No excess (2) | |
| RX J1558.1-2405A | K4 | 0.90 ± 0.07 | No excess (2) | |
| ScoPMS 23 | K5IV | 0.92 ± 0.07 | No excess (2) | |
| ScoPMS 27 | K2IV | 0.94 ± 0.07 | No excess (2) | |
| ScoPMS 45 | K5IV | 1.44 ± 0.07 | Debris (2) | |
References. (1) Carpenter et al. 2009a; (2) Carpenter et al. 2009b; (3) Dahm & Carpenter 2009; (4) this work.
Table 7. Observations of 1–1.5 M☉ Stars in UCL
| HIP | Name | SpT | Fν(24 μm)/F*(24 μm) | Type | Notes |
|---|---|---|---|---|---|
| 1.5 M☉ Stars | |||||
| 67497 | HD 120326 | F0V | 12.3 ± 0.3 | Debris (4) | |
| HD 120812 | F8/G0V | 1.00 ± 0.05 | No excess (2) | ||
| 67957 | HD 121176 | F8V | 1.09 ± 0.1 | No excess (4) | |
| 67970 | HD 121189 | F3V | 4.37 ± 0.1 | Debris (4) | |
| 68335 | HD 121835 | F5V | 1.05 ± 0.04 | No excess (4) | |
| 69291 | HD 123889 | F2V | 1.21 ± 0.05 | No excess (4) | |
| 69327 | HD 123800 | F0IV | 1.22 ± 0.05 | No excess (4) | |
| 69720 | HD 124619 | F0V | 1.75 ± 0.06 | Debris (4) | |
| 70350 | HD 125912 | F7V | 1.04 ± 0.04 | No excess (4) | |
| 70376 | HD 125896 | F7V | 1.06 ± 0.04 | No excess (4) | |
| 70558 | HD 126318 | F2V | 1.07 ± 0.05 | No excess (4) | |
| 70689 | HD 126488 | F2V | 1.02 ± 0.04 | No excess (4) | |
| 71023 | HD 127236 | F0V | 1.32 ± 0.04 | Debris (4) | |
| 71767 | HD 128893 | F3V | 1.08 ± 0.04 | No excess (4) | |
| 72033 | HD 129490 | F7IV/V | 1.06 ± 0.04 | No excess (4) | |
| 72099 | HD 129683 | F6V | 2.66 ± 0.06 | Debris (4) | |
| 72164 | HD 129766 | F2III/IV | 1.03 ± 0.04 | No excess (4) | |
| 73666 | HD 133075 | F3IV | 1.12 ± 0.04 | No excess (4) | |
| 73667 | HD 133022 | F3V | 0.98 ± 0.04 | No excess (4) | |
| 73742 | HD 133117 | F8V | 1.00 ± 0.04 | No excess (4) | |
| 74499 | HD 134888 | F3/5V | 3.22 ± 0.08 | Debris (4) | |
| 74772 | CD-49 9474 | F3V | 1.10 ± 0.05 | No excess (4) | |
| 74865 | HD 135778 | F3V | 1.05 ± 0.05 | No excess (4) | |
| 74959 | HD 135953 | F5V | 1.68 ± 0.05 | Debris (4) | |
| 75367 | CD-40 9577 | F9V | 1.10 ± 0.08 | No excess (4) | |
| 75459 | HD 136991 | F3V | 0.95 ± 0.04 | No excess (4) | |
| 75480 | HD 137130 | F0V | 0.99 ± 0.04 | No excess (4) | |
| 75491 | HD 137057 | F3V | 3.45 ± 0.08 | Debris (4) | |
| 75683 | HD 137499 | F3 | 2.45 ± 0.08 | Debris (4) | |
| 75891 | HD 137888 | F2V | 1.05 ± 0.04 | No excess (4) | |
| 75933 | HD 137991 | F3V | 1.04 ± 0.04 | No excess (4) | |
| 76084 | HD 138296 | F2V | 1.01 ± 0.05 | No excess (4) | |
| 76457 | HD 138994 | F2V | 1.03 ± 0.04 | No excess (4) | |
| 76501 | HD 139124 | F2V | 1.10 ± 0.04 | No excess (4) | |
| 76875 | HD 139883 | F2V | 1.01 ± 0.04 | No excess (4) | |
| 77038 | HD 140241 | F3V | 1.04 ± 0.05 | No excess (4) | |
| 77432 | HD 141011 | F5V | 1.99 ± 0.06 | Debris (4) | |
| 77502 | HD 141313 | F3V | 1.16 ± 0.04 | No excess (4) | |
| 77520 | HD 141254 | F3V | 1.39 ± 0.05 | No excess (4) | |
| 77713 | HD 141759 | F5V | 1.00 ± 0.06 | No excess (4) | |
| 77780 | HD 141803 | F7/8V | 1.03 ± 0.04 | No excess (4) | |
| 78043 | HD 142446 | F3V | 2.68 ± 0.07 | Debris (4) | |
| 78555 | HD 143538 | F0V | 1.16 ± 0.05 | No excess (4) | |
| 78881 | HD 144225 | F3V | 1.02 ± 0.04 | No excess (4) | |
| 79516 | HD 145560 | F5V | 8.9 ± 0.2 | Debris (4) | |
| 79673 | HD 145984 | F2V | 1.53 ± 0.05 | Debris (4) | |
| 79710 | HD 145972 | F0V | 3.1 ± 0.2 | Debris (4) | |
| 79742 | HD 146181 | F6V | 6.8 ± 0.1 | Debris (4) | |
| 79908 | HD 146610 | F9IV | 1.07 ± 0.05 | No excess (4) | |
| 80663 | HD 330719 | F1V | 1.04 ± 0.2 | No excess (4) | |
| 80921 | HD 328333 | F2IV | 5.1 ± 0.2 | Debris (4) | |
| 81136 | HD 149090 | A7/8+G | 0.89 ± 0.04 | No excess (4) | |
| 82569 | HD 152041 | F3V | 1.00 ± 0.08 | No excess (4) | |
| 82747 | AK Sco | F5V | 164 ± 3 | Primordial (4) | CTTS (1) |
| 83159 | HD 153232 | F5V | 1.64 ± 0.09 | No excess (4) | |
| 1.0 M☉ Stars | |||||
| MML 36 | K0 IV | 1.49 ± 0.03 | Debris (2) | ||
| MML 38 | G8 IVe | 1.04 ± 0.03 | No excess (2) | ||
| MML 40 | G9 IV | 1.00 ± 0.03 | No excess (2) | ||
| MML 43 | G7 IV | 1.12 ± 0.03 | Debris (2) | ||
| HD 126670 | G6/8 III/IV | 1.05 ± 0.03 | No excess (2) | ||
| 71178 | HD 127648 | G8IVe | 1.14 ± 0.05 | No excess (4) | |
| RX J1450.4-3507 | K1 (IV) | 0.98 ± 0.03 | No excess (2) | ||
| MML 51 | K1IVe | 1.00 ± 0.03 | No excess (2) | ||
| RX J1458.6-3541 | K3 (IV) | 0.99 ± 0.03 | No excess (2) | ||
| RX J1500.8-4331 | K1 (IV) | 0.99 ± 0.03 | No excess (2) | ||
| RX J1507.2-3505 | K0 | 1.06 ± 0.03 | No excess (2) | ||
| HD 133938 | G6/8 III/IV | 0.97 ± 0.03 | No excess (2) | ||
| RX J1518.4-3738 | K1 | 1.02 ± 0.03 | No excess (2) | ||
| 76477 | MML 67 | G9 | 1.01 ± 0.03 | No excess (2) | |
| HD 139498 | G8 (V) | 1.01 ± 0.03 | No excess (2) | ||
| RX J1544.0-3311 | K1 | 1.04 ± 0.03 | No excess (2) | ||
| HD 140374 | G8 V | 0.95 ± 0.03 | No excess (2) | ||
| 77157 | HT Lup | K3Ve | 166 ± 3 | Primordial (4) | CTTS (3) |
| RX J1545.9-4222 | K1 | 1.01 ± 0.03 | No excess (2) | ||
| HD 141521 | G8 V | 1.01 ± 0.03 | No excess (2) | ||
| 78684 | HD 143677 | G9.5IV | 1.11 ± 0.04 | No excess (4) | |
References. (1) Alencar et al. 2003; (2) Carpenter et al. 2009a; (3) Cieza et al. 2007; (4) this work.
Alternately, one could argue that evolutionary trends are only expected to be observed among the debris disk population. In this case, the accreting systems should be excluded to ensure that only debris disks are selected. Removing all primordial systems (both CTTS and WTTS) from the 1.5 M☉ demographics yields debris disk fractions of 10/52 (19+6−4%) for US, 16/54 (30+7−6%) for UCL, and 20/50 (40+7−6%) for LCC. Removing all primordial systems (both CTTS and WTTS) from the 1.0 M☉ demographics yields debris disk fractions of 2/11 (18+16−7%) for US, 2/20 (10+10−3%) for UCL, and 3/15 (20+14−7%) for LCC. In this case, the debris disk fractions for US are still consistent with UCL and LCC. In general, it may not be possible to divide disks into purely primordial or debris categories. The origin of circumstellar material in older, accreting, primordial disks (that are transitioning to debris disks) may be complex. Grady et al. (2009) and Eisner et al. (2006) have suggested that the disks around the Herbig Ae star HD 135344B and the T Tauri star TW Hya may be undergoing multiple phases of evolution simultaneously, with collisionally generated debris located at some radii.
5. DISK EVOLUTION
The Kenyon & Bromley (2004, 2005, 2008) coagulation-N-body simulations have been developed to model the period of oligarchic to chaotic growth in young solar systems that are rapidly dissipating circumstellar gas, beginning with meter to kilometer-sized planetesimals. The models sketch out the production of debris as a function of age in young disks, neglecting the presence of small, primordial grains. Therefore, before planetary embryos form (1000–3000 km objects), the models predict initially small excess emission. Once embryos form, they predict that collisions between nearby, leftover planetesimals produce micron-sized dust grains that can be detected as thermal infrared emission. Spitzer disk surveys have searched for an increase in the infrared excess at ages of ∼10–20 Myr that might indicate the formation of oligarchs at 30–150 AU in intermediate-aged disks. MIPS 24 μm observations of B- and A-type stars in λ Orionis (∼5 Myr), Orion OB1b (∼5 Myr) and OB1a (∼10 Myr), and h and χ Per (∼14 Myr), compared with data from other young clusters, suggest that the magnitude of the 24 μm excess around intermediate-mass stars peaks at an age of 10–15 Myr (Hernandez et al. 2006, 2009; Currie et al. 2008). Carpenter et al. (2009b) have recently analyzed the MIPS 24 μm measurements for young clusters and have been unable to find a peak in debris production at ∼10–15 Myr for B7–A9 type or G0–K5 type stars. However, they find a possible peak in 24 μm excess for F0–F9 stars at ∼10–15 Myr, at the 2.6σ level, based primarily on the detections of bright debris disks from our initial study (Paper I).
Since Kenyon & Bromley (2008, hereafter KB08) calculate the evolution of dust around stars with fixed stellar masses, including changes in stellar luminosity with age, MIPS 24 μm and 70 μm photometry of 1.0 ± 0.2 M☉ and 1.5 ± 0.2 M☉ stars can simply be compared with the KB08 models as a function of time. D'Antona & Mazzitelli (1997) tracks predict that the 24 μm fluxes for 1.0–1.5 M☉ stars are approximately constant to slightly increasing between ages ∼10 and 30 Myr; therefore, whether stellar photospheres can be detected primarily depends on stellar distances. In general, MIPS 24 μm observations of 1.0–1.5 M☉ stars at distances <200 pc are sensitive enough to detect stellar photospheres with good signal:noise while observations of more distant stars are not. Since detections of excess sources in clusters too distant to detect stellar photospheres may bias our analysis, we plot the MIPS 24 μm and 70 μm excesses of nearby stars (see Table 5) with 1.0 ± 0.2 M☉ and 1.5 ± 0.2 M☉ as a function of age (Figures 6 and 7). We overplot the KB08 models for stars with disks that are 1/3, 1, and 3 times as massive as the Minimum Mass Solar Nebula.

Figure 6. 24 μm flux ratio (Fν(24 μm)/F*(24 μm)) as a function of stellar age. Our observations of ScoCen are plotted along with data from several young clusters and moving groups in the published literature (see Table 5). Objects with near-infrared (e.g., IRAC) and MIPS 24 μm excesses are plotted using red asterisks; objects with only MIPS 24 μm excesses are plotted using solid red circles. The solid line shows the evolution of thermal emission from dust generated via collisional cascade at distances 30–150 AU from the central star (Kenyon & Bromley 2008) from a typical disk; for 1 M☉ stars, the model corresponds to a Minimum Mass Solar Nebula. The dashed lines show models for disks with masses that are a factor of three higher and lower. Objects with near- and mid-infrared excesses may be accreting, primordial disks (e.g., AK Sco). Black squares and error bars show mean and standard deviation of ScoCen sample while blue squares and error bars show mean and standard deviation of ScoCen sample if primordial disks are removed.
Download figure:
Standard image High-resolution image
Figure 7. Same as Figure 6 for the 70 μm flux ratio, Fν(70 μm)/F*(70 μm). Objects that are not detected with MIPS at 70 μm are plotted as upper limit symbols. The solid line shows the evolution of 70 μm emission from material generated via collisional cascade at distance 30–150 AU from the central star (Kenyon & Bromley 2008).
Download figure:
Standard image High-resolution imageAs in our disk fraction analysis, one may argue that the evolutionary trends predicted in KB08 are expected to be present in debris disk demographics only, in which case primordial systems should be excluded from the comparison sample. We reiterate that the KB08 models include gas dissipation in disks but not primordial grains. Since KB08 models include bulk gas that dissipates with time, the presence or absence of accretion can not be used to identify which systems can be compared with the models. Since there is no simple way to remove the effect of primordial grains in observations of primordial disks to reveal whether there is an underlying distribution of collisionally produced dust, we plot all of the systems observed in Figures 6 and 7. We note classical and weak-lined T Tauri systems with an asterisk (rather than a solid circle). We list the disk type and accretion properties of 1.5 and 1.0 M☉ ScoCen stars in Tables 6–8. We find that (1) stars possess MIPS 24 μm excesses that vary by as much as a factor of 100 at a given age, (2) the observed 24 μm excesses are approximately consistent with the KB08 models for 1.5 M☉ stars but are an order of magnitude higher than predicted for 1.0 M☉ stars, and (3) the upper envelope of MIPS 24 μm excess does not obviously peak at an age of 10–15 Myr for 1.0 M☉ stars.
Table 8. Observations of 1–1.5 M☉ Stars in LCC
| HIP | Name | SpT | Fν(24 μm)/F*(24 μm) | Type | Notes |
|---|---|---|---|---|---|
| 1.5 M☉ Stars | |||||
| 55334 | HD 98660 | F2V | 1.07 ± 0.04 | No excess (3) | |
| 56227 | HD 100282 | F0III | 1.11 ± 0.04 | No excess (3) | |
| 56673 | HD 101088 | F5IV | 1.34 ± 0.04 | Debris (3) | |
| 57595 | HD 102597 | F5V | 0.98 ± 0.04 | No excess (3) | |
| 57950 | HD 103234 | F2IV/V | 1.97 ± 0.05 | Debris (3) | |
| 58075 | HD 103441 | F2V | 1.24 ± 0.04 | No excess (3) | |
| 58146 | HD 103589 | F2IV/V | 1.08 ± 0.05 | No excess (3) | |
| 58167 | HD 103599 | F3IV | 1.13 ± 0.04 | No excess (3) | |
| 58220 | HD 103703 | F3V | 3.17 ± 0.07 | Debris (3) | |
| 58528 | HD 104231 | F5V | 2.06 ± 0.06 | Debris (3) | |
| 58899 | HD 104897 | F3V | 0.96 ± 0.04 | No excess (3) | |
| 59084 | HD 105233 | F0V | 1.01 ± 0.07 | No excess (3) | |
| 59481 | HD 105994 | F3V | 1.21 ± 0.04 | No excess (3) | |
| 59603 | HD 106218 | F2V | 1.05 ± 0.04 | No excess (3) | |
| 59693 | HD 106389 | F6IV | 2.13 ± 0.07 | Debris (3) | |
| 59716 | HD 106444 | F5V | 1.17 ± 0.04 | No excess (3) | |
| 59960 | HD 106906 | F5V | 6.7 ± 0.1 | Debris (3) | |
| 60245 | HD 107437 | F2V | 1.09 ± 0.05 | No excess (3) | |
| 60348 | HD 107649 | F5V | 1.97 ± 0.05 | Debris (3) | |
| 60513 | HD 107920 | F3V | 0.99 ± 0.04 | No excess (3) | |
| 60567 | HD 108016 | F6/7V | 1.17 ± 0.04 | No excess (3) | |
| 61086 | CD-51 6746 | F1V | 1.00 ± 0.05 | No excess (3) | |
| 61087 | HD 108904 | F6V | 7.5 ± 0.2 | Debris (3) | |
| 62032 | HD 110484 | F0V | 1.19 ± 0.04 | No excess (3) | |
| 62056 | CD-49 7315 | F6V | 0.93 ± 0.05 | No excess (3) | |
| 62134 | HD 110634 | F2V | 1.46 ± 0.05 | Excess (3) | |
| 62171 | HD 110697 | F3V | 1.00 ± 0.04 | No excess (3) | |
| 62431 | HD 111104 | F0 | 1.00 ± 0.04 | No excess (3) | |
| 62657 | HD 111520 | F5/6V | 6.9 ± 0.1 | Excess (3) | |
| 62674 | CD-46 8204 | F3V | 1.09 ± 0.05 | No excess (3) | |
| 62677 | HD 111466 | F0/2V: | 1.09 ± 0.04 | No excess (3) | |
| 63022 | HD 112146 | F0V | 1.00 ± 0.04 | No excess (3) | |
| 63041 | HD 112109 | F0V | 1.0 ± 0.4 | No excess (3) | |
| 63272 | HD 112509 | F3IV/V | 1.12 ± 0.04 | No excess (3) | |
| 63435 | HD 112794 | F5V | 1.05 ± 0.04 | No excess (3) | |
| 63439 | HD 112810 | F3/5IV/V | 2.35 ± 0.06 | Debris (3) | |
| 63527 | HD 112951 | F0/2V | 1.01 ± 0.04 | No excess (3) | |
| 63886 | HD 113556 | F2V | 2.09 ± 0.06 | Debris (3) | |
| 63975 | HD 113766 | F3/5V | 80 ± 2 | Debris (3) | |
| 64044 | HD 113901 | F5V | 1.24 ± 0.04 | No excess (3) | |
| 64184 | HD 114082 | F3V | 21.9 ± 0.4 | Debris (3) | |
| 64316 | CD-51 7328 | F3V | 1.06 ± 0.05 | No excess (3) | |
| 64322 | HD 114319 | F0/2IV/V | 1.0 ± 0.1 | No excess (3) | |
| 64877 | HD 115361 | F5V | 2.5 ± 0.1 | Debris (3) | |
| 64995 | HD 115600 | F2IV/V | 13.7 ± 0.3 | Debris (3) | |
| 65136 | HD 115875 | F0V | 1.00 ± 0.04 | No excess (3) | |
| 65875 | HD 117214 | F6V | 15.0 ± 0.3 | Debris (3) | |
| 67068 | HD 119511 | F3V | 1.35 ± 0.04 | Debris (3) | |
| 67230 | HD 119718 | F5V | 3.3 ± 0.1 | Debris (3) | |
| 67428 | HD 120178 | F5V | 1.81 ± 0.05 | Debris (3) | |
| 68534 | CPD-60 5147 | F2V | 2 ± 1 | No excess (3) | |
| 1.0 M☉ Stars | |||||
| MML 1 | K1 IV | 1.07 ± 0.03 | No excess (1) | ||
| 58996 | HD 105070 | G2IV | 1.06 ± 0.04 | No excess (3) | |
| MML 8 | K0 IV | 1.68 ± 0.03 | Debris (1) | ||
| MML 9 | G9 IV | 1.05 ± 0.03 | No excess (1) | ||
| HD 107441 | G1.5 IV | 1.05 ± 0.03 | No excess (1) | ||
| MML 18 | K0 IV | 0.97 ± 0.03 | No excess (1) | ||
| 60913 | HD 108611 | G4.5IV | 1.07 ± 0.04 | No excess (3) | |
| HD 111170 | G8/K0 V | 1.01 ± 0.03 | No excess (1) | ||
| MML 26 | G5 IV | 0.98 ± 0.03 | No excess (1) | ||
| MML 28 | K2 IV | 1.39 ± 0.03 | Debris (1) | ||
| 63847 | HD 113466 | G3IV | 1.10 ± 0.06 | No excess (3) | |
| HD 116099 | G0/3 | 1.15 ± 0.03 | Debris (1) | ||
| PDS 66 | K1 IVe | 32.70 ± 0.02 | Primordial (1) | CTTS (2) | |
| 65517 | HD 116650 | G1.5IV | 1.13 ± 0.05 | No excess (3) | |
| HD 117524 | G2.5 IV | 0.99 ± 0.03 | No excess (1) | ||
| HD 119269 | G3/5 V | 1.02 ± 0.03 | No excess (1) | ||
References. (1) Carpenter et al. 2009a; (2) Mamajek et al. 2002; (3) this work.
We observe a factor of 100 dispersion in the 24 μm excess of our solar-like ScoCen stars (see Figure 6). Whether this dispersion is the result of a dispersion in initial disk conditions or stochastic collisions is not known. Andrews & Williams (2007) observe a factor of 100 dispersion in the submillimeter photometry of young stellar objects in ρ Ophiuchi; since submillimeter photometry is sensitive to the total disk mass, they suggest that the variation may be the result of dispersion in initial disk mass. However, some very bright infrared sources may be either primordial disks or debris disks that have experienced recent collisions. For example, AK Sco in UCL (Fν(24 μm)/F*(24 μm) ∼ 180) possesses pristine silicate grains and is still actively accreting material from its circumstellar disk (Alencar et al. 2003). HD 113766 in LCC (Fν(24 μm)/F*(24 μm) ∼ 90) may be a debris disk that recently experienced a massive collision (Lisse et al. 2008; Chen et al. 2006). High-resolution IRS spectroscopy has revealed the presence of submicron-sized, crystalline grains around HD 113766 whose emission is well modeled using laboratory-measured emissivities of crushed forsterite, suggesting the presence of sub-blow out-sized grains that are not gravitationally bound and are expected to be radiatively driven from the system on a timescale much shorter than the age of the system.
KB08 conclude that the debris disks around higher mass stars should produce more thermal infrared excess than those around lower mass stars because higher mass stars are more luminous and possess more massive disks. Figure 6 shows that the measured 24 μm excess ratios (Fν(excess)/Fν(*)) for 1.5 M☉ and 1.0 M☉ stars can be an order of magnitude brighter than that expected based on models. The smaller excess predicted by the models may be the result of artificial boundary conditions imposed on the location of dust. The models assume that parent bodies and subsequent planetesimals are located at distances of 30–150 AU from the central star. Dust grains located at these distances (around a 1 M☉) star are expected to possess grain temperatures, Tgr = 51–23 K, if the grains are large, corresponding to a peak in the thermally emitted radiation at λ = 100–225 μm. The presence of bright 24 μm excess around 1 M☉ stars probably indicates that revised models incorporating parent bodies at distances <30 AU are needed to reproduce the observations.
The KB08 models predict a peak in the upper envelope of the 24 μm excess around 1.0 and 1.5 M☉ stars at an age of 10–20 Myr due to the formation of planetary embryos in a self-stirred disk. We plot the cumulative disk fractions for 1.0 and 1.5 M☉ stars in US, UCL, and LCC as a function of Fν(24 μm)/F*(24 μm) (Figure 8). Currie et al. (2008) searched for statistical trends in similar measurements of B-, A-, and F-type stars in Orion OB1b (∼5 Myr), Orion OB1a (∼10 Myr), and ScoCen (∼16 Myr). They performed a Wilcoxon rank sum analysis on measurements of [24] − [24]* in Orion OB1a and ScoCen compared to Orion OB1b. For two samples, the Wilcoxon rank sum test determines the equality or inequality of two distributions by computing the mean rank of one distribution in a combined sample of both distributions. Currie et al. (2008) compute negative Z parameters and small probabilities, indicating that the mean 24 μm excess for stars measured in Orion OB1a and ScoCen were statistically smaller than that of Orion OB1b. We performed the Wilcoxon rank sum test on our expanded sample of ScoCen Fν(24 μm)/F*(24 μm) measurements, comparing each subgroup with US and UCL for 1.0 and 1.5 M☉ stars both including and excluding primordial disks (see Table 9). We exclude measurements of Orion OB1b and OB1a from our analysis because these subgroups are more distant, making observations of these stars less sensitive to stellar photospheres. For 1.5 M☉ stars, we similarly find that the Wilcoxon rank sum test yields negative Z parameter with small probabilities when comparing US to UCL and LCC, indicating that the excesses around UCL and LCC stars are larger than around US stars. For 1.0 M☉ stars, we find that the Wilcoxon rank sum test yields negative Z parameter with large probabilities when comparing US to UCL and LCC, indicating that the ranks of the mean 24 μm excess values are not substantially different for US, UCL, and LCC.

Figure 8. (a) The cumulative distribution functions of Fν(24 μm)/F*(24 μm) for 1.5 and 1.0 M☉ stars in US (dashed line), UCL (dotted line), and LCC (solid line) including both "primordial" and "debris" disks. (b) Same as (a) with "primordial" disks removed.
Download figure:
Standard image High-resolution imageTable 9. Fν(24 μm)/F*(24 μm) Statistics for ScoCen Evolutionary Sample
| Group | Age | Mean | Std Dev | Third Q | Median | First Q | RS Z | RS Prob |
|---|---|---|---|---|---|---|---|---|
| (Myr) | ||||||||
| 1.5 M☉ Stars—All | ||||||||
| US | 10 | 3.5 | 11.7 | 0.99 | 1.03 | 1.17 | 0 (2.6) | 1 (0.004) |
| UCL | 15 | 4.9 | 22.0 | 1.03 | 1.09 | 1.75 | −2.6 (0) | 0.004 (1) |
| LCC | 17 | 4.2 | 11.5 | 1.04 | 1.17 | 2.10 | −3.1 (−0.9) | 0.0009 (0.2) |
| 1.5 M☉ Stars—Primordial removed | ||||||||
| US | 10 | 3.2 | 11.8 | 0.99 | 1.03 | 1.17 | 0 (2.8) | 1 (0.002) |
| UCL | 15 | 1.9 | 2.1 | 1.03 | 1.09 | 1.68 | −2.8 (0) | 0.002 (1) |
| LCC | 17 | 4.2 | 11.5 | 1.04 | 1.17 | 2.10 | −3.4 (−1.0) | 0.0004 (0.2) |
| 1.0 M☉ Stars—All | ||||||||
| US | 10 | 9.9 | 18.2 | 0.94 | 1.00 | 5.29 | 0 (0.3) | 1 (0.4) |
| UCL | 15 | 8.9 | 36.0 | 1.00 | 1.01 | 1.11 | −0.3 (0) | 0.4 (1) |
| LCC | 17 | 3.1 | 7.9 | 1.02 | 1.07 | 1.15 | −0.5 (−1.6) | 0.3 (0.06) |
| 1.0 M☉ Stars—Primordial removed | ||||||||
| US | 10 | 1.06 | 0.20 | 0.92 | 0.97 | 1.22 | 0 (1.7) | 1 (0.04) |
| UCL | 15 | 1.05 | 0.12 | 1.00 | 1.01 | 1.06 | −1.7 (0) | 0.04 (1) |
| LCC | 17 | 1.12 | 0.19 | 1.01 | 1.06 | 1.13 | −1.9 (−1.7) | 0.03 (0.05) |
Notes. Statistics comparing the populations of US, UCL, and LCC. We calculate the mean Fν(24 μm)/F*(24 μm) for each subgroup (including and excluding "primordial disks"), the standard deviation (σ), the 1st quartile, the median, the 3rd quartile, and the Wilcoxon rank sum probability, and Z parameter. For the Wilcoxon rank sum test parameters, the first (second) entry in the rank sum test statistics compares each population to US (UCL). A positive Z parameter means that the sample has a larger median value than US (first entry) and UCL (second entry). A low-rank sum probability means that the median Fν(24 μm)/F*(24 μm) of the populations are very different.
Download table as: ASCIITypeset image
To better understand the Fν(24 μm)/F*(24 μm) distributions, we calculated the first quartile, median, and third quartile Fν(24 μm)/F*(24 μm) for 1.5 and 1.0 M☉ stars in US, UCL, and LCC (see Table 9). Typical measurement uncertainties for Fν(24 μm)/F*(24 μm) in US, UCL, and LCC are 0.07, 0.05, and 0.05, respectively, suggesting that the median Fν(24 μm)/F*(24 μm) for each subgroup is consistent with a bare photosphere. We calculate the mean and standard deviation of Fν(24 μm)/F*(24 μm) (see Table 9) and overlay these values in our diagram showing excess trends as a function of age (Figure 6). For both 1.5 and 1.0 M☉ stars, the Fν(24 μm)/F*(24 μm) standard deviation is very large, making it difficult to determine whether any robust evolutionary trend exists from the mean or the median alone. However, the first quartile values probe the strength of the 24 μm excess systems and indicate increased 24 μm excess for 1.5 M☉ stars and decreased 24 μm excess for 1.0 M☉ stars regardless of whether all disks are included or primordial disks are excluded from the analysis.
Our 70 μm photometry is sensitive to cooler material that is located at larger distances from the central star. The KB08 self-stirred disk models predict that debris disks should be bright there; however, our survey is shallow at 70 μm and only sensitive to excesses an order of magnitude brighter than the central star. In Figure 7, we plot the 70 μm flux ratios (Fν(70 μm)/F*(70 μm)) for all of the stars in our ScoCen study along with Spitzer MIPS 70 μm data obtained for other nearby moving groups (see Table 5). We detect only ∼10% of our objects at 70 μm. The detected objects possess excesses that are consistent with the expectations from KB08; however, the majority of the systems possess 3σ flux upper limits that while consistent with the models do not discriminate among them.
6. GRAIN PROPERTIES
We compare the grain properties for detected ScoCen debris disks with those measured for debris disks in mature planetary systems. We estimate typical measured fractional infrared luminosities (1 × 10⁻⁵ < LIR/L* < 7 × 10⁻²) and MIPS 24 and 70 μm blackbody color temperatures (40 K < Tgr < 300 K) around F- and G-type stars at ∼10–20 Myr. The FEPS team estimates typical fractional infrared luminosities (1 × 10⁻⁵ < LIR/L* < 1 × 10⁻³) and color temperatures (Tgr < 100 K) for debris disks around 3 Myr to 3 Gyr F5–K5-type stars (Carpenter et al. 2009a). Our sample contains nine disks with somewhat higher fractional infrared luminosities (LIR/L* > 1 × 10⁻³) and warm terrestrial temperature debris (Tgr > 200 K), consistent with the younger ages of these systems.
We estimate the minimum grain sizes, amin, assuming that the smallest grains are removed by radiation pressure if β (=Frad/Fgrav) > 0.5.

(Artymowicz 1988), where L* and M* are the stellar luminosity and mass, 〈Qpr(a)〉(= (∫Fλdλ)−1∫Qpr(a, λ)Fλdλ) is the radiation pressure coupling coefficient, and ρs is the density of an individual grain. We estimate the stellar mass by fitting D'Antona & Mazzitelli (1997) isochrones to our estimated stellar luminosities and effective temperatures (see Table 4). We use D'Antona & Mazzitelli (1997) isochrones because, in general, (1) the Siess et al. (1997) tracks estimate ages that are significantly older than those estimated from the other models, (2) the Palla & Stahler (2001) tracks are too sparsely populated in the F-star regime, and (3) the Baraffe et al. (1998) tracks do not extend to >1.4 M☉ and therefore yield incomplete coverage for the ScoCen F-stars. For systems in which isochrones could not be fit, we estimated stellar mass using the stellar spectral type, assuming that US and UCL/LCC have estimated ages of ∼10 and 15 Myr, respectively. Infrared spectroscopy of T Tauri disks suggest that the bulk of the dust in these systems is probably amorphous olivine (Watson et al. 2008); therefore, we use optical constants measured for amorphous olivine (ρs = 3.71 g cm−3; Dorschner et al. 1995) to estimate the radiation pressure coupling coefficient; for simplicity, we assume that the grains are spherical. In general, the estimated minimum grain sizes are too small for the grains to behave as simple blackbodies (Qabs ∝ constant) and too large for the grain to behave in the small grain approximation (2πa ≪ λ).
We estimate the grain distance from grain temperature, Tgr, assuming that the dust particles are in radiative equilibrium, and possess an average grain size, 〈a〉 = 5/3amin, expected if the grains are in collisional equilibrium. Dust grains in radiative equilibrium with a stellar source are located a distance, D, from the central star
where Qabs is the absorption coefficient for the dust grains. We estimate dust distances using optical constants measured for amorphous olivine and calculate absorption coefficients assuming that the grains are spherical, with radius, 〈a〉. Our data are consistent with the presence of dust located in rings at Kuiper-Belt-like distances, suggesting that the average ScoCen debris disk is a massive analog to our Kuiper Belt at an age <20 Myr.
We estimate the minimum mass of infrared-emitting dust grains, assuming that the grains have a radius, 〈a〉; if the grains are larger, then our estimate is a lower bound. If we assume a thin shell of dust at distance, D, from the central star, and if the grains are spheres of radius, 〈a〉, and if the cross section of the grains is equal to their geometric cross section, then the mass of dust is

where LIR is the luminosity of the dust. The bulk of the dust mass is expected to be located in larger grains.
We estimate the minimum mass in parent bodies assuming that the disk is Poynting–Robertson (PR) drag dominated and in steady state. We hypothesize that each system possesses at least as much mass in parent bodies today as that which would have been destroyed if the system were in steady state during the lifetime of the star. If MPB denotes the mass in parent bodies, then we may write

(Chen & Jura 2001). If the disk is dominated by collisions, as is probably the case, then this estimate will be a lower bound.
7. THE STAR–DISK CONNECTION
Stars with spectral types later than mid-F are expected be chromospherically active; therefore, they are expected to drive stellar winds that effectively remove dust from their circumstellar environments. Stars with earlier spectral types are expected to be chromospherically inactive and more luminous; therefore, they heat circumstellar dust more effectively, producing larger infrared excesses. We examine the relationships between infrared excess and stellar properties (e.g., luminosity and activity) to determine whether the observed dust properties are dependent on stellar properties.
7.1. Stellar Luminosity
We searched for differences in the 24 μm excess ratios as a function of stellar luminosity in UCL and LCC using stellar mass and spectral type as a proxies. Our K−[24] versus J−H and K−[70] versus J−H color–color diagrams (Figures 2 and 4) indicate that early F-type stars possess larger infrared excesses than K-type stars; however, we note that few K-type stars in UCL and LCC have been identified and surveyed using MIPS. Therefore, the lack of bright excess around late-type stars may be a reflection of poor statistics. In Figure 9(a), we plotted Fex(24 μm)/F*(24 μm) as a function of stellar spectral type. To quantify whether disk properties are dependent on stellar luminosity, we also plotted the cumulative distributions of Fex(24 μm)/F*(24 μm) for early- and late-type stars (see Figure 9(b)), using the spectral type bins for 1.5 M☉ and 1.0 M* stars in UCL and LCC given in Table 5. We exclude US from this analysis because US is believed to be significantly younger than UCL and LCC; US stars of a similar spectral type may be systematically more massive than those in UCL and LCC. Our cumulative distribution plot shows that early-type stars generally possess larger 24 μm excesses than their later spectral type counterparts. Using survival analysis, we estimate a 4.19% Kaplan Meier Estimator (KME) two sample test probability that the cumulative fractional infrared excess distributions for early- and late-type stars are drawn from the same parent population.

Figure 9. (a) The 24 μm flux ratio (Fν(24)/F*(24)) plotted as a function of stellar spectral type for all solar-like stars observed using MIPS in UCL and LCC. Sources shown in green and black are members of UCL and LCC, respectively. (b) The cumulative distribution functions of early-type (solid line) and late-type (dotted line) stars in UCL and LCC plotted as a function of Fν(24 μm)/F*(24 μm), suggesting that early-type stars possess somewhat larger infrared excesses than their later-type counterparts.
Download figure:
Standard image High-resolution imageN-body coagulation models (KB08) suggest that higher mass stars should possess larger 24 μm excesses because they possess higher stellar luminosities that more effectively warm circumstellar dust. For ages similar to UCL and LCC, KB08 predict that 1.5 M☉ stars should possess a 70% excess while 1.0 M☉ stars should possess no detectable excess at 24 μm (<9%). The 90th percentile 1.0 M☉ system possess a 60% 24 μm excess while the 90th percentile 1.5 M☉ system possess a 400% 24 μm excess. The larger 24 μm excess associated with 1.5 M☉ stars compared with 1.0 M☉ stars is consistent with the overall KB08 model; however, the contrast between the 90 percentile disks is somewhat smaller that predicted, suggesting that the disks around late-type stars possess more infrared excess than expected. The KB08 contrast between disks was estimated assuming that the disk surface is linearly proportional to stellar mass; therefore, our data may suggest that the disk surface density depends more weakly on stellar mass than previously assumed.
7.2. Stellar Wind Drag
Corpuscular stellar winds may contribute to grain removal around young solar-like stars and M-dwarfs in a manner analogous to the PR effect (Chen et al. 2005; Plavchan et al. 2005). In this case, large particles orbiting the star are subject to a drag force produced when dust grains collide with protons in the stellar wind. These collisions decrease the velocities of orbiting dust grains and therefore their angular momentum, causing them to spiral in toward their orbit center. At an age of 20 Myr, our Sun may have possessed a stellar mass-loss rate,  , one thousand times larger than is currently observed today,
  g s−1. Since the increase in the inward drift velocity is 1 +
  , compared to that produced by the PR effect alone, corpuscular stellar wind drag may have produced inward drift velocities (1 +
  ) ∼ 460 times larger than PR drag and may have been an important grain removal mechanism in the environment around the young Sun.
Preliminary analysis of the first 40 ScoCen objects observed in our sample revealed a possible anti-correlation between fractional infrared excess, LIR/L*, and fractional X-ray luminosity, Lx/L*. In Chen et al. (2005), we proposed that the observed anti-correlation may be explained by the presence of strong stellar winds around X-ray active stars that efficiently remove their circumstellar dust grains. We plot LIR/L*, measured from our MIPS 24 μm observations, as a function of Lx/L*, measured from the ROSAT All-Sky Bright Source Catalogue (Voges et al. 1999), for all sources with a 24 μm excess and/or ROSAT X-ray flux (Figure 10(a)). We use the conversion 1 ROSAT count = (8.31 + 5.30 HR1) × 10−12 erg cm−2, where HR1 is the hardness ratio between the 0.1–0.4 and the 0.5–2.0 keV bands (Fleming et al. 1995). Our preliminary detection of an anti-correlation between LIR/L* and Lx/L* was based largely on four sources with both 24 μm excess and ROSAT detections: HD 103234, HD 104231, HD 113766, and HD 148040. Our current analysis includes 10 sources with 24 μm excess and ROSAT detections. We divided our objects into two categories based on whether they were detected using ROSAT to search for an anti-correlation between dust mass and stellar wind and plotted the cumulative distributions of their 24 μm fractional infrared luminosities in Figure 10(b). In general, the ROSAT-detected stars possess disks with LIR/L* < 10−4 while the undetected stars possess LIR/L* as high as 10−2. Using survival analysis, we estimate the KME two sample test probability that the two populations are drawn from the same parent population is fairly low (2.6%), suggesting that the two populations may be different.
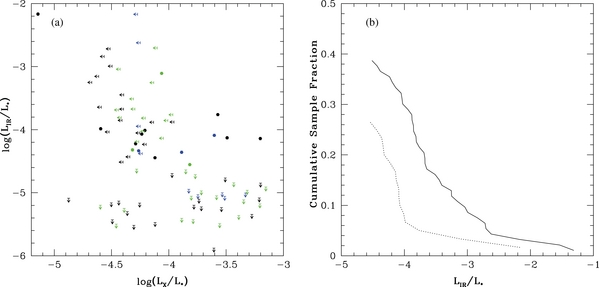
Figure 10. (a) The fractional infrared luminosity (LIR/L*), extrapolated from measurements of infrared excess at 24 μm, plotted as a function of fractional X-ray luminosity (Lx/L*) for all stars in our ScoCen sample with 24 μm excess and/or measured ROSAT flux. Sources shown in blue, green, and black are members of US, UCL, and LCC, respectively. Sources shown with solid circles possess both 24 μm excesses and measured ROSAT fluxes; sources shown with leftward pointing arrows possess measured 24 μm excesses but are not detected with ROSAT; sources shown as downward pointing arrows possess measured ROSAT fluxes but apparently no 24 μm excess. (b) The cumulative distribution functions for stars detected using ROSAT (dotted line) and not detected using ROSAT (solid line) plotted as a function of LIR/L*, estimated from 24 μm fluxes alone, indicating that stars detected using ROSAT possess disks with apparently smaller LIR/L*.
Download figure:
Standard image High-resolution imageIn our preliminary study (Chen et al. 2005), we estimate  from the X-ray activity of the central star using
  where A is the stellar surface area and Fx is the X-ray flux per stellar area (Wood et al. 2002). Since that study was published, Wood et al. (2005) better quantify the relationship between stellar mass-loss rate and surface X-ray flux, finding a better fit with the power-law function,
  . In addition, they also find that the stellar mass-loss rate power-law dependence on X-ray flux per stellar area apparently saturates at Fx = 8 × 10⁵ erg cm−2 s−1. They suggest that the saturation may be caused by changes in the field structure because more magnetically active stars possess more polar spots. ScoCen is sufficiently distant from the Sun that every object with a measured ROSAT flux, possesses an X-ray surface flux, FX > 8 × 10⁵ erg cm−2 s−1 (see Table 1); therefore, the conversion between X-ray flux and stellar wind mass-loss rate is somewhat uncertain.
For stars with spectral type later than F7V, the Ca ii R'HK index has been used as a metric for stellar activity with the relationship between stellar age and R'HK breaking down at young ages (<100 Myr) when stars are especially active (R'HK ∼ −4.2; Mamajek & Hillenbrand 2008). For ScoCen, the R'HK index possesses several advantages compared to ROSAT Lx/Lbol: (1) ROSAT possesses a large beam making it difficult to determine definitively the X-ray source. For example, HD 113766 is a binary system with a high ROSAT flux; however, the spatial resolution of ROSAT is insufficient to determine whether the dusty primary or naked secondary is the X-ray emitter, (2) ROSAT surveys possess limited sensitivity, making the majority of our stars challenging to detect; however, all of the stars are visually bright, making R'HK measurements straightforward. We plot LIR/L* versus R'HK for all of the stars that we observed with Magellan/MIKE in Figure 11(a) and observe a possible anti-correlation between the two. We divide our sample into stars with and without Ca ii H and K core emission to search for an anti-correlation between infrared excess and chromospheric activity. We plot the cumulative distributions of their 24 μm fractional infrared luminosities in Figure 11(b). In general, the chromospherically active stars possess disks with LIR/L* < 10−4 while the chromospherically quiet stars possess LIR/L* as high as 10−2. Using survival analysis, we estimate the KME two sample test probability that cumulative distributions of LIR/L* for stars with and without core Ca ii emission are fairly low (1.4%), suggesting that the two populations may be different.

Figure 11. (a) The fractional infrared luminosity (LIR/L*), extrapolated from measurements of infrared excess at 24 μm, plotted as a function of the calcium activity index, R'HK. Sources shown in blue, green, and black are members of US, UCL, and LCC, respectively. Sources shown with open stars possess Ca ii H and K core emission and 24 μm excess while those shown with solid circles possess no Ca ii H and K core emission but 24 μm excesses; all sources without statistically significant excesses are shown with upper limit symbols. (b) The cumulative distribution function for stars with Ca ii H and K core emission (dotted line) and without Ca ii H and K core emission (solid line) plotted as a function of LIR/L*, estimated from 24 μm fluxes alone, indicating that chromospherically active stars possess disks with apparently smaller LIR/L*.
Download figure:
Standard image High-resolution imageTo try to understand how R'HK, stellar spectral type, and vsin i are related to one another, we plot R'HK as a function of spectral type (Figure 12(a)) and vsin i (Figure 12(b)). As expected, Ca ii core emission in our sample is characteristic of stars with spectral type later than F7V; however, Ca ii core emission is not related to vsin i in a simple way. The early F-type stars in our sample possess a large rotational velocity dispersion with vsin i as high as 200 km s−1, consistent with young stars just reaching the main sequence viewed from random orientations, and low R'HK activity. The later F-, G-, and K-type stars possess smaller average vsin i and R'HK values. Although our R'HK values are not calibrated; they are consistent with observations of young main-sequence stars that suggest that R'HK is saturated at vsin i > 30 km s−1 (White et al. 2007). Since both stellar surface X-ray flux and R'HK are saturated, we cannot determine whether the anti-correlations observed between fractional infrared luminosity and fractional X-ray luminosity and R'HK are generated by differences in stellar activity or luminosity.

Figure 12. Ca ii R'HK activity indicator plotted as a function of (a) stellar spectral type and (b) stellar rotational velocity, vsin i. Objects with core emission in the Ca ii R and K lines are shown with open stars while those without are shown with solid circles.
Download figure:
Standard image High-resolution image7.3. Disk Locking
Circumstellar disks are believed to mediate angular momentum in T Tauri systems. As disks dissipate, central stars become "unlocked" from their disks, allowing them to spin up. Rebull et al. (2006) have shown that infrared excess and stellar periods are correlated in a Spitzer IRAC study of ∼900 young stars in Orion. They show that stars with periods >1.8 days are more likely to possess [3.6]−[8.0] excess and that the K-S test probability that the two populations are drawn from the same parent population is 0.0001%. We plot fractional infrared luminosity as a function of projected stellar rotational velocity (Figure 13(a)), searching for a relationship between infrared excess and period, and observe a weak anti-correlation between the two. We plot the cumulative infrared excess distributions of stars with vsin i larger and smaller than 70 km s−1 (Figure 13(b)) and calculate a 20.2% KME two sample test probability using survival analysis that the two distributions are drawn from the same sample, suggesting that the disks around fast and slow rotators are not statistically different. Since the ScoCen is significantly older than Orion, the evolutionary status of the disks is expected to be very different. While the disks in Orion are optically thick, gas-rich disks, the disks in ScoCen are optically thin, gas-poor disks that do not couple to their central stars via a stellar magnetic field.

Figure 13. (a) The fractional infrared luminosity (LIR/L*), extrapolated from measurements of infrared excess at 24 μm, plotted as a function of stellar rotational velocity, vsin i, for all stars in our ScoCen sample. (b) The cumulative distribution functions of slow rotators (solid line, vsin i < 70 km s−1) and rapid rotators (dotted line, vsin i > 70 km s−1) plotted as a function of LIR/L*, estimated from 24 μm fluxes alone, suggesting that rapidly rotating stars possess disks with apparently smaller LIR/L*.
Download figure:
Standard image High-resolution image8. DISCUSSION
IRAS and Spitzer observations of nearby (<100 pc), intermediate-age (∼10–30 Myr) stars in moving groups have discovered debris disks with high fractional infrared luminosities and cold dust color temperatures (e.g., Rebull et al. 2008; Low et al. 2005). Subsequent high-resolution scattered-light imaging has revealed systems with dust sculpted into narrow rings located at D > 50 AU, possibly indicating the presence of giant planets. The discovery of such structures led Mustill & Wyatt (2009) to suggest that these young debris disks may be stirred by already-formed giant planets on eccentric orbits rather than by in situ forming Plutos on regular orbits. A subsequent reanalysis of the MIPS 24 μm and 70 μm photometry for debris disks around A-type stars suggested that the average infrared-emitting regions are narrow with widths, ΔD = D/2, consistent with the presence of 0.5 MJup planets with e = 0.1 that are located at D/3; disks with fixed ∼150 AU outer radii and fixed or variable inner radii produce large 70 μm excesses that are inconsistent with the observations (Kennedy & Wyatt 2010).
While the TW Hya association, β Pic moving group, and Tucana-Horologium are very close and provide the premier opportunity to characterize 10–30 Myr old debris disks, these moving groups lack large numbers of stars to quantify the demographics of debris disks at these ages. Our ScoCen MIPS 24 μm and 70 μm study is the first sensitive search for infrared excess around a statistically significant sample of close (typically 100–250 pc away), intermediate-aged (10–20 Myr old) solar-like stars. Since our 70 μm observations were shallow (with the majority of our 24 μm excess systems not detected), additional high-resolution images or photometric measurements are required to constrain the extent of the disks and determine whether the disks are sculpted or self-stirred. High-resolution images are a particularly powerful diagnostic because they may also reveal asymmetric dust distributions that can only be explained by the presence of giant planets. Since radial velocity planet searches have typically focused on old main-sequence stars, follow-up debris disk imaging studies may help to identify giant planets in the youngest planetary systems and directly constrain their formation mechanism.
9. CONCLUSIONS
We have obtained Spitzer MIPS 24 and 70 μm photometry of 182 candidate F- and G-type members of Scorpius-Centaurus and MIKE high-resolution spectroscopy of 181 candidate F- and G-type members of Scorpius-Centaurus. We conclude the following.
- 1.The ScoCen subgroups US, UCL, and LCC possess F+G 24 μm excess fractions of 33 ± 11%, 31 ± 7%, and 35 ± 7%, consistent with observations of similarly aged young clusters and moving groups.
- 2.The detected disk 24 μm and 70 μm excesses are approximately consistent with KB08 models; however, the 24 μm excesses observed around 1.0 M☉ stars are larger than predicted. Updated models with parent bodies interior to 30 AU are probably needed to reproduce the observations with higher fidelity.
- 3.For 1.5 M☉ stars, the disk fraction does not appear to change statistically between 10 Myr and 15–20 Myr; however, the first quartile of the MIPS Fν(24 μm)/F*(24 μm) increases as expected from collisions between oligarchs at 30–150 AU in self-stirred disks. For 1.0 M☉ stars, the disk fraction does not appear to change statistically between 10 Myr and 15–20 Myr; however, the first quartile of the MIPS Fν(24 μm)/F*(24 μm) decreases, contrary to the expectation of self-stirred disk models.
- 4.The disk fractional infrared luminosity is weakly anti-correlated with
 and weakly anti-correlated with fractional X-ray luminosity. This anti-correlation indicates that disk fractional luminosity is dependent on stellar properties, such as mass, luminosity, and wind mass-loss rate. Since the surface X-ray flux, FX, and are saturated, we cannot determine whether the anti-correlation is the result of stellar luminosity and/or activity effects.


We thank M. Jura, M. Meyer, J. Najita, P. Plavchan, J. Pringle, M. Wyatt, and our referee T. Currie for their helpful comments and suggestions. Support for this work was provided by NASA through the Spitzer Space Telescope Fellowship Program, through a contract issued by the Jet Propulsion Laboratory, California Institute of Technology under a contract with NASA.
Footnotes
- 5
- 6