


ABSTRACT
We report the discovery of planets orbiting two bright, nearby early K dwarf stars, HD 97658 and Gl 785. These planets were detected by Keplerian modeling of radial velocities measured with Keck-HIRES for the NASA-UC Eta-Earth Survey. HD 97658 b is a close-in super-Earth with minimum mass Msin i = 8.2 ± 1.2 M⊕, orbital period P = 9.494 ± 0.005 days, and an orbit that is consistent with circular. Gl 785 b is a Neptune-mass planet with Msin i = 21.6 ± 2.0 M⊕, P = 74.39 ± 0.12 days, and orbital eccentricity e = 0.30 ± 0.09. Photometric observations with the T12 0.8 m automatic photometric telescope at Fairborn Observatory show that HD 97658 is photometrically constant at the radial velocity period to 0.09 mmag, supporting the existence of the planet.
Export citation and abstract BibTeX RIS
1. INTRODUCTION
Radial velocity (RV) searches for extrasolar planets are discovering less massive planets by taking advantage of improved instrumental precision, higher observational cadence, and diagnostics to identify spurious signals. These discoveries include planets with minimum masses (Msin i) as low as 1.9 M⊕ (Mayor et al. 2009) and systems of multiple low-mass planets (e.g., Lovis et al. 2006; Fischer et al. 2008; Vogt et al. 2010). To date, 15 planets with Msin i < 10 M⊕ and 18 planets with Msin i = 10–30 M⊕ have been discovered by the RV technique (Wright et al. 2010; Exoplanet Orbit Database10). Transiting searches for extrasolar planets have detected Neptune-mass planets (Bakos et al. 2010; Hartman et al. 2010) and super-Earths (Léger et al. 2009; Charbonneau et al. 2009). The initial data release from the Kepler mission shows substantially increasing planet occurrence with decreasing planet radius (Borucki et al. 2010). Using the large number of low-mass planets, we can statistically study planet properties, occurrence rates, and parameter correlations in ways previously only possible with higher mass gas-giant planets.
The distribution of low-mass planets in mass and orbital distance offers a critical probe of the mechanisms of planet formation. Howard et al. (2010b, hereafter H10) analyzed the rate of close-in planet occurrence for 166 G- and K-type dwarf stars in the Eta-Earth Survey. H10 measured rapidly increasing planet occurrence with decreasing planet mass over the planet mass range 3–1000 M⊕ for orbital periods P < 50 days. For close-in super-Earths and Neptunes (Msin i = 3–30 M⊕ and P < 50 days), H10 found an occurrence rate of 15+5−4% with a 24% upper limit (95% confidence). This is consistent with results from the Anglo-Australian Telescope (O'Toole et al. 2009)—two detected planets in the mass range Msin i = 5–30 M⊕ with P < 16 days orbiting 24 FGK dwarfs. The initial estimate of an occurrence rate of 30% ± 10% for Msin i = 3–30 M⊕ and P < 50 days based on measurements with HARPS (Mayor et al. 2009) is consistent with a close-in planet mass function that rises steeply with decreasing planet mass, but is inconsistent with the H10 occurrence measurement.
Population synthesis models of planet formation (Ida & Lin 2004, 2008; Mordasini et al. 2009) predict a dearth of close-in, low-mass planets. This "desert" emerges in the simulations from fast migration and accelerating planet growth. Most planets are born near or beyond the ice line and those that grow to a critical mass of several Earth masses either rapidly spiral inward to the host star or undergo runaway gas accretion and become massive gas giants. The distribution of planets in H10 contradicts this prediction; the highest planet occurrence rate is in the 3–30 M⊕ regime with short orbital periods. The two planets reported here have orbital parameters that place them in the so-called desert.
To measure the planet occurrence rate as a function of planet mass, H10 included previously detected planets as well as unannounced "planet candidates." Including candidates was necessary to reliably estimate occurrence fractions for low-mass planets, even though the candidates had formal false alarm probabilities (FAPs) as large as 5% at the time of the analysis (2010 June). Such an FAP implies that the planet is very likely to exist, but it is too high for the secure announcement of a definite planet detection with well-measured orbital parameters. Since then, we continued to intensively observe the planet candidates. Based on the new confirmatory data we report two of them here as bona fide planets. We present HD 97658 b, a close-in, super-Earth planet identified as "Candidate 3'' in Howard et al. (2010b), and Gl 785 b, a Neptune-mass planet identified as "Candidate 7."
Below we describe the host stars (Section 2) and the RV measurements (Section 3). We analyze these measurements with Keplerian models and assess the probability of spurious detections by computing FAPs (Sections 4 and 5). We describe photometric observations of HD 97658 and the limits they impose on planetary transits (Section 6). We discuss the radii of these planets and a trend in the host star metallicities among low-mass planets (Section 7).
2. STELLAR PROPERTIES
We used Spectroscopy Made Easy (Valenti & Piskunov 1996) to fit high-resolution spectra of HD 97658 (HIP 54906, GJ 3651) and Gl 785 (HD 192310, HIP 99825), using the wavelength intervals, line data, and methodology of Valenti & Fischer (2005). We further constrained surface gravity using Yonsei–Yale (Y2) stellar structure models (Demarque et al. 2004) and revised Hipparcos parallaxes (van Leeuwen 2007), using the iterative method of Valenti et al. (2009). The resulting stellar parameters listed in Table 1 are effective temperature, surface gravity, iron abundance, projected rotational velocity, mass, radius, and luminosity. For reference, Table 1 also lists spectral types, distances derived from Hipparcos, optical photometry from Tycho (Perryman et al. 1997; Bessell 2000), and near infrared photometry from the Two Micron All Sky Survey (2MASS; Cutri et al. 2003). Both stars are early K dwarfs on the main sequence.
Table 1. Stellar Properties of HD 97658 and Gl 785
| Parameter | HD 97658 | Gl 785 | Source |
|---|---|---|---|
| Spectral type | K1 V | K2 V | Gray et al. (2003) |
| MV | 6.27 ± 0.10 | 6.13 ± 0.02 | Tycho + Hipparcos |
| B − V | 0.843 ± 0.022 | 0.906 ± 0.017 | Tycho |
| V | 7.762 ± 0.012 | 5.723 ± 0.009 | Tycho |
| J | 6.203 ± 0.023 | 4.112 ± 0.294 | 2MASS |
| H | 5.821 ± 0.017 | 3.582 ± 0.266 | 2MASS |
| K | 5.734 ± 0.018 | 3.501 ± 0.232 | 2MASS |
| Distance (pc) | 21.11 ± 0.33 | 8.911 ± 0.024 | Hipparcos |
| Teff (K) | 5170 ± 44 | 5144 ± 50 | SMEa |
| log g | 4.63 ± 0.06 | 4.60 ± 0.06 | SME |
| [Fe/H] | −0.23 ± 0.03 | +0.08 ± 0.03 | SME |
| v sin i (km s−1) | 0.5 ± 0.5 | 0.5 ± 0.5 | SME |
| L⋆ (L☉) | 0.30 ± 0.02 | 0.34 ± 0.02 | Y2+ SMEb |
| M⋆ (M☉) | 0.78 ± 0.02 | 0.85 ± 0.02 | Y2+ SME |
| R⋆ (R☉) | 0.68 ± 0.02 | 0.73 ± 0.02 | Y2+ SME |
| log R'HK | −4.95 to −5.00 | −4.90 to −5.02 | Isaacson & Fischer (2010) |
| SHK | 0.169 to 0.197 | 0.169 to 0.226 | Isaacson & Fischer (2010) |
Notes. aSME: "Spectroscopy Made Easy" package for the analysis of high-resolution spectra. These parameters rely primarily on SME, but have a small dependence also on an iterative analysis incorporating an isochrone search, as described in Valenti et al. (2009). bY2+ SME: based on the Yonsei–Yale isochrones with iterative refinements from SME.
Download table as: ASCIITypeset image
HD 97658 lies 0.46 mag below the Hipparcos average main sequence (MV versus B − V) as defined by Wright (2005). This location is consistent with the low metallicity of [Fe/H] = −0.23 ± 0.03. Gl 785 is 0.06 mag above the Hipparcos average main sequence, consistent with its slightly super-solar metallicity of [Fe/H] = +0.08 ± 0.03.
Measurements of the cores of the Ca ii H and K lines of each spectrum (Figure 1) show low levels of chromospheric activity, as quantified by the SHK and log R'HK. These chromospheric indices show long-term trends over the six years of measurements, possibly partial activity cycles, so we list ranges of activity indices in Table 1. We detect a weak correlation between individual RVs and SHK measurements for HD 97658, but not for Gl 785. This correlation, with a Pearson linear correlation coefficient of r = +0.35, does not appear to affect the Keplerian fit of HD 97658 b because the SHK time series has negligible Fourier power at or near the adopted orbital period, even when the long-term activity trend is removed.
Figure 1. Keck-HIRES spectra of the Ca ii H line of the early K dwarf stars HD 97658 and Gl 785. Slight line core emission near 3968 Å indicates modest chromospheric activity.
Download figure:
Standard image High-resolution imageFollowing Isaacson & Fischer (2010) and based on SHK, MV, and B − V, we estimate an RV jitter of 1.5 m s−1 for these stars. This empirical estimate is based on an ensemble of stars with similar characteristics and accounts for RV variability due to rotational modulation of stellar surface features, stellar pulsation, undetected planets, and uncorrected systematic errors in the velocity reduction (Saar et al. 1998; Wright 2005). Jitter is added in quadrature to the RV measurement uncertainties for Keplerian modeling.
3. KECK-HIRES VELOCITY MEASUREMENTS
We observed HD 97658 and Gl 785 with the HIRES echelle spectrometer (Vogt et al. 1994) on the 10 m Keck I telescope. The observations of each star span six years (2004–2010). All observations were made with an iodine cell mounted directly in front of the spectrometer entrance slit. The dense set of molecular absorption lines imprinted on the stellar spectra provides a robust wavelength fiducial against which Doppler shifts are measured, as well as strong constraints on the shape of the spectrometer instrumental profile at the time of each observation (Marcy & Butler 1992; Valenti et al. 1995).
We measured the Doppler shift of each star-times-iodine spectrum using a modeling procedure descended from Butler et al. (1996) as described in Howard et al. (2011). The velocity and corresponding uncertainty for each observation is based on separate measurements for ∼700 spectral chunks each 2 Å wide. Once the two planets announced here emerged as candidates (about two years ago) we increased the nightly cadence of measurements and made three consecutive observations per night to reduce the Poisson noise from photon statistics. We calculate one mean velocity for multiple observations in a 2 hr interval.
The highest RV measurement precision using Keck-HIRES has been achieved on chromospherically inactive late G and early K dwarfs, like the two stars presented here. The quietest of these stars are stable over many years at the ∼1.5–2.0 m s−1 level (Howard et al. 2009, 2010a, 2011); velocity residuals are due to astrophysical perturbations, instrumental/systematic errors, and Poisson noise. All of the measurements reported here were made after the HIRES CCD upgrade in 2004 August and do not suffer from the higher noise and systematic errors that limited the precision of pre-upgrade measurements to ∼2–3 m s−1 for most stars.
For each star we constructed a single-planet Keplerian model using the orbit fitting techniques described in Howard et al. (2010a) and the partially linearized, least-squares fitting procedure described in Wright & Howard (2009). The Keplerian parameter uncertainties for each planet were derived using a Monte Carlo method (Marcy et al. 2005) and do not account for correlations between parameter errors. Uncertainties in Msin i reflect uncertainties in M⋆ and the orbital parameters.
4. HD 97658
The RVs and SHK values from Keck-HIRES are listed in Table 2. Figure 2 shows a Lomb–Scargle periodogram (Lomb 1976; Scargle 1982) of the RVs with a substantial peak at 9.494 days. We used that period, as well as a wide variety of other trial periods, as seeds for the Keplerian fitting algorithm (Wright & Howard 2009). Our search identified as the best fit the single-planet orbital solution listed in Table 3 and depicted in as a time series in Figure 3.

Figure 2. Lomb–Scargle periodogram of RV measurements of HD 97658. The tall peak near P = 9.494 days suggests a planet with that orbital period.
Download figure:
Standard image High-resolution image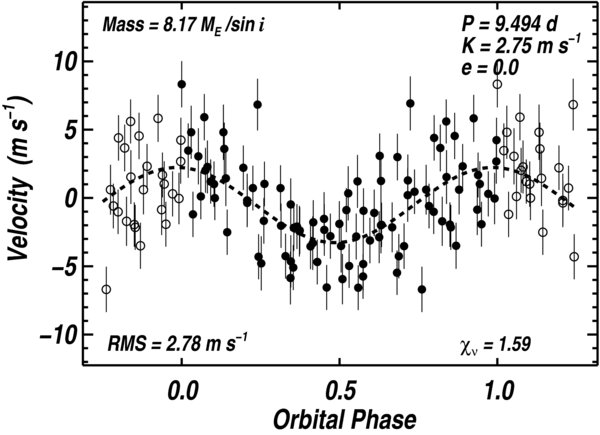
Figure 3. Single-planet model for the RVs of HD 97658, as measured by Keck-HIRES. The dashed line shows the best-fit circular orbital solution. Filled circles represent phased measurements while the open circles represent the same velocities wrapped one orbital phase. The error bars show the quadrature sum of measurement uncertainties and 1.5 m s−1 jitter.
Download figure:
Standard image High-resolution imageTable 2. Radial Velocities and SHK values for HD 97658
| JD − 2440000 | Radial Velocity | Uncertainty | SHK |
|---|---|---|---|
| (m s−1) | (m s−1) | ||
| 13398.04143 | 3.40 | 0.78 | 0.197 |
| 13748.03543 | 1.41 | 0.79 | 0.190 |
| 13806.96152 | 3.56 | 0.79 | 0.187 |
| 14085.15873 | −2.56 | 0.83 | 0.178 |
| 14246.87902 | −3.08 | 0.73 | 0.176 |
| 14247.83980 | −5.21 | 1.07 | 0.175 |
| 14248.94470 | −0.60 | 1.16 | 0.169 |
| 14249.80244 | 1.19 | 1.24 | 0.174 |
| 14250.83983 | −0.72 | 0.99 | 0.174 |
| 14251.89455 | 0.64 | 1.09 | 0.172 |
| 14255.87104 | −1.07 | 0.79 | 0.174 |
| 14277.81740 | −1.94 | 1.04 | 0.177 |
| 14278.83838 | 1.33 | 1.03 | 0.175 |
| 14279.83000 | 1.07 | 1.00 | 0.176 |
| 14294.76351 | −0.07 | 1.15 | 0.169 |
| 14300.74175 | 3.77 | 1.22 | 0.172 |
| 14304.76223 | −2.53 | 1.23 | 0.174 |
| 14305.75910 | −0.11 | 0.81 | 0.174 |
| 14306.77175 | 3.55 | 1.15 | 0.169 |
| 14307.74725 | 4.39 | 0.83 | 0.175 |
| 14308.75077 | 6.43 | 0.84 | 0.176 |
| 14309.74773 | 5.28 | 1.23 | 0.176 |
| 14310.74343 | 4.32 | 1.20 | 0.175 |
| 14311.74391 | 7.30 | 1.15 | 0.176 |
| 14312.74242 | −0.26 | 1.18 | 0.177 |
| 14313.74419 | −1.57 | 1.26 | 0.178 |
| 14314.75074 | 2.20 | 1.22 | 0.174 |
| 14455.15432 | −5.71 | 1.18 | 0.182 |
| 14635.79759 | −1.70 | 1.09 | 0.175 |
| 14780.12544 | −4.63 | 1.22 | 0.177 |
| 14807.09051 | −2.07 | 1.26 | 0.173 |
| 14808.15781 | 2.09 | 1.30 | 0.171 |
| 14809.14349 | 2.48 | 1.16 | 0.173 |
| 14810.02507 | 8.16 | 1.29 | 0.173 |
| 14811.11469 | 2.77 | 1.28 | 0.173 |
| 14847.11818 | −0.50 | 1.40 | 0.172 |
| 14927.89832 | 3.45 | 1.37 | 0.170 |
| 14928.96319 | −2.78 | 1.30 | 0.170 |
| 14929.84171 | −3.59 | 1.22 | 0.169 |
| 14954.97010 | 1.71 | 1.13 | 0.171 |
| 14955.92258 | 2.61 | 0.59 | 0.172 |
| 14956.90564 | 3.79 | 0.64 | 0.172 |
| 14963.96612 | 4.04 | 0.66 | 0.169 |
| 14983.87266 | 0.73 | 0.70 | 0.170 |
| 14984.90278 | −0.75 | 0.71 | 0.171 |
| 14985.84542 | −2.55 | 0.69 | 0.171 |
| 14986.88960 | −3.00 | 0.69 | 0.170 |
| 14987.89549 | −4.46 | 0.68 | 0.170 |
| 14988.84400 | −4.65 | 0.66 | 0.170 |
| 15041.75244 | 7.08 | 1.35 | 0.169 |
| 15164.11579 | 4.71 | 1.31 | 0.173 |
| 15188.15802 | −0.91 | 0.76 | 0.170 |
| 15190.13283 | −4.78 | 0.71 | 0.170 |
| 15191.16082 | −1.50 | 0.77 | 0.170 |
| 15192.12820 | 1.97 | 0.69 | 0.171 |
| 15193.11592 | 3.52 | 0.67 | 0.172 |
| 15197.14316 | −0.24 | 0.71 | 0.171 |
| 15198.06394 | −1.62 | 0.73 | 0.172 |
| 15199.08955 | −2.12 | 0.72 | 0.172 |
| 15256.95777 | 3.84 | 0.71 | 0.180 |
| 15285.94217 | −1.43 | 0.68 | 0.175 |
| 15289.83015 | 0.99 | 0.64 | 0.178 |
| 15311.78396 | −4.52 | 0.66 | 0.173 |
| 15312.85958 | −2.93 | 0.62 | 0.173 |
| 15313.76751 | 0.82 | 0.65 | 0.172 |
| 15314.78094 | 3.73 | 0.65 | 0.172 |
| 15317.96407 | 1.70 | 0.65 | 0.174 |
| 15318.94543 | −3.46 | 0.67 | 0.175 |
| 15319.90113 | −4.34 | 0.66 | 0.176 |
| 15320.85915 | −5.55 | 0.57 | 0.180 |
| 15321.83386 | −2.68 | 0.62 | 0.181 |
| 15342.87812 | −1.40 | 0.63 | 0.176 |
| 15343.82903 | −1.37 | 0.67 | 0.176 |
| 15344.88076 | 0.84 | 0.73 | 0.175 |
| 15350.78135 | −4.25 | 0.62 | 0.173 |
| 15351.88526 | −0.04 | 0.63 | 0.174 |
| 15372.75655 | 2.37 | 0.63 | 0.179 |
| 15373.78353 | −0.22 | 0.60 | 0.179 |
| 15374.75786 | −0.32 | 0.61 | 0.178 |
| 15375.77512 | −1.73 | 0.61 | 0.177 |
| 15376.74467 | −1.66 | 0.60 | 0.177 |
| 15377.74062 | −0.77 | 0.59 | 0.177 |
| 15378.74257 | 3.55 | 0.65 | 0.176 |
| 15379.79041 | 0.84 | 0.63 | 0.176 |
| 15380.74378 | 6.24 | 0.60 | 0.175 |
| 15400.74241 | 1.31 | 0.72 | 0.177 |
| 15401.76937 | 2.23 | 1.41 | 0.181 |
| 15403.73903 | −1.12 | 0.74 | 0.176 |
| 15404.73645 | −3.00 | 0.67 | 0.181 |
| 15405.74110 | −3.61 | 0.69 | 0.181 |
| 15406.73695 | −1.93 | 0.68 | 0.182 |
| 15407.75726 | 2.44 | 0.81 | 0.180 |
| 15410.73803 | 3.93 | 0.67 | 0.179 |
| 15411.73488 | 0.95 | 0.71 | 0.178 |
| 15412.73197 | −0.23 | 1.26 | 0.178 |
| 15413.73512 | 4.40 | 0.74 | 0.163 |
Table 3. Orbital Solution for HD 97658 b
| Parameter | Value |
|---|---|
| P (days) | 9.494 ± 0.005 |
| Tac (JD − 2,440,000) | 15375.01 ± 0.64 |
| eb | ≡0.0 |
| K (m s−1) | 2.75 ± 0.39 |
| M sin i (M⊕) | 8.2 ± 1.2 |
| a (AU) | 0.0831 ± 0.0011 |
| Nobs (binned) | 96 |
| Median binned uncertainty (m s−1) | 0.74 |
| Assumed jitter (m s−1) | 1.5 |
| σ (m s−1) | 2.78 |
 |
1.59 |
Notes. aTime of transit. bWe adopt a circular orbital solution for this planet.
Download table as: ASCIITypeset image
We also tried fitting the RVs with an eccentric Keplerian model and found a best-fit solution with a nearly identical orbital period and e = 0.17 ± 0.17, which is consistent with circular at the 1σ level. The detection of nonzero eccentricity with better than 95% confidence (2σ) requires approximately e/σe>2.45, where σe = σ/K · (2/N)0.5, σ is the measurement uncertainty (including jitter) and N is the number of uniformly phase-distributed measurements (Valenti et al. 2009; Lucy & Sweeney 1971). Our measurements do not meet this criterion. Furthermore, the eccentric model does not improve  compared to the circular model. We adopt the circular orbit model in Table 3.
We considered the null hypothesis—that the observed RVs are the chance arrangement of random velocities masquerading as a coherent signal–by calculating two FAPs. Using the method described in Howard et al. (2010a), we computed the improvement in Δχ2 from a constant velocity model to a Keplerian model for 103 scrambled data sets. In the first FAP test, we allowed for eccentric single-planet orbital solutions in the scrambled data sets. We found that three scrambled data sets had a larger Δχ2 than the measured velocities, implying an FAP of ∼0.003 for this scenario. When we restricted the search for orbital solutions to circular orbits, none of the scrambled data sets had a larger Δχ2 than measured velocities, implying an FAP of less than ∼0.001.
The rms of 2.78 m s−1 about the single-planet model is relatively high compared to the 1.67 m s−1 typical uncertainty (the quadrature sum of the median single measurement error and 1.5 m s−1 assumed jitter). This suggests that the measured RVs are compatible with additional detectable planets. We computed a periodogram of the RV residuals to the single-planet fit and found several periods with considerable power in the range ∼40–200 days. These peaks correspond to Doppler signals with ∼1.5–3 m s−1 semi-amplitudes. We considered two-planet orbital solutions with Pb seeded with the best-fit value from the single-planet model and Pc seeded with peaks in the residual periodogram. We allowed all orbital parameters including eccentricities to float in the two-planet fitting process (Wright & Howard 2009). No two-planet solutions were found with an FAP below 5%. We will continue to observe this star in search of additional planets.
Table 4. Radial Velocities and SHK Values for Gl 785
| JD–2440000 | Radial Velocity | Uncertainty | SHK |
|---|---|---|---|
| (m s−1) | (m s−1) | ||
| 13237.92941 | 1.73 | 0.59 | 0.2103 |
| 13301.71519 | 4.76 | 1.13 | 0.2260 |
| 13549.02705 | −2.75 | 1.02 | 0.2040 |
| 13926.01730 | −1.63 | 0.56 | 0.2023 |
| 13982.83072 | −0.75 | 0.50 | 0.1963 |
| 14247.08230 | −3.60 | 0.67 | 0.1955 |
| 14248.11326 | −5.82 | 0.96 | 0.1950 |
| 14249.12216 | −3.06 | 1.09 | 0.1920 |
| 14252.08848 | 1.73 | 0.93 | 0.1880 |
| 14256.08153 | −0.29 | 0.70 | 0.1890 |
| 14279.03644 | 0.22 | 1.14 | 0.1920 |
| 14280.04184 | 3.05 | 1.05 | 0.1940 |
| 14286.03340 | −4.38 | 1.18 | 0.1910 |
| 14294.99649 | −3.74 | 1.02 | 0.1950 |
| 14634.06380 | 8.57 | 1.15 | 0.1790 |
| 14634.98879 | 4.22 | 1.08 | 0.1830 |
| 14636.03115 | 4.50 | 1.10 | 0.1820 |
| 14637.06862 | 3.17 | 1.12 | 0.1820 |
| 14638.02072 | 3.31 | 1.13 | 0.1830 |
| 14639.05307 | 6.06 | 1.11 | 0.1850 |
| 14640.12929 | 2.63 | 1.08 | 0.1850 |
| 14640.97219 | 6.18 | 1.10 | 0.1850 |
| 14642.09539 | 2.88 | 1.20 | 0.1870 |
| 14644.10213 | 6.65 | 1.23 | 0.1870 |
| 14688.96417 | −2.62 | 1.09 | 0.1820 |
| 14689.98535 | −4.33 | 1.20 | 0.1830 |
| 14723.77286 | 3.43 | 1.19 | 0.1840 |
| 14724.80700 | 7.18 | 1.12 | 0.1830 |
| 14808.68992 | −2.04 | 1.01 | 0.1820 |
| 14984.07717 | −1.89 | 1.19 | 0.1750 |
| 15019.01660 | 1.78 | 1.10 | 0.1740 |
| 15026.96895 | −2.94 | 1.18 | 0.1740 |
| 15042.96436 | 0.91 | 1.13 | 0.1750 |
| 15073.75665 | 0.42 | 0.61 | 0.1760 |
| 15074.75183 | 1.27 | 0.55 | 0.1797 |
| 15077.74110 | 3.29 | 0.64 | 0.1780 |
| 15078.76189 | 1.28 | 0.76 | 0.1770 |
| 15079.73545 | 1.10 | 0.62 | 0.1770 |
| 15080.73918 | 1.01 | 0.58 | 0.1777 |
| 15084.72917 | 1.45 | 0.65 | 0.1743 |
| 15106.75946 | 0.73 | 1.21 | 0.1720 |
| 15109.74590 | −3.42 | 0.71 | 0.1740 |
| 15111.71917 | −3.85 | 0.68 | 0.1753 |
| 15135.74754 | 0.65 | 0.64 | 0.1717 |
| 15169.68272 | 0.91 | 0.72 | 0.1710 |
| 15290.15433 | 0.82 | 0.56 | 0.1687 |
| 15314.13774 | 4.09 | 0.59 | 0.1710 |
| 15319.14050 | 0.05 | 0.70 | 0.1667 |
| 15345.08584 | −5.30 | 0.65 | 0.1720 |
| 15351.09865 | −4.30 | 0.58 | 0.1720 |
| 15352.09190 | −4.02 | 0.61 | 0.1717 |
| 15374.11656 | 0.23 | 0.62 | 0.1743 |
| 15378.11262 | 1.56 | 0.59 | 0.1740 |
| 15379.10643 | −0.50 | 0.62 | 0.1697 |
| 15381.09845 | 3.29 | 0.63 | 0.1717 |
| 15397.04238 | −2.69 | 0.60 | 0.1720 |
| 15400.11504 | −1.87 | 0.61 | 0.1725 |
| 15401.04500 | −1.91 | 0.65 | 0.1717 |
| 15402.08245 | −1.58 | 0.69 | 0.1710 |
| 15404.84477 | −1.96 | 0.58 | 0.1727 |
| 15405.08736 | −0.55 | 0.64 | 0.1710 |
| 15407.93295 | −0.73 | 0.61 | 0.1753 |
| 15412.01241 | −5.21 | 0.60 | 0.1730 |
| 15413.05434 | −4.88 | 0.61 | 0.1740 |
| 15414.04948 | −4.98 | 0.65 | 0.1717 |
| 15414.92114 | −5.45 | 0.58 | 0.1740 |
| 15426.03531 | −2.65 | 0.68 | 0.1717 |
| 15427.00892 | −2.32 | 0.62 | 0.1710 |
| 15433.99704 | −3.37 | 0.58 | 0.1737 |
| 15435.78071 | −2.41 | 0.63 | 0.1756 |
| 15436.75896 | −2.30 | 0.63 | ⋅⋅⋅ |
| 15437.76291 | −3.55 | 0.57 | 0.1747 |
| 15438.76140 | −2.62 | 0.59 | 0.1770 |
| 15440.75917 | −4.52 | 0.59 | 0.1773 |
| 15455.73811 | 1.95 | 0.63 | 0.1750 |
5. GL 785
The RVs and SHK values from the Keck-HIRES measurements of Gl 785 are listed in Table 4. Figure 4 shows a Lomb–Scargle periodogram (Lomb 1976; Scargle 1982) of the RVs with a substantial peak near 74.4 days. We identify the peaks near 1.0 day as stroboscopic aliases of the sidereal day with the 74.4 days signal and other long periods (Dawson & Fabrycky 2010). We used 74.4 days, as well as a wide variety of other periods, as seed periods for the single-planet Keplerian fitting algorithm (Wright & Howard 2009). Our search identified as the best fit the single-planet orbital solution listed in Table 5 and depicted as a time series in Figure 5. The orbital eccentricity of 0.30 ± 0.09 is significant at the 3σ level.

Figure 4. Lomb–Scargle periodogram of RV measurements of Gl 785. The tall peak near P = 74.4 days suggests a planet with that orbital period.
Download figure:
Standard image High-resolution image
Figure 5. Single-planet model for the RVs of Gl 785, as measured by Keck-HIRES. The dashed line shows the best-fit eccentric orbital solution. Symbols have the same meanings as in Figure 3.
Download figure:
Standard image High-resolution imageTable 5. Orbital Solution for Gl 785 b
| Parameter | Value |
|---|---|
| P (days) | 74.39 ± 0.12 |
| Tac (JD − 2,440,000) | 15173.2 ± 2.0 |
| Tbp (JD − 2,440,000) | 15164.3 ± 3.6 |
| e | 0.30 ± 0.09 |
| K (m s−1) | 4.07 ± 0.41 |
| ω (deg) | 15 ± 19 |
| M sin i (M⊕) | 21.6 ± 2.0 |
| a (AU) | 0.319 ± 0.005 |
| Nobs (binned) | 73 |
| Median binned uncertainty (m s−1) | 0.68 |
| Assumed jitter (m s−1) | 1.5 |
| σ (m s−1) | 2.06 |
 |
1.17 |
Notes. aTime of transit. bTime of periastron passage.
Download table as: ASCIITypeset image
We considered the null hypothesis for the observed periodic signal in the measured RVs of Gl 785 by computing an FAP using the method described in Section 4, including allowing for eccentric solutions with the scrambled data sets. We found that none of the 103 scrambled data sets had a larger Δχ2 than the measured velocities, implying an FAP of less than ∼0.001.
With an rms of 2.06 m s−1 and a featureless periodogram of velocity residuals to the one-planet model, we do not see evidence for a second detectable planet orbiting Gl 785.
6. PHOTOMETRIC OBSERVATIONS
We acquired photometric observations of HD 97658 with the T12 0.80 m Automatic Photometric Telescope (APT), one of several automatic telescopes operated by Tennessee State University at Fairborn Observatory (Eaton et al. 2003). Gl 785 is too far south for this observatory. The APTs can detect short-term, low-amplitude brightness changes in solar-type stars resulting from rotational modulation in the visibility of active regions, such as starspots and plages (e.g., Henry et al. 1995b) and can also detect longer-term variations produced by the growth and decay of individual active regions and the occurrence of stellar magnetic cycles (e.g., Henry et al. 1995a; Hall et al. 2009). The TSU APTs can disprove the hypothesis that RV variations are caused by stellar activity, rather than planetary reflex motion (e.g., Henry et al. 2000a). Several cases of apparent periodic RV variations in solar-type stars induced by the presence of photospheric starspots have been discussed in the literature (e.g., Queloz et al. 2001; Paulson et al. 2004; Bonfils et al. 2007; Forveille et al. 2009). Photometry of planetary candidate host stars is also useful to search for transits of the planetary companions (e.g., Henry et al. 2000b; Sato et al. 2005; Gillon et al. 2007; Barbieri et al. 2007).
The T12 0.80 m APT is equipped with a two-channel photometer that uses two EMI 9124QB bi-alkali photomultiplier tubes to make simultaneous measurements of one star in the Strömgren b and y passbands. The T12 APT is functionally identical to the T8 APT described in Henry (1999).
During three consecutive observing seasons between 2008 January and 2010 June, the APT acquired 318 differential brightness measurements of HD 97658 with respect to the comparison star HD 99518 (V = 7.71, B − V = 0.343, F0). We combined the b and y differential magnitudes into (b + y)/2 measurements achieving typical single measurement precision of 1.5–2.0 mmag (Henry 1999). These measurements are plotted in the top panel of Figure 6 and have a standard deviation of 1.99 mmag, consistent with measurement error. Periodogram analysis confirms the absence of periodic variability between 1 and 100 days. The same measurements are plotted modulo the RV period in the second panel of Figure 6. A least-squares sine fit gives a semi-amplitude of 0.09 ± 0.14 mmag. This tight limit to photometric variability at the RV period supports the hypothesis that the RV signal is due to stellar reflex motion from a planet in motion. Measurements near phase 0.0 are replotted on an expanded scale in the bottom panel of Figure 6. The precision and phase coverage of our photometry are insufficient to detect shallow transits.
Figure 6. Top panel: the 318 Strom̎gren (b + y)/2 differential magnitudes of HD 97658 plotted against heliocentric Julian Date. The standard deviation of these normalized observations from their mean (dotted line) is 1.99 mmag. The second and third observing seasons have been normalized to match the mean brightness of the first season; the second and third year corrections were 1.75 and 0.70 mmag, respectively. This removes small year-to-year brightness changes in HD 97658 and its comparison star and maximizes sensitivity to brightness variability on night-to-night timescales. Middle panel: the measurements plotted modulo the RV period with phase 0.0 equal to the predicted time of mid-transit (Table 3). Bottom panel: the measurements near phase 0.0 plotted on an expanded scale. The vertical error bar in the lower right corresponds to the 1.87 mmag single measurement uncertainty. The duration of a hypothetical central transit is 3 hr (±0.0066 phase units); the uncertainty of the transit midpoint is 0.64 days (0.067 phase units). The solid curve in the two lower panels approximates the depth (0.001 mag) and duration (3 hr) of a water/ice planet.
Download figure:
Standard image High-resolution image
7. DISCUSSION
We announce two low-mass planets that were reported as anonymous "planet candidates" in Howard et al. (2010b). HD 97658 b is a super-Earth planet with minimum mass Msin i = 8.2 ± 1.2 M⊕ in an orbit of P = 9.494 ± 0.005 around a K1 dwarf star. Gl 785 b is a Neptune-mass planet with minimum mass Msin i = 21.6 ± 2.0 M⊕ in an orbit of P = 74.39 ± 0.12 days, also orbiting a K1 dwarf.
We see no evidence for transits of HD 97658 b, although our ephemeris and photometric phase coverage preclude detection of all but the deepest transits of a bloated planet. However, given the a priori transit probability of 4%, it is instructive to speculate about the transit signatures of various possible planet compositions. Using the models in Seager et al. (2007), an 8 M⊕ planet composed of pure Fe, MgSiO3, H2O, or H would have radii Rpl = 1.3, 1.9, 2.4, and 5.5 R⊕, producing transits of depth 0.3, 0.6, 1.0, and 5.2 mmag, respectively. These homogeneous planet models are oversimplified, but set the scale for admixtures of those ingredients. Transits of planets made of solids and water would have depths of ∼0.3–1.0 mmag, while transits of a planet with a significant atmosphere could be much deeper.
We have no constraints on transits of Gl 785 b because the host star is too far south for APT observations. The a priori transit probability is 1%. For comparison, we considered the transiting planets HAT-P-11b (Bakos et al. 2010) and HAT-P-26b (Hartman et al. 2010), which have masses 26 M⊕ and 19 M⊕ and radii 4.7 R⊕ and 6.3 R⊕, respectively. The implied densities, 1.38 and 0.42 g cm−3, suggest that these planets have considerable gas fractions. If GL 785 b has a radius in the range 4.7–6.3 R⊕, equatorial transits will be 4.4–7.8 mmag deep. Such transits would be readily detectable from the ground, but would require a considerable observational campaign given the transit time uncertainty of ±2.0 days.
Fischer & Valenti (2005) showed that the occurrence of giant planets with K>30 m s−1 correlates strongly with [Fe/H]. This work and other metallicity studies (e.g., Gonzalez 1997; Santos et al. 2004; Johnson et al. 2010) have been interpreted as support for core accretion models of exoplanet formation. However, low-metallicity stars might still be able to form less massive planets. Valenti (2010) noted that stars known to host only planets less massive than Neptune (17 M⊕) tend to be metal poor relative to the Sun. HD 97658 ([Fe/H] = −0.23 ± 0.03, Msin i = 8.2 ± 1.2 M⊕) and Gl 785 ([Fe/H] = +0.08 ± 0.03, Msin i = 21.6 ± 2.0 M⊕) are consistent with this tentative threshold. Before interpreting this physically it is necessary to check for metallicity bias in the subsample of stars around which sub-Neptune mass planets can be detected with current techniques. Further, firmly establishing the apparent anti-correlation between host star metallicity and sub-Neptune mass planet occurrence is best done with a well-controlled sample with uniform detection characteristics, similar to Fischer & Valenti (2005), or with well-understood detectability, similar to the Eta-Earth Survey.
We thank the many observers who contributed to the measurements reported here. We gratefully acknowledge the efforts and dedication of the Keck Observatory staff, especially Scott Dahm, Hien Tran, and Grant Hill for support of HIRES and Greg Wirth for support of remote observing. We are grateful to the time assignment committees of the University of California, NASA, and NOAO for their generous allocations of observing time. Without their long-term commitment to RV monitoring, these long-period planets would likely remain unknown. We acknowledge R. Paul Butler and S. S. Vogt for many years of contributing to the data presented here. G.W.M. acknowledges NASA grant NNX06AH52G. G.W.H. acknowledges support from NASA, NSF, Tennessee State University, and the State of Tennessee through its Centers of Excellence program. This work made use of the SIMBAD database (operated at CDS, Strasbourg, France), NASA's Astrophysics Data System Bibliographic Services, and the NASA Star and Exoplanet Database (NStED). Finally, the authors wish to extend special thanks to those of Hawai'ian ancestry on whose sacred mountain of Mauna Kea we are privileged to be guests. Without their generous hospitality, the Keck observations presented herein would not have been possible.
Footnotes
- *
Based on observations obtained at the W. M. Keck Observatory, which is operated jointly by the University of California and the California Institute of Technology. Keck time has been granted by both NASA and the University of California.
- 10