


ABSTRACT
The infrared multiple-photon dissociation (IRMPD) spectra of protonated acenaphthene ([ACN+H]+) and 9,10-dihydrophenanthrene ([DHP+H]+) have been recorded using an infrared free electron laser after the compounds were protonated by electrospray ionization and trapped in a Fourier transform ion cyclotron mass spectrometer. In both compounds, the loss of two mass units is predominant. Density functional calculations (B3LYP/6–311++G(d,p)) of the infrared spectra of all possible protonated isomers of each species showed that the observed IRMPD spectra are best fit to the isomer with the largest proton affinity and lowest relative electronic energy. Potential energy surfaces of the most stable isomers of [ACN+H]+ and [DHP+H]+ have been calculated for H and H2 loss. The lowest energy barriers are for loss of H2, with predicted energies 4.28 and 4.15 eV, respectively. After H2 ejection, the adjacent aliphatic hydrogens migrate to the bare ejection site and stabilize the remaining fragment. Single H loss may occur from [ACN+H]+ but the energy required is higher. No single H loss is predicted from [DHP+H]+, only H migration around the carbon skeleton. The vibrational bands in the parent closed-shell protonated polycyclic aromatic hydrocarbons are compared to bands observed from the interstellar medium.
Export citation and abstract BibTeX RIS
1. INTRODUCTION
Understanding the complex and dynamic processes involved in the generation and destruction of molecular hydrogen in the interstellar medium (ISM) is a major challenge for interstellar chemistry. Molecular hydrogen is the most abundant molecule in our universe and plays a key role in the reactions of H-bearing interstellar molecules. Such molecules serve as sources for the hydrogen ejected into the ISM via various fragmentation processes such as electromagnetic irradiation, collisions with space particles, and radiative association. One much-discussed set of H-bearing molecules is the polycyclic aromatic hydrocarbons (PAHs), which are believed to be important constituents of the ISM.
The suggestion that PAHs exist in the ISM was originally made by Léger & Puget (1984) and Allamandola et al. (1985, 1989) to account for the presence of a series of infrared emission bands at 3.3, 6.2, 7.8, 8.6, and 11.3 μm. These bands were observed initially from the brightest infrared objects by Gillett et al. (1973), Russell et al. (1977), and Willner et al. (1977), but later observations have also detected these bands from many other sources, including reflection and planetary nebulae, H ii regions, post-AGB objects, some regions of the Milky Way and other galaxies (Verstraete et al. 1996, 2001; Moutou et al. 1999; Joblin et al. 2000; Genzel et al. 1998; Henning et al. 1998; Boulanger et al. 1998; Mattila et al. 1996, 1999; Van Kerckhoven et al. 2000; Hony et al. 2001; Peeters et al. 2002; Tielens 2005, 2008). Over the last 20 years, laboratory experiments conducted in conjunction with theoretical calculations have documented that PAHs in the ISM are likely present in a wide range of sizes, geometries, and states of hydrogenation and ionization (Szczepanski et al. 1992, 1995; Szczepanski & Vala 1993a, 1993b; Vala et al. 1994; Bauschlicher & Langhoff 1997; Hudgins & Allamandola 1995, 1997, 1999; Hudgins et al. 2000, 2001, 2005; Allamandola et al. 1999; Kim & Saykally 2002; Lorenz et al. 2007; Mattioda et al. 2005; Le Page et al. 2003; Oomens et al. 2000, 2001, 2003, 2006; Langhoff 1996; Langhoff et al. 1998; Verstraete et al. 2001; Bakes et al. 2001; Ricca et al. 2007; Draine & Li 2001; Li & Draine 2001; Solca & Dopfer 2002; Pech et al. 2002; Wang et al. 2005; Knorke et al. 2009; Zhao et al. 2009).
Many PAH cations have been shown to photodecompose, either by eliminating atomic and/or molecular hydrogen or hydrocarbon fragments. For example, using Fourier transform ion cyclotron resonance (FTICR) mass spectrometry, Ekern and coworkers demonstrated that a number of PAH cations, when exposed to broadband visible and UV radiation, dissociate by losing multiples of 2H or H2, and, in some cases, eventually form carbon-only species (Ekern et al. 1998). Substantial advances in this area have recently been made by coupling a wavelength-tunable infrared laser source to an FTICR mass spectrometer. Absorption of multiple infrared photons resonantly dissociates any ions trapped in the FTICR cell, so that by observing the decrease in the mass signal of a trapped parent ion and/or the increase in a fragment signal versus the IR wavelength, the signature IR spectrum of the parent ion can be routinely recorded (Oomens et al. 2006). When this output is compared to theoretical spectral calculations, the structure of the unknown gas-phase ionic species may be determined.
Over the years, a number of models on the formation of H2 in the ISM have been developed. The prevailing view has long been that H2 is formed by H atom combination on small dust grains. Recently, however, several new proposals have been made in which PAHs are thought to act as catalytic centers for the formation of H2. One model, initially suggested by Cassam-Chenai et al. (1994) and Pauzat & Ellinger (2001), was later independently refined by Bauschlicher (1998) and Hirama et al. (2004). In this model, a gas-phase hydrogen atom is first captured by a PAH cation. This hydrogen is then abstracted by a second H atom, thus forming H2. The first H addition reaction was computed to be exothermic and the second abstraction reaction to possess a zero or very small activation barrier, enabling the overall reaction to occur at low temperatures. In an alternate model, Le Page et al. (2009) suggested that after trapping of an H atom on the periphery of a PAH, H2 can be released through dissociative recombination of the hydrogenated ion with an electron.
In the H2 formation model described here, it is suggested that molecular hydrogen is ejected from an aliphatic carbon on the PAH skeleton. We show that if protonated PAHs are excited, large amplitude scissoring vibrations on the aliphatic carbon can play a crucial role in the formation and ejection of H2. In such vibrations, the two hydrogens approach, form a long H–H bond, while simultaneously lengthening and weakening the C–H bonds. After mounting an energy barrier, a weak complex between H2 and the closed-shell [PAH+H]+ cation is formed. The complex then dissociates, finally ejecting molecular hydrogen.
In this work, the gas-phase infrared multiple-photon dissociation (IRMPD) spectra for protonated acenaphthene ([ACN+H]+) and 9,10-dihydrophenanthrene ([DHP+H]+) have been recorded (see Figure 1 for structures). The neutral compounds each possess two sp3 carbons, and, upon protonation, form a third aliphatic site. When the experimental IRMPD spectra are compared to the results of density functional theory calculations (B3LYP/6–311++G(d,p)), the specific site of protonation can be established. In both cases, the predicted lowest energy structures fit the observed vibrational spectra well.
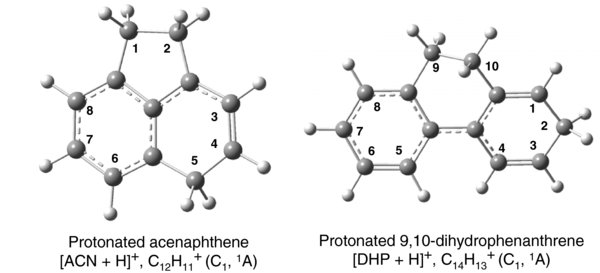
Figure 1. Equilibrium geometries for most stable isomers of protonated acenaphthene ([ACN+H]+) and protonated 9,10-dihydrophenanthrene ([DHP+H]+) calculated at the B3LYP/6–311++G(d,p) level.
Download figure:
Standard image High-resolution imageCalculation of the potential energy surfaces (PESs) for both protonated PAHs along atomic and molecular hydrogen dissociation channels reveals that the lowest energy pathway in both cases is the loss of molecular hydrogen. This is consistent with the experimental observation of loss of two mass units during the IRMPD process. The present work extends a previously reported study on a similar but smaller PAH cation, protonated 1,2-dihydronaphthalene (Vala et al. 2009b).
2. METHODS
2.1. IRMPD Experiment
Experiments on gaseous protonated ACN and DHP were performed on a 4.7 T Fourier-transform ion cyclotron resonance mass spectrometer (FTICR-MS) coupled to a free electron laser with tunable output in the infrared (Free Electron Laser for Infrared eXperiments (FELIX); Oepts et al. 1995). The experimental apparatus has been previously described in Valle et al. (2005). The protonated sample was formed by electrospray ionization of an 80:20:0.02 methanol/water/ammonium acetate solution of ∼5 mM of neutral ACN or DHP with an infusion rate of ∼30 μL minute−1. Trapped ions were exposed to 5 μs long laser macropulses (50 mJ, 10 Hz). Each macropulse contains a group of approximately 1 ps long pulses separated by 1 ns. For protonated ACN (m/z 155), the dominant IRMPD fragment channel is the loss of two mass units (to form m/z 153). For protonated DHP (m/z 181), the dominant decomposition channel is also the loss of two mass units (to m/z 179), with minor peaks observed at m/z 166,165, and 153. Deuteration experiments on ACN were performed by dissolution in CH3OD and D2O, together with NH4CO2CH3. Deuteronated ACN showed a mass peak at m/z 156 which under infrared multiple-photon irradiation yielded a peak at m/z 154. An analogous experiment on DHP was attempted, but was unsuccessful.
2.2. Modeling of IRMPD Spectra and PES Dissociation Pathways
Molecular equilibrium geometries and their associated vibrational harmonic mode frequencies for both [ACN+H]+ and [DHP+H]+ cations were calculated using density functional theory with the Gaussian 03 program package (Frisch et al. 2004). Becke's three-parameter hybrid functional, the non-local correction functional of Lee, Yang, and Parr (B3LYP), with a 6–311++G basis set and d and p polarization functions on heavy and hydrogen atoms, respectively, was applied. For both [ACN+H]+ and [DHP+H]+, the IRMPD spectra have been modeled using the B3LYP/6–311++G(d,p) harmonic vibrational calculations. The vibrational frequencies in the mid-IR range were scaled by a factor of 0.98 and for CH stretching modes by 0.955 to correct for anharmonicity effects and functional/basis set deficiencies. This empirically established scaling factor was adopted from our previous work (Vala et al. 2009a) where a similar level of theory was applied in the study of protonated 1-azapyrene.
The reliability of these scaling factors was verified by looking at the highest energy CC stretching frequencies for protonated benzene and protonated naphthalene. Douberly et al. (2008) recently recorded an IRPD (single-photon infrared photodissociation) band at 1607 cm−1 for protonated benzene, while Ricks et al. (2009) found an IRPD band at 1617 cm−1 for protonated naphthalene. Our calculations yield 1605.5 and 1619.7 cm−1 for these two frequencies, respectively, after scaling by 0.98. Observed frequencies of 2820 and 2850 cm−1 were found by the above workers for the C(sp3)H stretching modes. After scaling by 0.955, our calculations predict 2818.1 cm−1 for protonated benzene and 2842.2 cm−1 for protonated naphthalene. Bands for the C(sp2)H stretching modes were observed (scaled computed values in parentheses) at 3035 (3037.7), 3078 (3064.0), and 3107 (3066.2) cm−1 in protonated benzene and near 3100 (3056.0) cm−1 in protonated naphthalene. These values show a reasonable match between predicted and observed frequencies and support the use of these scaling factors here.
In the PES calculation for single hydrogen ejection, all degrees of freedom were optimized except for the R(C–H) bond length which was increased stepwise. Electronic energies were not zero-point energy (ZPE)-corrected.
For the H2 ejection reactions, transition states (TSs) connecting the stable minima on the PESs were sought by applying the QST3 optimization procedure in Gaussian 03 (Frisch et al. 2004). The B3LYP/6–31++G(d,p) functional/basis set was used for [ACN+H]+; for the larger [DHP+H]+, the theory level was reduced to B3LYP/6–31G(d,p). The harmonic vibrational frequencies were calculated for each structure involved in the PES calculation in order to verify whether a first-order TS was present. If so, the electronic energies in the PES figures (vide infra) were ZPE-corrected without scaling.
3. RESULTS
3.1. Proton Affinities
Calculated proton or deuteron affinities (PA/DA) give a measure of the relative ability of a neutral molecule to add a proton (H+) or a deuteron (D+), plus its probable position of attachment (Foresman & Frisch 1996). For ACN, the proton/deuteron may attach at one of three carbons (positions 3, 4, or 5 in Figure 1). The largest PA/DA values (9.00/9.09 eV) were found for carbon 5 (B3LYP/6–311++G(d,p) level). The DA value is larger than the PA due to its lower ZPE, resulting in its slightly lower total electronic energy. The calculated PA for ACN is larger than the experimental by 0.163 eV (1.8%) (Hunter & Lias 1998). Using the same calculational level, we found a PA of 8.99 eV for the most stable isomer of 1,2-dihydronaphthalene (DHN) which compares reasonably well with the 8.72 eV value estimated using the more accurate G3 level (T. Zwier et al. 2010, private communication).
For 9,10-dihydrophenanthrene, the proton attaches at carbon 2 for the most stable protonated isomer. The PA of this site is 8.74 eV (B3LYP/6–311++G(d,p) level). Calculated PAs for the other sites are listed in Table 1.
Table 1. Calculated (B3LYP/6–311++G(d,p)) Proton/Deuteron Affinities (PA/DA) of Neutral Acenaphthene (ACN) and 9,10-Dihydrophenanthrene (DHP) for Indicated Protonation Site
| Sitea | ACN PA (eV) | ACN DA (eV) | DHP PA (eV) |
|---|---|---|---|
| 1 | 8.38 | ||
| 2 | 8.74 | ||
| 3 | 8.85 | 8.94 | 8.44 |
| 4 | 8.54 | 8.62 | 8.65 |
| 5 | 9.00 | 9.09 |
Note. aSee Figure 1 for site numbering.
Download table as: ASCIITypeset image
3.2. Mass Spectrometry and IRMPD Spectra for [ACN+H]+ and [ACN+D]+
Figure 2(a) shows the experimental IRMPD spectrum of [ACN+H]+ and the computed spectra for its three possible protonated isomers. The IRMPD spectrum has been adapted from work by Dopfer and coworkers who discuss the assignment of the spectral bands (Knorke et al. 2010; Zhao 2010; Dopfer 2008). For the computed spectra, Gaussian band profiles with bandwidths (FWHM) of 20 cm−1 were used in all our plots. The match with the predicted IR spectrum of the lowest energy isomer, 1,2,5-trihydroacenaphthene ion, is very good and clearly superior to the other two. All spectral features of the experimental spectrum marked by vertical lines are assignable to the strongest bands of the predicted spectrum.

Figure 2. Experimental IRMPD spectra of [ACN+H]+ (a) and [ACN+D]+ (b) (bottom panels) compared to predicted vibrational absorption spectra (B3LYP/6–311++G(d,p) level) of various protonated and deuteronated isomers. The relative ZPE-corrected isomer electronic energies are indicated. Experimental IRMPD spectrum in (a) is adapted from Knorke et al. (2010).
Download figure:
Standard image High-resolution imageAlthough this comparison readily identifies the specific isomer trapped, it does not indicate the aliphatic carbon from which the fragment dissociates. To decide whether hydrogen is released from the protonated carbon or one of the other two aliphatic carbons, a deuterated solvent experiment (in which a deuteron is added to ACN) was performed. Deuteronated ACN shows a parent mass peak at m/z 156. If HD (or H +D) is ejected from position 5, we expect the fragment ion peak will occur at m/z 153. If, however, H2 (or 2 H) is ejected from carbon 1 or 2, the fragment peak should occur at m/z 154. If ejection occurs from both positions, we expect peaks at both m/z 153 and 154. The experimental mass spectrum showed a peak only at m/z 154 (i.e., loss of H2 or 2 H from carbon 1 or 2 of the five-membered ring).
Further support for the attachment of the proton/deuteron at carbon 5 comes from a comparison of the experimental and calculated spectra of deuteronated ACN shown in Figure 2(b). The match with the lowest energy isomer, 1,2-dihydro-5-deuteroacenaphthene ion, is superior. We therefore conclude that the proton/deuteron attaches at position 5 on the ACN framework and that the fragmentation occurs from either carbon 1 or 2.
A major difference in the predicted mid-IR spectra for protonated and deuteronated ACN (Figure 2) arises for the HC(sp3)H and DC(sp3)H scissors modes on carbon 5. In the protonated species, this mode is predicted at 1345.5 cm−1 (58 km mol−1), marked as band S5, Figures 2(a) and (b); it shifts to 1173.8 cm−1 (64 km mol−1) in the deuteronated form. In the latter, there is a notable drop in intensity at ca. 1320 cm−1 as well as missing bands at 1200 and 800 cm−1 and a lowered fragment yield for the CC stretching modes (in the 1475– 1600 cm−1 range), indicating that deuteronated ACN is more difficult to dissociate than its protonated partner.
3.3. PES for Hydrogen Loss Pathways in Protonated Acenaphthene
Central to this study is the question of whether the loss of two mass units in the fragment produced by the absorption of multiple infrared photons is due to the loss of two hydrogen atoms or the loss of molecular hydrogen. And, if the latter, what is the mechanism for the formation and ejection of H2. To better understand the various photodissociation processes possible, partial PESs for the elimination of atomic hydrogen and molecular hydrogen have been calculated. Figure 3(a) shows a slice of the PES for the ejection of one of the hydrogens on carbon 1. For each point on the PES, all degrees of freedom were optimized, except for the C1–H1 bond length which was incremented. The figure indicates that the dissociation energy for H loss from this closed-shell cation is ∼5.20 eV. H loss from carbon 2 shows a similar PES plot with a marginally larger (0.1 eV) dissociation limit. For dissociation from carbon 5 (on the six-membered ring) the scenario is different. An increase in the C5–H5 bond length leads to H5 hopping to the adjacent carbon C4, and later to C3 on the six-membered ring. These hops require mounting energy barriers of 0.907 and 0.976 eV, respectively (Figure 3(b)). Since, in the first step of the reaction, the 1,2,5-trihydroacenaphthene cation reactant is 0.460 eV more stable than the 1,2,4-trihydroacenaphthene cation product, the rate constant for the backward reaction is expected to be larger than for the forward reaction, and these H-hopping reactions are not expected to drain much population from the 1,2,5-trihydroacenaphthene cation.
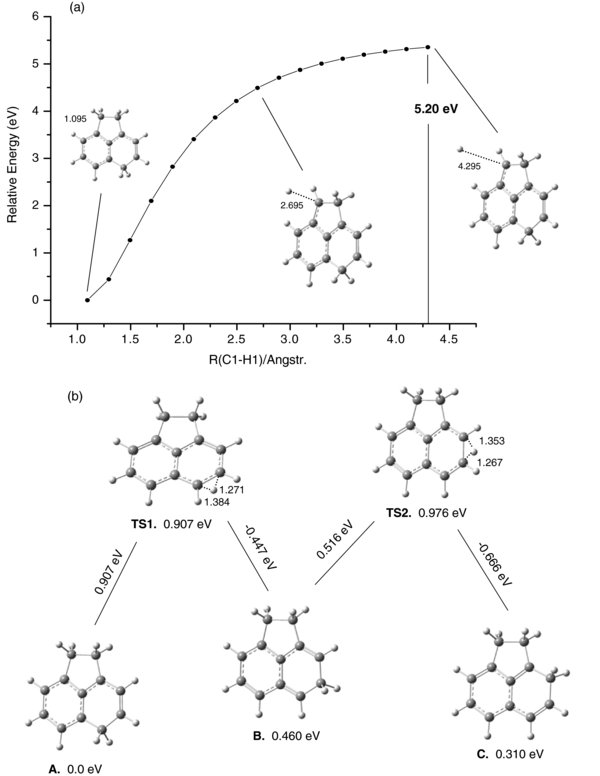
Figure 3. (a) The PES for single hydrogen loss from site 1 in [ACN+H]+. For each step increase in the C1–H1 bond length all other degrees of freedom were optimized. A very similar, barrierless PES plot was obtained for the scan of the C2–H2 bond length, only having a marginally larger (by 0.1 eV) dissociation limit. (b) Relative energy diagram for H migration from site 5 to site 3 of protonated ACN.
Download figure:
Standard image High-resolution imageFigure 4(a) shows the relative energy diagram calculated for molecular hydrogen H2 loss from [ACN+H]+ (structure A) when one H atom is removed from site 1 and the other from site 2. The calculated energy barrier for this reaction is 5.037 eV, the energy of the transition state TS1. TS1 connects A with the weakly bound complex B, both stable structures. No TS was found along the flat surface between B and C. Structure C is the first along this energy pathway from which H2 has been ejected. The energy difference between B and C is 0.015 eV downhill.
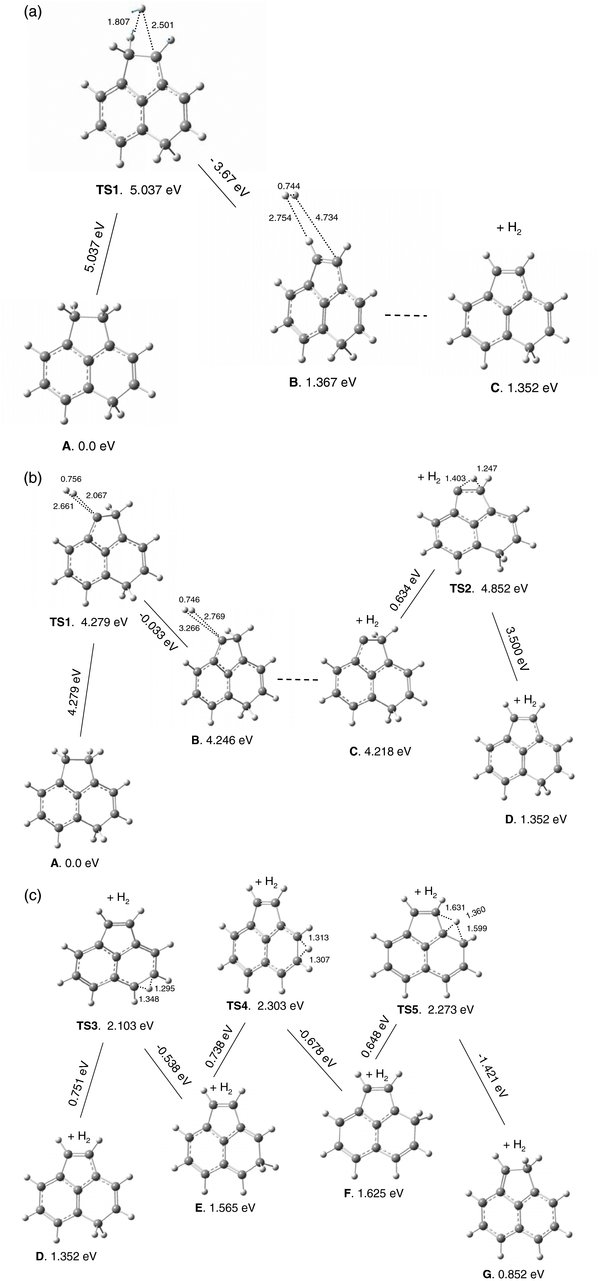
Figure 4. Relative energy diagram for the dissociation of molecular hydrogen from [ACN+H]+. In panel (a), one H atom is removed from site 1 and the other from site 2. The displacement vectors in TS1 are displayed for the calculated imaginary frequency of −665 cm−1, showing a tendency to form complex B. In panel (b), both H's are removed from site 1. Panel (c) shows the hydrogen migration in the [ACN+H]+ cationic fragment left after H2 loss.
Download figure:
Standard image High-resolution imageFigure 4(b) shows the relative energy diagram for H2 loss when two Hs are supplied by the same aliphatic carbon (carbon 1). Of all the H2 formation and ejection pathways studied, this has the lowest barrier (4.279 eV). During the large amplitude HC(sp3)H scissors vibration on carbon 1, the two Hs approach and start to interact, while pushing away from C1. When the TS1 barrier is passed, a complex between molecular H2 and 2,5-dihydro-ACN+ (B) is formed. This complex is very fragile and eventually converts to C. With one "naked" carbon, C is not a lowest energy structure. As Figure 4(b) shows, the adjacent H from HC(sp3)H on site 2 migrates to site 1 to cover the "naked" carbon. The barrier for this reaction is only 0.634 eV. Structure D then further transforms, via H atom migration, into the lowest energy isomer, G.
Figure 4(c) shows the relative energies calculated for H migration from site 5 on the six-membered ring in D to site 2 on the five-membered ring in G. The barriers for this multiple-step migration are 0.751, 0.738, and 0.648eV (TS3, TS4, and TS5). Interestingly, the barrier for H relocation from the six-membered ring to the five-membered ring is smaller (0.648 eV) than for H migration on the six-membered ring (0.751 and 0.738 eV). The final product after the H2 loss is protonated acenaphthylene, compound G.
3.4. IRMPD Spectrum for Protonated 9,10-dihydrophenanthrene
The calculated IR spectra for the four possible protonated DHP isomers are compared to the experimental IRMPD spectrum in Figure 5. The figure shows that the best fit is obtained when the proton is attached at carbon 2, which is the lowest energy isomer. The proposed band assignment is given in Table 2. Due to band broadening in the IRMPD spectrum, a general characteristic in IRMPD experiments (Oomens et al. 2003), some bands are assigned to more than one mode. The band intensity pattern in the observed spectrum (corrected for laser power) is remarkably similar to the predicted spectrum for the lowest energy isomer, even though the experimental spectrum is based on a multiphoton dissociation process and the predicted one on single-photon linear absorption.
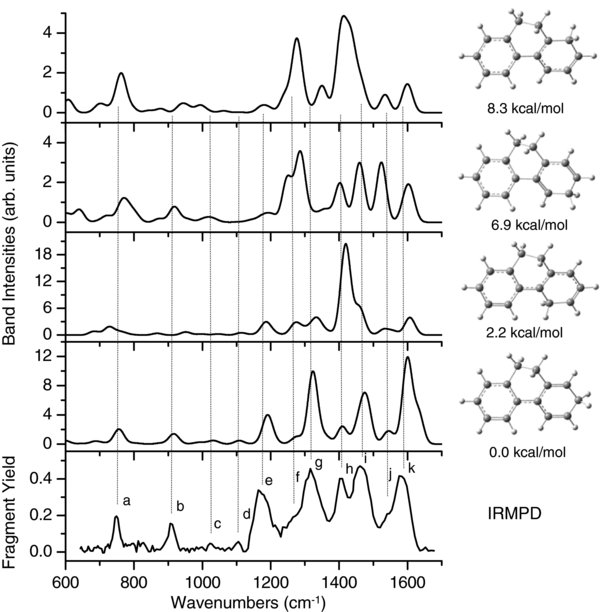
Figure 5. Experimental IRMPD spectrum of [DHP+H]+ (bottom) compared to predicted vibrational absorption spectra (at B3LYP/6–311++G(d,p) level) of various isomers. The relative ZPE-corrected isomer electronic energies are indicated.
Download figure:
Standard image High-resolution imageTable 2. Calculated Vibrational Absorption Mode Frequencies Compared to Experimental IRMPD Spectrum of Protonated 1,2-Dihydrophenanthrene with Proposed Band Assignments
| Modea | νcal b (cm−1) | νexp c (cm−1) | Modea | νcal b (cm−1) | νexp c (cm−1) |
|---|---|---|---|---|---|
| ε+τ | 748.8 (0.05) | d | R+β | 1360.4 (0.06) | |
| ε+τ | 758.3 (0.13) | 749 (a) | R+b | 1409.1 (0.21) | 1405 (h) |
| R(C2−C3) | 913.2 (0.08) | 909 (b) | p(site9&10)+b | 1450.7 (0.05) | |
| ε+τ | 923.3 (0.04) | p(site9&10)+b | 1453.5 (0.05) | ||
| ε+τ | 1034.5 (0.02) | 1028 (c) | p(site9)+b | 1466.8 (0.27) | e |
| α+β | 1107.9 (0.04) | 1105 (d) | R+b | 1482.3 (0.40) | 1461 (i) |
| α+β | 1179.7 (0.03) | R+b | 1541.4 (0.13) | 1533 (j) sh | |
| α+β | 1191.4 (0.30) | 1170 (e) | R+b | 1560.1 (0.05) | |
| α+β | 1213.1 (0.03) | R+b | 1599.4 (1.00) | 1579 (k) | |
| α+β | 1265.5 (0.03) | R+b | 1632.1 (0.36) | f | |
| α+β | 1279.7 (0.07) | 1270 (f) sh | r(C(sp3)H2) | 2832.4(0.06) | |
| p (site 2)+R | 1315.2 (0.02) | r(C(sp3)H2') | 2837.7(0.05) | ||
| p (site 2) | 1323.1 (0.80) | 1316 (g) | r(C(sp3)H9) | 2954.2 (0.02) | |
| R+b | 1339.9 (0.04) |
Notes. aNotation used: ε and τ are CCC and CCH out-of-plane, α and β are CCC and CCH in-plane bending, p are HC(sp3)H scissors, while R and r are CC and CH stretching modes, respectively. bVibrational frequencies of the calculated (at B3LYP/6−311++G(d,p)) spectrum are scaled uniformly by factors of 0.98 and 0.955 for mid-IR and C–H stretching modes, respectively. The integral intensity for the 1599.4 cm−1 band is 411 km mol−1. Only those modes with relative intensities (in parentheses) equal to or greater than 0.02 are listed. cIR multiphoton photodissociation (IRMPD) experiment (this work). The frequencies marked by the letters (a)–(k) refer to bands displayed in Figure 5, sh = band shoulder. dContributes to the band (a) intensity in the IRMPD spectrum of Figure 5. eContributes to the band (i) intensity in the IRMPD spectrum of Figure 5. fContributes to the band (k) intensity in the IRMPD spectrum of Figure 5.
Download table as: ASCIITypeset image
In the low energy range, bands a and c are assigned primarily to CH out-of-plane vibrations, as typical in this energy range for "regular" PAHs (i.e., planar, without aliphatic groups). The "extra" band b (compared to regular PAHs) at 909 cm−1 (11.0 μm) is assigned to the C2–C3 single bond stretching vibration; the calculated frequency is 913.2 cm−1. This is close in energy to the 11.3 μm ISM emission band. Bands d, e, and f are assigned to in-plane CH bending modes. The strong band e at 1170 cm−1 (8.55 μm) could contribute to the 8.6 μm ISM emission band. The next strongest band g at 1316 cm−1 (7.60 μm) is due to an HC(sp3)H scissors vibration on carbon 2. This band is close to the 7.8 μm ISM emission band.
The highest energy IRMPD bands h–k are also the most intense; they are assigned mainly to CC stretching modes. Band k has a peak centered at 1579 cm−1 (6.33 μ) (1599 cm−1 computed) and a high-energy shoulder extending to 1610 cm−1 (6.21 μm). There is a band predicted at 1632.1 cm−1 which is probably responsible for the high-energy shoulder.
3.5. PES for Hydrogen Loss in Protonated 9,10-dihydrophenanthrene
Loss of a single H from the aliphatic carbons in [DHP+H]+ is different from a similar loss in [ACN+H]+. As the C(sp3)–H bond is increased for any of the three aliphatic [DHP+H]+ carbons (2, 9, 10), the computation (Figure 6) shows that the hydrogens "prefer" to migrate around the ring rather than be ejected. After excitation, the hydrogens shift to adjacent sp2 carbons: from C2 to C1 or C3, from C9 to C8, and from C10 to C1, with predicted barriers of 0.881 (or 0.861), 3.176, and 3.709 eV, respectively. As noted above for ACN, the electronic energies of the products in such H-hopping reactions are larger than that of the reactant's. The depletion of the reactants is thus expected to be minimal and has little or no influence on the H2 loss reaction.

Figure 6. Relative energies for H migration in protonated 9,10-dihydrophenanthrene (a) from site 2 and (b) from site 9 (left) and site 10 (right).
Download figure:
Standard image High-resolution imageAn intriguing question remains: why is the PES for single H loss from [ACN+H]+ so different from H loss from [DHP+H]+? Computations show that for [ACN+H]+ no stable product structures exist for the migration of H from C2 to C3 or from C1 to C8. In the structures which result from H migration to C3 or C8, several sites have bonding deficiencies. After C2-to-C3 H migration, carbon C4 exhibits only three single bonds, and, similarly, after C1-to-C8 H migration, both C6 and C7 exhibit only three single bonds. In contrast, H migration from any of the three aliphatic carbons in [DHP+H]+ results in structures which are chemically feasible and fully optimizable. So the difference in single H activity (loss versus migration) in the two compounds is understandable.
Energy barriers for the loss of molecular hydrogen from aliphatic carbons C9 (Figure 7(a)) and C10 (Figure 7(b)) have been computed as 4.15 and 4.22 eV, respectively. As Figure 7(a) shows, TS1 (4.15 eV) connects A (0.0eV) with complex B (3.997 eV). The complex has a very shallow minimum, thus H2 is weakly bound in B. No TS was located between B and C, presumably due to the shallow nature of the PES in this region. In C, carbon 9 is "naked", having lost its two hydrogens to H2; subsequent migration of one H from the adjacent C10 sp3 carbon to C9 is very likely. In fact, the energy barrier for this reaction is predicted as only 0.233 eV (TS2). Structure D, created from C, results in substantially enhanced stability (3.468 eV more stable).
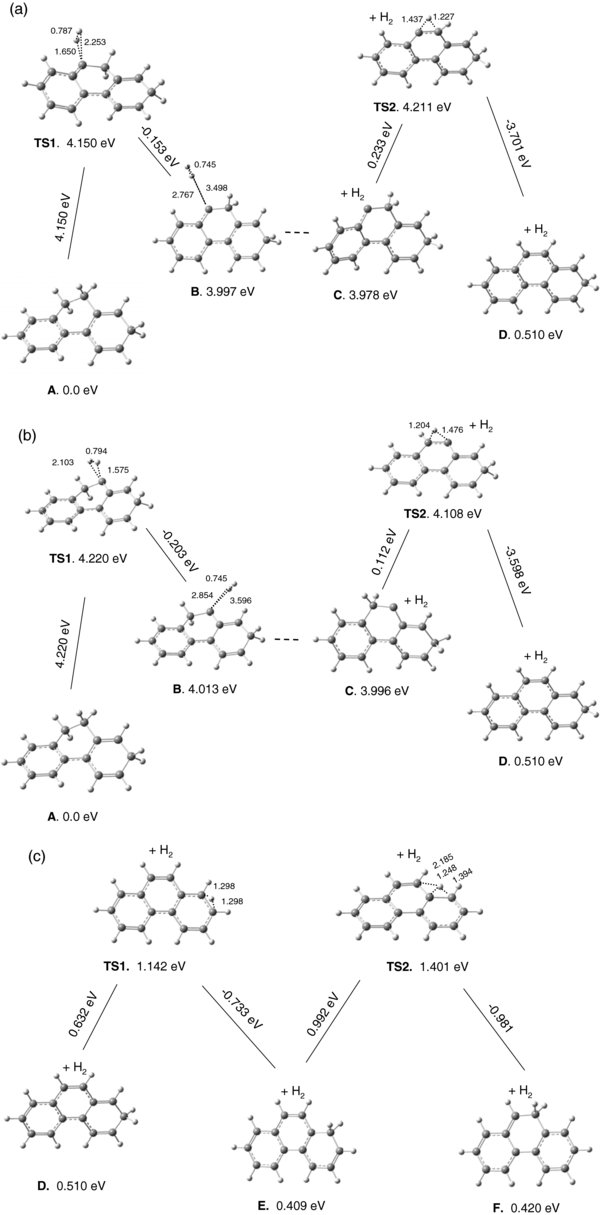
Figure 7. Relative energies for dissociation of molecular hydrogen from [DHP+H]+. Both H's are removed from site 9 (a) or from site 10 (b). In panel (c), the plot shows the hydrogen migration in the [DHP+H]+ cationic fragment left after H2 loss.
Download figure:
Standard image High-resolution imageThe PES for H2 removal from C10(sp3) is similar to that from C9. As Figure 7(b) shows, the major differences are (1) a marginally higher energy barrier in the first step (4.22 eV versus 4.15 eV) and (2) a slightly lower barrier in the second step (0.112 eV versus 0.233 eV). Overall, the A → D reactions in both cases are energetically very similar with a slightly lower energy for H2 loss from site 9. Interestingly, no reaction pathways for H2 loss were found starting from C5 in [ACN+H]+ or C2 in [DHP+H]+, the initial sites of protonation. This implies that at least two adjacent C(sp3) sites are required so that the "extra" H, on the site from which the H2 was not ejected, can be used to cover the "naked" adjacent carbon. Very low barriers of 0.634 eV in [ACN+H]+ and 0.233/0.112 eV in [DHP+H]+ are predicted for these migrations and result in greater stabilities (3.598 eV in [ACN+H]+ and 3.701/3.500 eV in [DHP+H]+).
Figure 7(c) shows the PES for hydrogen migration in the [DHP+H]+ cationic fragment (after H2 loss) from the higher energy site 2 (structure D) to the lower energy site 10 (structure F, 9-hydrophenanthrene cation). Two TSs (TS1 and TS2) were located with 0.632 and 0.992 eV barriers, respectively. Note that with a higher level of theory (B3LYP/6–311++G(d,p)) the electronic energy (ZPE-corrected) for F is only 0.00046 eV (3.7 cm−1) larger than the E isomer. This should be compared to the 0.011 eV (89 cm−1) difference displayed in Figure 7(c) (at B3LYP/6–31G(d,p)). We project that using higher levels of theory will probably further decrease or even reverse the energy difference between E and F. If so, products E and F will be energetically lower than reactant D, and if D is sufficiently excited to pass over the TS1 and TS2 energy barriers, the population of D will be drained and F will gain in concentration. The 1-hydrophenanthrene cation, E, is the final product predicted for the H2 loss reaction from protonated 9,10-dihydrophenathrene.
4. COMPARISON OF [ACN+H]+ AND [DHP+H]+ IR SPECTRA WITH INTERSTELLAR EMISSION SPECTRA
We now examine how the inclusion of up to three aliphatic groups in various related cationic PAHs influences their IR spectra and then compare these spectra with features of the interstellar IR emission spectra. A similar comparison has been made earlier by Pauzat & Ellinger (2001), though not on the species considered here. Figure 8 displays the calculated IR spectra for protonated acenaphthene (A), acenaphthene cation (B), protonated acenaphthylene (C), and acenaphthylene cation (D), as well as protonated 9,10-dihydrophenanthrene (E), 9,10-dihydrophenanthrene cation (F), protonated phenanthrene (G), and phenanthrene cation (H). Both D and B cations (Figure 8(a)) are open-shell systems (with doublet ground state spin multiplicities), which, after addition of an aliphatic C(sp3)H group, become C and A, respectively, i.e., closed-shell systems (with singlet ground state spin multiplicities). Similarly, H and F cations (Figure 8(b)) are doublets, and their G and E aliphatic partners are singlets.

Figure 8. Comparison of calculated (B3LYP/6–311++G(d,p)) harmonic vibrational absorption spectra of various cationic species related to (a) ACN and (b) DHP. The band positions are marked in μm units. Mid-IR band frequencies are scaled by 0.98, while the CH stretching band frequencies are scaled by 0.955.
Download figure:
Standard image High-resolution image
Starting with the CH stretching modes, two groups of bands are predicted: one at ca. 3.24–3.3 μm (C(sp2)H stretching vibrations) and another at 3.48–3.52 μm (C(sp3)H stretching). Relative intensities for the first group are very weak (<2% of all bands) and independent of the electronic ground state multiplicity. These very weak vibrations are typical of regular cationic (doublet) PAHs. The relative intensities for the second group are however larger; for example, 6% relative intensity for [DHP+H]+ (E). The 3.24–3.30 μm absorption bands fall close to the ISM 3.3 μm emission feature. To more realistically predict emission bands such as observed from space with computed and/or observed absorption bands, previous authors (Cherchneff & Barker 1989; Flickinger et al. 1991; Brenner & Barker 1992; Colangeli et al. 1992; Joblin et al. 1995; Cook & Saykally 1998; Hudgins et al. 2005) have suggested redshifting by ∼10 cm−1. In this case, this group of bands would occur in the 3.25–3.31 μm region. The second group of bands in the 3.48–3.52 μm range (3.49–3.53 μm when corrected for emission) coincides well with the low intensity 3.51 μm ISM emission feature (Bernstein et al. 1996; Sloan et al. 1997). In protonated naphthalene, a band observed at 3.5 μm was also ascribed to a C(sp3)H stretching mode (Ricks et al. 2009).
In the CC stretching region, a close similarity can be seen between the bands of protonated acenaphthylene (C) and protonated acenaphthene (A), and between protonated phenanthrene (G) and protonated 9,10-dihydrophenantrene (E); all four are closed-shell species. For G and E, the relative band intensities are similar. What is important here is that the strong, highest energy CC stretching modes at 6.59 and 6.33 μm, respectively, in the open-shell species B and D are shifted to shorter wavelengths in the closed-shell partners A and C, i.e., to 6.20 μm and 6.17 μm. In Figure 8(b), a similar blueshift in CC stretching modes is computed for the cationic open-shell species F and H at 6.32 and 6.38 μm. With an added aliphatic group, these bands shift to 6.25/6.13 (band shoulder) in E, and to 6.18 μm in the other closed-shell species, G.
A recent European Infrared Space Observatory (ISO) mission gathered data on many different ISM infrared emission sources. By studying the variation in the position of the broad interstellar 6.2 μm band, Peeters et al. (2002) concluded that the band actually consists of two bands, one located near 6.2 μm (6.215 ± 0.0215 μm) covering the 6.1–6.4 μm range (and called "Class A"), and the other near 6.3 μm (6.295 μm) covering the 6.2–6.55 μm range (and called "Class C"). In regular PAHs (without aliphatic groups), the CC stretching vibrations are closer in energy to class C bands than class A. Figure 8 shows that the 6.33 and 6.38 μm CC stretching bands (6.37 and 6.42 μm when converted to emission) for the cationic PAHs D and H could contribute to the broad class C band profile extending beyond 6.5 μm (Peeters et al. 2002). Bands in the Class A region have been observed previously in nitrogen-substituted PAHs (Peeters et al. 2002; Mattioda et al. 2005; Hudgins et al. 2005; Vala et al. 2009a; Galué et al. 2010) and their CC + CN stretching modes proposed as potential contributors to the ISM Class A band intensity. There is a different possible contributor. As Figure 7 shows, PAH cations which possess an odd number of C(sp3)H aliphatic groups (closed-shell systems) have high-energy CC stretching vibrations in absorption at 6.20 (A), 6.17 (C), 6.13 (E), and 6.18 μm (G), which when converted to emission wavelengths (applying a 10 cm−1 shift), would occur at 6.24, 6.21, 6.17, and 6.22 μm, respectively. These types of modes could contribute to the 6.2 μm class A interstellar emission band profile.
In a recent study of protonated 1,2-dihydronapthalene (a closed-shell PAH), the strong IR band predicted at 1613.3 cm−1 (6.20 μm) was assigned primarily to the CC stretching mode with a large integral intensity of 307 km mol−1 (Vala et al. 2009b). Its energy fits as a class A emission band. In other related studies of protonated benzene and naphthalene tagged by Ar atoms, the Duncan group recorded bands at 1607 cm−1 (6.22 μm) and 1617 cm−1 (6.18 μm) bands, respectively (Douberly et al. 2008; Ricks et al. 2009). As these experiments and our calculations show the highest energy CC stretching modes of protonated PAHs could contribute to the class A band profile at 6.2 μm.
The HCH scissors vibrations on aliphatic carbons of structures in Figure 8 contribute to the IR band profiles. In Figure 8(a), the group of bands at 7.48, 7.19, and 6.93 μm (weak, not marked) in the spectrum of A are assigned mainly to the scissors modes on sites 5, 2, and 1, respectively. In C, another closed-shell structure, its spectrum shows a strong band at 7.44 μm which is assigned to the HCH scissors mode on site 1. These scissors modes could contribute to the profile intensity of 7.8 μm ISM emission band. In contrast, in B (an open-shell system) the scissors modes are located on the low- and high-energy shoulders of 7.11 μm band; they are weak and blended with CC stretches and do not contribute much to the observed 7.11 μm band. In Figure 8(b), the bands at 7.56 and 6.75 μm are assigned to scissors vibrations on sites 2, 10, and 9/10 of structure E. In structure G, the strong scissors vibration contributes mainly to the 7.54 μm band (7.61 μm when converted to emission). These scissors modes in both closed-shell structures could contribute to the shoulder of the 7.8 μm ISM emission band. Again, F, an open-shell system, has very weak scissors modes located on the high energy side of the 6.99 μm band shoulder.
5. PROTONATED ACN AND DHP AND THE DIFFUSE INTERSTELLAR BANDS
Radical cationic PAHs have long been suggested as carriers of the diffuse interstellar bands (DIBs) in the visible part of the spectrum. Recently, hydrogenated PAHs have come under study. An investigation of the electronic spectroscopy of a number of hydrogenated PAHs and their cations in cryogenic matrices showed that several exhibit a band in close proximity to a DIB band (Halasinski et al. 2005), while other gas-phase studies have shown no match with DIB bands for small protonated PAHs (Bienner et al. 2004; Alata et al. 2010). It is therefore of interest to estimate the frequencies of the electronic transitions in protonated ACN and DHP and their corresponding radical cations. To this end, we have carried out time-dependent DFT (B3LYP/6–311++G(d,p)) calculations of the low-energy electronic transitions. For protonated ACN (A in Figure 8), the 0–0 transition energies (oscillator strengths) are predicted at 2.94 (0.0395), 3.73 (0.2163), 4.95 (0.0001), and 5.09 eV (0.1060) and for protonated DHP (E) they appear at 2.66 (0.0188), 3.33 (0.4545), 3.82 (0.1060), and 4.44 eV (0.0060). Similar calculations for the open-shell ACN radical cation (i.e., B) gave 1.37 (0.0000), 2.15 (0.0472), 2.98 (0.0057), and 3.48 eV (0.1114) and for the DHP radical cation (F) we found 1.09 (0.0018), 1.23 (0.0044), 2.21 (0.1400), and 3.00 eV (0.0010). Given that these values are only expected to be accurate to within 0.3 eV (Hirata et al. 2003; Banisaukas et al. 2003), a true comparison with the DIB features can only be obtained from gas-phase high-resolution experimental investigations. It is however rather unlikely that the present species will turn out to be responsible for a DIB band, given their small size. Indeed, it has been found that gas-phase radical cations of ACN and naphthalene can be definitely excluded as contributors to the DIBs (Bienner et al. 2004; Halasinski et al. 2005; Alata et al. 2010). Larger hydrogenated PAH cations are however likely candidates and deserve further study.
6. CONCLUSIONS
- 1.The infrared multiphoton dissociation spectra of gas-phase protonated acenaphthene and 9,10-dihydrophenanthrene were recorded using a Fourier transform ion cyclotron mass spectrometer coupled to an infrared free electron laser. In both cases, the predominant loss was of two mass units.
- 2.Density functional calculations (B3LYP/6–311++G(d,p)) of the infrared spectra of all possible protonated acenaphthene and 9,10-dihydrophenanthrene isomers showed that the observed IRMPD spectra are best fit to the isomer with protonation at carbon 5 (ACN) and carbon 2 (DHP), in each case the site with the highest PA, thus forming the isomer with the lowest relative electronic energy.
- 3.To understand the reaction pathways for the observed dissociation products, parts of the electronic ground state PESs of the most stable isomers of protonated ACN and DHP have been calculated for H and H2 loss. For both protonated compounds, the lowest barriers are for loss of H2, with predicted energies 4.279 and 4.150 eV, respectively. After the adjacent aliphatic hydrogens migrate to the bare ejection site stabilizing the remaining fragment, the final products of the H2-loss dissociation reaction are the closed-shell cations 1-hydroacenaphthylene and 1-hydrophenanthrene. In contrast, the lowest calculated energy for single H loss from [ACN+H]+ (from C(sp3) at site 1) is higher by 0.92 eV. No single H loss is predicted from [DHP+H]+. Only H migration (from all three C(sp3) sites) around the carbon framework is found, with barriers ranging from 0.861 to 3.709 eV.
- 4.The calculated IR spectra for the closed-shell protonated ACN and DHP and their partners (with one aliphatic group) revealed that their highest energy CC stretching modes are shifted to higher energies compared to similar modes in open-shell cationic PAHs. These CC stretching modes (in the closed-shell protonated PAHs) coincide with the "Class A" interstellar emission band located near 6.2 μm. Furthermore, the HCH scissors vibrations for the closed-shell cationic PAHs have bands which could contribute to the 7.8 μm ISM emission band profile.
- 5.The present work supports a recently introduced model for H2 formation in the ISM (Vala et al. 2009b). In this model, protonated PAHs (with an odd number of aliphatic carbons) absorb visible or ultraviolet light, internally convert to high-lying vibration levels of the ground electronic state, excite large amplitude aliphatic HC(sp3)H scissors vibrations which lead to the ejection of H2 from a single aliphatic carbon containing two H's. Formation of H2 is also shown here to be possible when the H's are supplied by two sp3 carbons (cf. Figure 4(a)). This model may be applicable to cationic closed-shell systems with an odd number of aliphatic carbons greater than three. Spectroscopic studies of such systems and of larger protonated PAHs are needed to verify if they follow the unique features described in this work.
M.V. and J.S. gratefully acknowledge the support of the Petroleum Research Foundation, administered by the American Chemical Society, for its support of this research. The authors also thank Professor O. Dopfer for providing the protonated acenaphthene spectrum prior to publication. M.V. thanks Professor T. Zwier for sharing information on the proton affinity of 1,2-dihydronaphthalene. The authors also thank the staff of the FOM Institute for Plasma Physics for its efficient operation of the FELIX free electron laser facility.