


ABSTRACT
We present new XMM-Newton measurements of the X-ray luminosities (Lx) and temperatures (Tx) for three clusters of galaxies. Two are low Lx (<3 × 1043 erg s−1) clusters, RXJ0110.3+1938 (z = 0.317) and RXJ1011.0+5339 (z = 0.329). These clusters were selected from the 160 Square Degree Survey, a survey of extended sources serendipitously discovered in pointed ROSAT observations. The third cluster, KDCS 112, was included by chance in one of our pointings, and is an optically selected cluster from the DEEPRANGE survey. It has a similar redshift and X-ray luminosity as the first two. We estimate the optical richness (Λcl) of all three clusters. RXJ1011.0+5339 was missed by DEEPRANGE because it is optically poor. However, KDCS112 was missed in the 160SD even though it is brighter in the X-rays than its neighbor RXJ1011.0+5339, because it fell below the 160SD flux limit. The ROSAT flux of RXJ1011.0+5339 was overestimated due to point-source contamination; it is among the lowest luminosity groups with a known X-ray temperature at moderate redshift. These clusters represent a pilot study to probe the Lx–Tx relation at moderate redshifts and low Lx, a regime where feedback processes may increase the scatter or change the mean Lx–Tx relation. The X-ray luminosities and temperatures of the clusters are consistent with the Lx–Tx relationship in galaxy clusters at low redshift, albeit with large scatter. We place a upper limit on the scatter in the Lx–Tx relation of ∼0.1 in δlog Tx for moderate redshift clusters, similar to that of low-redshift clusters.
Export citation and abstract BibTeX RIS
1. INTRODUCTION
Clusters of galaxies are extended, luminous X-ray sources, made up of hot, intra-cluster gas (ICM) confined in gravitational potential wells (M ∼ 1014–1015 M☉). Cluster X-ray emission is primarily produced by thermal bremsstrahlung and collisionally excited line emission from the ICM. The simplest model for the formation of clusters begins with cold dark matter density perturbations that grow relatively early. Gas accumulates and heats up in these deepening potential wells after recombination. The cluster gas profiles predicted in this model are identical functions of radius scaled by the virial radius, in other words, self-similar (Kaiser 1986, 1991; Evrard & Henry 1991). Kaiser (1986) showed that this simple model predicts that Lx, Tx, and M are related to each other by simple, power-law scaling relationships. The most well-known example is the Lx–Tx relationship, which the self-similar, cold infall model predicts will scale as Lx ∝ MρT1/2 ∝ T2. Observations of galaxy clusters, however, do not match this scaling relationship and show that the Lx–Tx relationship is closer to Lx ∝ T3 instead (see Voit 2005 for a review), which is commonly interpreted as evidence for additional, non-gravitational heating that causes the equilibrium distribution of the gas to be less dense (Voit 2005). As a result, understanding the cause and properties of the Lx–Tx relationship is essential to revealing the most important physical processes taking place in the cluster environment.
The slope and the intrinsic scatter of the Lx–Tx relationship are affected by non-gravitational processes for all clusters. Fabian et al. (1994) first showed that a large amount of the scatter in the Lx–Tx relationship is due to the cluster core (typically r ⪅ 0.15r500).4 If those core regions are excluded from the analysis, the scatter of the Lx–Tx relationship is greatly reduced (Markevitch 1998; Pratt et al. 2009; Ota et al. 2006). Pratt et al. (2009) in a study of 32 representative clusters at z ∼ 0.1 (REXCESS) found that while cool-core systems are over-luminous for their temperature, morphologically disturbed systems tend to be under-luminous when the emission from the core is included.
The X-ray properties of the low-luminosity clusters are expected to be more affected by galaxy feedback than high-luminosity clusters are, because the gravitational potentials of low-luminosity clusters are shallower. A ROSAT-based study of low-redshift groups by Osmond & Ponman (2004) (GEMS) shows flatter surface brightness profiles than those of clusters. The Lx–Tx relation for groups may well have the same slope as for clusters, but it exhibits significant intrinsic scatter (Osmond & Ponman 2004). Sun et al. (2009) show in a Chandra study of 43 groups that the mass–temperature (M–Tx) relation for groups and clusters can be fit with a single power law, but that the gas fraction inside r2500 for groups is lower than that of clusters, and it has a large scatter (a factor of 2 at a given temperature).
The evolution of the Lx–Tx relation, its scatter, and the transition to low-Lx, feedback-dominated modes is determined by the balance between gravitational and non-gravitational processes. The evolution of the Lx–Tx relationship can provide insight about feedback mechanisms that play a critical role in the X-ray appearance, and therefore the X-ray selection, of galaxy clusters. Recent observations, such as those by Jeltema et al. (2009), Jeltema et al. (2006), Pacaud et al. (2007), and Willis et al. (2005) have begun to probe this relatively unexplored parameter space of low-temperature and moderate redshift galaxy clusters/groups. However, observations of these moderate redshift systems are slow in coming due to the long exposure times needed to measure temperatures in these X-ray faint systems.
In this paper, we present XMM-Newton observations of three galaxy clusters at moderate redshift (0.3 < z < 0.4). Two of the clusters are X-ray-selected, from the 160 Square Degree (160SD) ROSAT Survey (Vikhlinin et al. 1998; Mullis et al. 2003), RXJ0110.3+1938 and RXJ1011.0+5339. For brevity, we will refer to these clusters as RXJ0110 and RXJ1011. Both of these clusters have low ROSAT luminosities of 0.38 and 0.24 × 1044 h−270 erg s−1, respectively, from 0.5 to 2.0 keV in the rest frame of the cluster. The third cluster, KDCS112 (10h11m16 86, +53 34'35''), is an optically selected cluster (Postman et al. 2002) that we chanced to observe in the same XMM-Newton field as RXJ1011. This cluster has a spectroscopically determined redshift based on five members, but has no previous X-ray information. Its official XMM-Newton source name is XMMU J101119.6+533436, but we will refer to it as KDCS112. The properties of the clusters are provided in Table 1.
Table 1. Cluster Properties and Observation Data
| Cluster Name | R.A. | Decl. | Redshift | NH | Filtered Exposure (ks) |
|---|---|---|---|---|---|
| (J2000.0) | (J2000.0) | (1022 cm−2) | MOS1, MOS2 | ||
| RX J0110.3+1938 | 01:10:18.0 | +19:38:23 | 0.317 | 0.0382 | 19.3, 18.6 |
| RX J1011.0+5339 | 10:11:05.1 | +53:39:27 | 0.329 | 0.0075 | 26.7, 26.0 |
| KDCS112 | 10:11:16.9 | +53:34:35 | 0.391 | 0.0074 | 26.7, 26.0 |
Notes. The X-ray source XMMU J101119.6+533436 is identified in this paper as the optically selected galaxy cluster KDCS112. The values of redshift were taken from Mullis et al. (2003) and Postman et al. (2002). Column 6 lists the exposure time after periods of high background were removed.
Download table as: ASCIITypeset image
Unless otherwise noted all errors are given at the 68% confidence level. Cosmological constants of H0 = 70 km s−1Mpc−1, ΩM = 0.28, and ΩΛ = 0.72 are assumed throughout the paper. At z = 0.35, this cosmology gives a luminosity distance of 1866.4 Mpc and an angular scale of 4.978 kpc arcsec−1 (Wright 2006).
2. DATA REDUCTION
We observed RX J0110 for ∼33 ks on 2007 July 16, and RX J1011 and KDCS112 were observed for ∼43 ks on 2007 November 2 with XMM-Newton (Jansen et al. 2001). Because both observations were hampered by proton storms, we chose to only analyze the data from the two MOS cameras available on the European Photon Imaging Camera (EPIC; Turner et al. 2001). The pn-CCD camera (Strüder et al. 2001) data are more affected by storms, and were not of use. The event files used for the analysis were those generated by the XMM-Newton Pipeline Processing Subsystem. The data were reduced using standard routines found in the XMM-Newton Scientific Analysis System (XMMSAS) version 8.0.0. For all data, we filtered the MOS event list using standard options: we used only single-pixel events (PATTERN = 0) and the default quality flags (#XMMEA_EM and #XMMEA_EP).
Periods of high background due to solar flares were removed by rejecting time intervals where the MOS count rate was greater than 0.21 counts s−1. With the remaining data, we identified other periods of high background as those that exceeded a 3σ threshold, and removed them. As a result of these timeline cuts, the useful exposure time is 19.3 ks and 18.6 ks for MOS1 and MOS2 observations of RX J0110.0. For RX J1011 and KDCS112, the useful exposure time was 26.7 ks and 26.0 ks for the MOS1 and MOS2 observations. Point sources were flagged and masked after visual inspection of images extracted from the cleaned event files. Figures 1–3 show the X-ray emission contours of the clusters superimposed on optical images. Figure 1 was made using a Hubble Space Telescope Advanced Camera for Surveys F814W image of RX J0110. Figures 2 and 3 were made using the Sloan Digital Sky Survey Data Release 7 (SDSS DR7; Abazajian et al. 2009) r-band images. The contours indicate regions of equal surface brightness as calculated and smoothed by the csmooth program found in the Chandra Interactive Analysis of Observations (CIAO) version 4.0 (Fruscione et al. 2006).
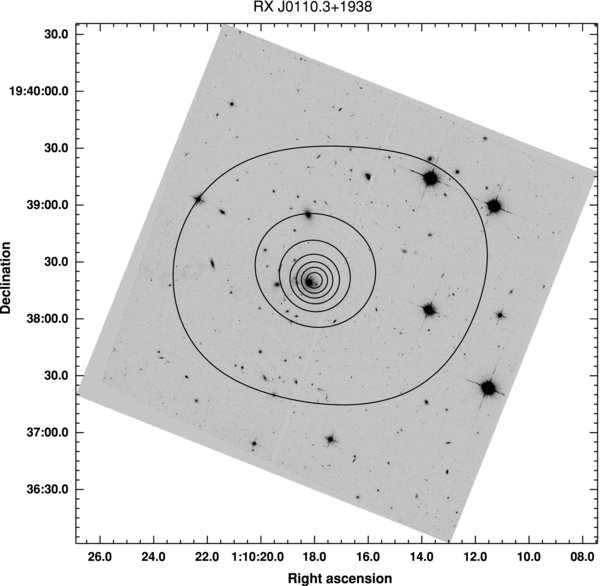
Figure 1. X-ray emission contours overlaid on a Hubble Space Telescope Advanced Camera for Surveys F814W image of RX J0110.3+1938. Point sources have been removed from the X-ray emission map. The emission is smoothed with csmooth with an average smoothing kernel of 12 arcsec. The first contour marks areas of emission with 7.5 × 10⁻⁷counts s−1 arcsec−2, and subsequent contours increase by 5.4 × 10⁻⁷count s−1 arcsec−2.
Download figure:
Standard image High-resolution image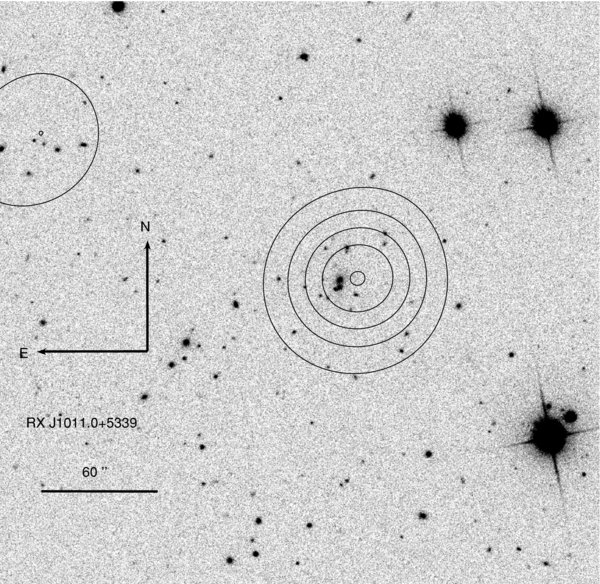
Figure 2. X-ray emission contours overlaid on an SDSS r-band image of RX J1011.0+5339. Point sources have been removed from the X-ray emission map. The emission is smoothed with csmooth with an average smoothing kernel of 20 arcsec. The first contour marks areas of emission with 5.0 × 10⁻⁷ count s−1 arcsec−2, and subsequent contours increase by 0.9 × 10⁻⁷ count s−1 arcsec−2. The object in the upper left hand corner is not associated with any known X-ray source and is detected at a 3.5σ level.
Download figure:
Standard image High-resolution image
Figure 3. X-ray emission contours overlaid on an SDSS r-band image of KDCS112. Point sources have been removed from the X-ray emission map. The emission is smoothed with csmooth with an average smoothing kernel of 17 arcsec. The first contour marks areas of emission with 4.1 × 10⁻⁷ count s−1 arcsec−2, and subsequent contours increase by 5.1 × 10⁻⁷ count s−1 arcsec−2.
Download figure:
Standard image High-resolution image3. X-RAY ANALYSIS
3.1. Image Analysis
The cleaned MOS1 and MOS2 data were exposure-corrected and added together to create a combined image to investigate the X-ray surface brightness profiles of the clusters. The exposure map used was normalized to the maximum exposure value to maintain the number of counts in the final image. A two-dimensional surface profile was fit to the sources using the SHERPA tool found in CIAO. Due to the small number of counts, even after binning the images over 64 pixels (3 2 × 32), the C-statistic (Cash 1979) was used to determine the maximum likelihood statistic for minimization. The fitted model includes a circular beta profile (Cavaliere & Fusco-Femiano 1976) of the form
plus a constant background. This fit function is typical of the X-ray surface brightness profiles of the inner regions of many X-ray clusters. Given the small number of counts, using such a function to estimate aperture corrections is our only option. The β parameter was fixed to 2/3 (Jones & Forman 1984) for all clusters. The best-fit value of rcore for each X-ray source can be found in Table 2.
Table 2. Cluster Properties
| Property | RX J0110.3+1938 | RX J1011.0+5339 | KDCS 112 |
|---|---|---|---|
| Scale (kpc arcsec−1) | 4.647 | 4.765 | 5.328 |
| X-ray aperture radius | 32 | 38 | 64 |
| Net counts (MOS1, MOS2) | 231 ± 43, 205 ± 40 | 71 ± 17, 59 ± 16 | 139 ± 30, 211 ± 30 |
| rcorea | 24+6−5 | 34+9−8 | 29+6−5 |
| Estimated r500b | 92+10−8 | 100+63−20 | 102+43−14 |
| Estimated r500c | 108+11−9 | 115+64−20 | 115+43−15 |
| Temperature (keV) | 1.46+0.26−0.19 | 1.75+1.75−0.55 | 2.29+1.54−0.53 |
| LDetectedd | 2.08+0.22−0.22 | 0.63+0.23−0.24 | 3.11+0.65−0.68 |
| L(r < r500)e (Willis et al.) | 2.52+0.85−0.72 | 0.80+0.77−0.42 | 3.82+2.18−1.19 |
| LExcisedDetected | 0.46+0.08−0.06 | 0.44+0.05−0.08 | 2.64+0.34−0.36 |
| LExcisedr500 | 0.56+0.20−0.16 | 0.56+0.50−0.23 | 2.79+1.79−0.88 |
| L(r < r500)e (Sun et al.) | 2.53+0.85−0.73 | 0.81+0.72−0.42 | 3.31+2.03−1.18 |
| nef (10−3 cm−3) | 2.66+1.21−1.01 | 0.82+0.34−0.30 | 1.80+0.55−0.46 |
| Λcl(Mpc1.77) | 42.9 ± 11.2 | 34.3 ± 12.7 | 89.8 ± 22.0 |
Notes. All radii are given in units of arcseconds and all luminosities are given in units of 1043 erg s−1. aValues are based on a best-fit beta model with fixed β = 2/3. bValues are estimated from the Tx–r500 relationship observed by Willis et al. (2005). cValues are estimated from the Tr500–r500 relationship observed by Sun et al. (2009). dValues are the unabsorbed bolometric luminosities of the best-fit model of the background corrected photons within the X-ray aperture. eValues are the aperture-corrected luminosities within a radius of r500. The uncertainties are estimated by using the error propagation in evaluating the analytical solution to the integrated beta function. The uncertainties used included the uncertainties in temperature, r500, rcore, and detected luminosity. fValues were calculated using the best-fit beta model found in Section 3.1, and the normalization of the best-fit spectral model found in Section 3.2. The uncertainty was estimated by applying standard error propagation rules throughout the calculation, which included uncertainty in rc and the normalization.
Download table as: ASCIITypeset image
3.2. Spectral Analysis
Because the mean surface brightnesses of these sources are low, choosing an aperture that maximized the signal-to-noise ratio of our spectra was essential for the best temperature estimate. To determine the best aperture size for spectral extraction, we first fit a radial profile to the cluster emission. The radius of the aperture was then selected to be the radius at which the background noise began to dominate the total counts. The spectral extraction aperture used for each cluster can be found in Table 2. The spectra were binned such that each bin contained at least 20 total counts (25 in the case of KDCS112) to improve the signal-to-noise ratio in each bin. The average percentage of the total counts that are signal counts after background subtraction is 21.7%, 26.8%, and 27.8% for RX J0110, RX J1011, and KDCS112, respectively. The redistribution response functions and ancillary response functions were generated using the rmfgen and arfgen SAS tasks, respectively. The background was estimated from an annulus of width ∼60'' around the region of interest in all cases. In order to minimize chip-to-chip differences, the background region was chosen to completely lie on the same chip as the cluster was.
For each cluster, the spectra from the MOS1 and MOS2 detector were fit simultaneously to an absorbed APEC emission spectrum model from 0.5–5.0 keV using XSPEC (Arnaud 1996). Since the net number of counts in each cluster was of order 100, the absorbing NH column density was fixed to the galactic level determined by Kalberla et al. (2005) and can be found in Table 1. The metallicity was fixed to 0.3 solar relative to Anders & Grevesse (1989) for all the clusters. The temperature and normalization parameters were allowed to vary and the best-fit model was found. Our results are found in Table 2. The given luminosities are unabsorbed bolometric luminosities (in practice, 0.01–16 keV) of the best-fit model and the errors cited are those given by XSPEC, which includes the uncertainty in the temperature. The luminosity measured from within the region of spectral extraction is labeled as LDetected in Table 2. In order to compare our measured values of luminosity to previous works, we also include an estimated value of the bolometric luminosity within r500, the projected radius at which the interior density is 500 times the critical density (=3H(z)2/8πG). We estimated the size of r500 via its relationship with the spectral temperature given by Willis et al. (2005):

The X-ray luminosity at r500 (LX(r < r500)) was estimated by extrapolating from the luminosity measured within our X-ray aperture using the best-fit radial profile found in the previous section out to r500. Typical aperture correction factors from detected flux to total flux lie between 1.2 and 1.3 for these clusters. Uncertainties in r500, rcore, and the detected luminosity were propagated to derive an uncertainty in LX(r < r500). While we fixed β = 2/3 when fitting the surface brightness profile (Section 3.1), this parameter has been observed to vary in clusters of similar temperature and redshift (Willis et al. 2005; Jeltema et al. 2006). To properly account for this uncertainty, we refit the surface brightness profiles with β = 0.5 and β = 0.75 to determine how much this affects our estimation. This resulted in an uncertainty of ∼10% which has been included in the uncertainties listed in Table 2. However, it should be noted that the uncertainties in the best fit rcore dominate the uncertainty due to the specific choice of β. We also note that both the slope and the normalization of the Willis et al. (2005) relation is different from more recent results obtained with Chandra and XMM-Newton (e.g., Sun et al. 2009). However, this difference changes our estimate of both r500 and L(r < r500) very little. We can compare our estimates against those given by Sun et al. (2009), if we assume that the temperature we measure within our aperture is the same as that at r500. The comparisons can be found in Table 2. As can be seen, both relationships produce statistically indistinguishable results. We will use the Willis et al. (2005) relationship throughout this paper as their measurement procedure most closely matches the procedure used in this paper.
Vikhlinin et al. (1998) give ROSAT fluxes of RX J0110 and RX J1011 of (7.8 ± 1.6) and (4.7 ± 1.2) × 10−14 erg cm−2 s-1, respectively, from 0.5 to 2.0 keV. Converting these fluxes to luminosity at the redshift of the clusters measured by Mullis et al. (2003), the ROSAT measured luminosity is (2.6 ± 0.5) × 1043 erg s−1 and (1.7 ± 0.4) × 1043 erg s−1, respectively. Applying a bolometric correction from the APEC model within XSPEC at the cluster redshift and XMM-Newton temperature gives an estimated bolometric luminosity of (3.71 ± 0.7) and (2.92 ± 0.7) × 1043 erg s−1, respectively. Our measured X-ray luminosity of RX J0110 of (2.52 ± 0.7) × 1043 erg s−1 is consistent with the previous ROSAT measurement. However, our measurement of the X-ray luminosity of RX J1011, at (0.8 ± 0.4) × 1043 erg s−1, is much lower than the previous ROSAT measurement. The ROSAT measurement was likely contaminated by a point source that is ∼1 0 from the center of the cluster emission. The FWHM of the point-spread function (PSF) of the PSPC detector is ∼05 for photons of 1.0 keV when detected on-axis, and ∼10 for photons of 1.0 keV when detected far off axis (Gunther et al. 1993; Hasinger et al. 1992). (In contrast, the XMM-Newton PSF FWHM is 4''–6'', which makes distinguishing between the arcminute-scale extended emission of a cluster from a point source relatively straightforward.) Because the survey of Vikhlinin et al. (1998) was a serendipitous survey, the galaxy cluster was not observed on axis, but instead 84 from the center of the field. The FWHM of the Gaussian fit to the PSF is ∼15'' (Gunther et al. 1993) at this distance from the center of the field. As a result of the overlap, the emission of the two objects overlapped around the 2σ ROSAT surface brightness contour. This overlap may have been enough to contaminate the flux estimation by Vikhlinin et al. (1998). If we include the point source in the flux measurement region, we infer a bolometric luminosity of (2.5 ± 0.4) × 1043 erg s−1 which is consistent with the previously measured value by Vikhlinin et al. (1998). The revised luminosity of RX J1011 makes it one of the lowest luminosity X-ray clusters with a known X-ray temperature at z > 0.3.
The central electron density was estimated by using the spectra normalization parameter in the best-fit model within XSPEC and the emission integral–central density relation for a self-consistent, isothermal gas having a beta-model distribution given by Sarazin (1986):
where n0 is the proton density, rc is the core radius of the beta-model distribution, and
The normalization parameter for the APEC model found in XSPEC is
where DA is the angular diameter distance in units of cm, nx has units of cm−3, and dV has units of cm3. Combining Equations (3) and (5) via Equation (4) allows the calculation of n0 given the best-fit surface brightness model found in Section 3.1 and the normalization of the best-fit spectral model. We assumed that ne/n0 = 1.2. Estimated central electron density for each cluster is provided in Table 2. The uncertainty was estimated by propagating the spectral and spatial fit uncertainties throughout the calculation, including the uncertainties in the normalization parameter and rc. This central electron density estimate assumes spherical symmetry, but past studies have shown that assuming more general ellipsoidal gas distributions would not affect our estimate or our error budget, which is dominated by statistical noise (e.g., Donahue 1996).
3.3. Sample Selection and Optical Richness Estimate
Both RX J1011.0+5339 and KDCS112 (XMMU J101119.6 +533436) are nearly identical in their X-ray properties and are separated by ∼6', yet each one was missed in the survey that discovered the other. In this section, we solve this mystery. We note that the ability to deal with point-source contamination is essential for accurate luminosities of clusters, particularly faint clusters, and therefore spatial resolution is essential for faint-cluster counts and luminosity functions.
KDCS112 was not detected in the 160 Square Degree Survey (Vikhlinin et al. 1998), an X-ray-selected sample. In this survey, the useful exposure length of the observation and the location of the cluster in the focal plane determine how luminous an object would have to be detected. The ROSAT exposure (RP700264N00) that included RX J1011.0 and KDCS112 was 14.8 ks in length. For an exposure of this length, the limiting flux of the 160SD Survey was ≈1.5 × 10⁻¹³ erg cm−2 s−1 in the 0.5–2.0 keV energy band (Vikhlinin et al. 1998). We measured the flux of KDCS112 to be 6.80(±1.63) × 10−14 erg cm−2 s−1 in the same energy band, which is below the detection threshold. KDCS112 was previously identified in the WARPS Survey (as WARPS J1011.3+5333) by Horner et al. (2008) who noted its proximity to a point source. It was not included in the WARPS cluster catalog because after correction for the point source, the estimated flux of the cluster was fainter than the flux limit of the survey (6.5 × 10⁻¹⁴ erg cm−2 s−1). Our measurement of the flux of the cluster is consistent with the point-source-corrected flux estimate made by Horner et al. (2008). Ironically, RX J1011.0 has an even lower X-ray luminosity than KDCS112. As discussed in Section 3.1, the ROSAT luminosity of this source was overestimated because of an unresolved point source. With XMM-Newton's spatial resolution we were able to exclude this contaminating source from the Lx estimate.
RX J1011 was not detected in the KPNO/DEEPRANGE Distant Cluster Survey (Postman et al. 2002), an optically selected sample that used the matched filter technique to locate clusters. This technique looks for locations in a galaxy catalog that best matches the pre-defined filter. This filter includes such properties as cluster core radius, the characteristic galaxy magnitude, and the cluster luminosity function. If a location maximizes the likelihood function of matching the filter in two different filters (V and I in the case of Postman et al. 2002), then the routine says that there is a galaxy cluster at that location.
The first method we used to determine if the cluster should have been detected in the survey exploits the X-ray luminosity–optical luminosity relationship observed by Donahue et al. (2001). Correcting for the cosmology used in that paper, it was observed that
where Lx = L44 × 1044 ergs−1 and Λcl is the total optical luminosity of the cluster divided by L⋆, the location of the knee of the luminosity function (Schechter 1976). Accounting for the large intrinsic scatter in the relationship, an estimate of Λcl = 40(±20) is reasonable based on the projected r500 luminosity of 0.80+0.77−0.42 × 1043 erg s−1. At the redshift of this cluster, if the true value of Λcl is at the lower end of the uncertainty, then the survey only claims to be approximately 60% complete. As a result, it is not surprising that the survey failed to find the cluster.
To estimate Λcl directly, we used data from the SDSS Data Release 7 (Abazajian et al. 2009). We selected objects within a projected radius of 0.5 Mpc from the coordinates of the X-ray emission centroids. To ensure that we were looking at cluster members, extremely bright stars were removed as well as all objects that were more than 0.4 mag in g' − r' color away from the observed red sequence of each cluster. Because LCluster = ΛclL⋆ (Donahue et al. 2001), we can obtain an estimate of Λcl by summing the total luminosity of cluster members and dividing by L⋆, the knee in the commonly used Schechter luminosity function (Schechter 1976). Hansen et al. (2005) analyzed the composite luminosity function of galaxy clusters in the redshift range of our clusters and found that for clusters with the same number of galaxies as our clusters, M⋆ = −20.7 ± 0.04. Converting M⋆ to L⋆ at the redshift of each cluster allows us to estimate Λcl. For KDCS112, we find 90 ± 22, while RXJ1011 and RXJ0110 are poorer optically, at 34 ± 13 and 43 ± 11, respectively (Table 2). Our measurement of KDCS112 is consistent with the previous measurement by Postman et al. (2002), where they found Λcl = 79.2. Our direct measurement of Λcl in RX J1011 is consistent with our estimate via the X-ray luminosity, supporting the idea that RXJ1011 is indeed optically too poor to have been detected in the KPNO/DEEPRANGE Distant Cluster Survey.
In some sense, RXJ1011 should no longer be considered a proper member of the 160SD sample, because its inclusion was an accident of its proximity to an X-ray point source. On the other hand, it represents one of the poorest and lowest Lx clusters with a known Tx at moderate redshift, and therefore is a cluster of interest to us.
To be sure, the scatter in the relationship between Λcl and LX is enormous (Donahue et al. 2001). Subsequent studies show similar results. For example, Bahcall et al. (2003) found eight clusters with X-ray measurements from the NORAS X-ray cluster catalog (Böhringer et al. 2000) in the early Sloan commissioning data. Six of those clusters have Λcl similar to the clusters in our sample (42–50), but the X-ray luminosities were significantly higher than our sample (Lx ∼ 0.83–8.65 × h−21044 erg s−1). Lopes et al. (2006) compare X-ray galaxy clusters from a heterogeneous list (BAX) to an optical galaxy cluster catalog extracted from analysis of the Digitized Palomar Sky Survey. In comparison to this sample, the three clusters have typical X-ray and optical properties. The Tx-richness comparison suggests that the three clusters in our study are all a little cool (low Tx) compared to their optical richness. However, this feature could be a selection bias, in that very few of the BAX clusters in this study have Tx < 2 keV in any case.
4. DISCUSSION
We will now place these three cluster observations into some context, with comparisons with recent measurements from Chandra and XMM-Newton. Only a handful of z > 0.3 clusters with these low luminosities have known X-ray temperatures. As we discussed above, even the measurement of a ROSAT X-ray flux does not ensure a robust X-ray cluster flux, since even low-level point-source contamination or poor deblending at the sub-arcminute resolution of ROSAT imaging data can affect the flux estimate of these faint, extended sources. While the addition of three low-luminosity X-ray clusters at z ∼ 0.35 does not answer the questions we would like to answer about the scatter and evolution of the Lx–Tx relation, we can answer a more limited set of questions, and we consider what might be needed (more clusters, better observations, or a combination of the two) to make progress on the larger questions.
4.1. How Do the X-ray Properties of These Clusters Compare to Other Clusters of Galaxies?
We see very little difference between the X-ray properties of these clusters and clusters at low redshift. In Figure 4, we compare the L and T measurements for these clusters to the GEMS low-redshift group sample (Osmond & Ponman 2004), the ASCA/ROSAT low-redshift cluster sample of Markevitch (1998), the low-redshift (z < 0.3) clusters from the XMM-Newton Large Scale Structure (XMM-LSS) Survey (Pacaud et al. 2007), and the REXCESS sample (Pratt et al. 2009). In Figure 5, we show only groups and clusters with z > 0.3 from the intermediate-redshift groups of Jeltema et al. (2006), the AEGIS catalog (Jeltema et al. 2009) and the XMM-LSS Survey (Pacaud et al. 2007; Willis et al. 2005). The luminosities of all of the plotted clusters are bolometric and extrapolated to r500, which allows for direct comparison to the clusters presented in this paper. In both of these figures, a scale factor of E(z)−1, based on the assumption of self-similarity, has been applied to the luminosities of the clusters, a customary choice of past workers. (E(z) = H(z)/H0 = (ΩΛ + ΩM(1 + z)3)0.5). The scaled luminosities and temperatures of the three clusters reported here are consistent with those at lower redshift and with those at similar redshift.

Figure 4. Comparison of the scaled Lx–Tx measurements of the three XMM-Newton clusters from this paper with those of low-redshift clusters that shows that these data are consistent with no evolution beyond that expected from self-similar evolution. (The conclusion does not change if the scaling is removed.) The three clusters in this paper (red filled dots) are plotted over the Lx–Tx relationship for the GEMS sample (Osmond & Ponman 2004) (green open diamonds), the Markevitch sample (Markevitch 1998) (green stars), the Pacaud groups (Pacaud et al. 2007) with z < 0.3 (dark blue triangles), the REXCESS sample (Pratt et al. 2009) (gray dots). The aperture-corrected luminosities of the clusters presented in this paper are used. Overplotted is the best-fit Lx–Tx relationship that most closely matches our measurements (the L1–T1 fit of Pratt et al. 2009) of the REXCESS sample.
Download figure:
Standard image High-resolution image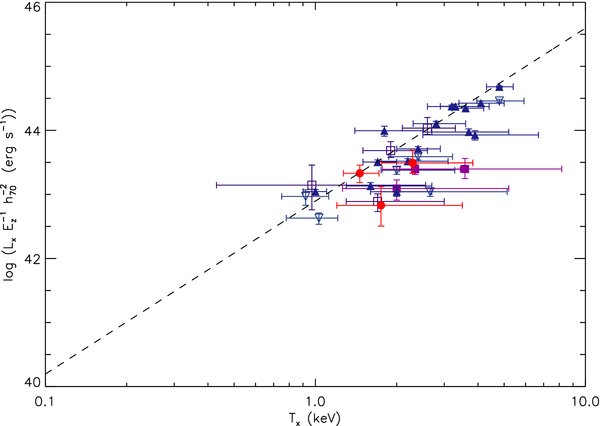
Figure 5. Lx–Tx relationship for galaxy cluster/groups at z > 0.3 from the Jeltema groups (Jeltema et al. 2006) (dark purple open boxes), the AEGIS catalog (Jeltema et al. 2009) purple solid boxes, the XMM-LSS Survey (Pacaud et al. 2007) (dark blue triangles), the initial group/cluster sample in XMM-LSS (Willis et al. 2005) (blue inverted triangles), and the clusters presented in this paper (red dots). The aperture-corrected luminosities of the clusters presented in this paper are used. Overplotted is the best-fit Lx–Tx relationship that most closely matches our measurements (the L1–T1 fit of Pratt et al. 2009) of the REXCESS sample.
Download figure:
Standard image High-resolution image
The Lx–Tx relation may evolve with redshift, although exactly whether and how it evolves are yet matters of debate. Using observations of 10 galaxy clusters with 0.4 < z < 0.7 by XMM-Newton, Kotov & Vikhlinin (2005) observed that L ∝ (1 + z)1.8±0.3 for a fixed temperature. This trend has been supported with other observations as well, such as by Jia et al. (2008), Lumb et al. (2004), and Vikhlinin et al. (2002). However, the WARPS sample observed by Maughan et al. (2006) shows evolution of L ∝ (1 + z)0.8±0.4 in their 11 galaxy clusters with 0.6 < z < 1.0. Evolution similar to Maughan et al. (2006) was also seen by Ettori et al. (2004) in a study of 28 galaxy clusters ranging from 0.4 < z < 1.3.
While measuring an Lx–Tx relation does not require a complete sample, it is best done with a representative sample, particularly given the high scatter seen in the low-redshift relation. At high redshift, the highest-luminosity representatives for clusters of a given temperature may be the only ones to make it into the sample. This Malmquist bias can be accounted for, but the scatter and the selection function must be well defined. Selection biases can induce effects that look like evolution in the direction that has been claimed, and therefore claims of Lx–Tx evolution need to be examined in the context of how the basis sample was assembled. Pacaud et al. (2007) notes that while these previous studies claimed relations fit well over the redshift range over which they are derived, they are not consistent with other observations over the full redshift range. They then suggest that the apparent evolution in the Lx–Tx relationships reported in these works is mostly due to selection bias. In their own survey of 29 clusters out to z = 1.05, they show that when selection bias is taken into account, the evidence for evolution is minimal. They find that the evolution they measure in their sample favors self-similar evolution only, and note that no evolution at all is still marginally consistent with their data.
As we have shown, the Lx–Tx data for all three clusters presented in this paper are consistent with the z ≈ 0 Lx–Tx data as well as with the z ≈ 0.3 galaxy groups observed by Jeltema et al. (2009), Jeltema et al. (2006), Pacaud et al. (2007), and Willis et al. (2005). We note that these clusters have very similar temperatures but exhibit a factor of ∼5 in the luminosity range. Local galaxy groups observed by Osmond & Ponman (2004) showed larger intrinsic scatter, especially toward the less luminous/higher temperature side of the Lx–Tx relationship. We see no evidence for strong evolution perpendicular to the z ≈ 0.0 Lx–Tx relation in these higher redshift, z ≈ 0.3 clusters. As noted above, the X-ray properties of the optically selected cluster KDCS112 turn out to be consistent with those of the X-ray-selected clusters.
4.2. Does the Lx–Tx Relation at Moderate Redshift Have Intrinsic Scatter?
The scatter of the Lx–Tx relationship may change with redshift. Comparing high- and low-luminosity galaxy clusters at low redshift (Markevitch 1998; Osmond & Ponman 2004, for example) there is a significant difference in the inherent scatter of the points about the best-fit relationships of clusters compared to groups. This increase in intrinsic scatter of groups may be due to the larger relative effect of feedback process on group gas properties. The intrinsic scatter may vary as a function of mass of the system, although quantifying this is difficult with standard statistical analysis packages.
Stanek et al. (2006) fit the Lx–Tx data of Reiprich & Böhringer (2002) and obtained σln T|Lx = 0.25. In log10 space this translates to σlog T ∼ 0.25log e = 0.11. We explore here whether the current state of the data for moderate redshift clusters is sufficient to show evidence for intrinsic scatter of this order.
We fit these points using the WLS_REGRESS program (Akritas & Bershady 1996), which allows the estimate of a intrinsic scatter, from a data set with a varying level of measurement errors, with a measurement error in the independent variable (luminosity) that is much less than that of the dependent variable (temperature). Using the same z > 0.3 galaxy clusters as in Section 4.1 (Figure 5), we found the best fit of log10Tx = A + Blog10Lx (Tx is in keV and Lx in erg s−1.) We obtain best-fit parameters of A = −12.2 ± 2.9 and B = 0.289 ± 0.065, errors estimated from 10,000 bootstrap simulations. This analysis indicates very little evidence for intrinsic scatter (consistent with none), beyond what is expected from the stated measurement errors, which are considerable.
More typically, the Lx–Tx relation is described as L ∝ Tα (α = 1/B, for the fitting function defined in the previous paragraph). We found somewhat higher values for α (∼2.8–4.4) than are typically estimated for low-redshift samples. Pratt et al. (2009) find a BCES (L|T) slope of 2.70 ± 0.23 for 31 z = 0.05–0.15 clusters in the REXCESS sample, consistent with previous determinations (see reference in Pratt et al. 2009). For direct comparison, we perform a similar BCES fit which weights errors in both parameters, using the BCES_REGRESS routine (Akritas & Bershady 1996). We obtain a similar fit to the weighted LS (WLS) result, with BCES(L|T) of 3.8 ± 0.5, and an even steeper orthogonal fit of 4.5 ± 0.9. Ordinary LS (OLS) fits which weight all points equally find a range of acceptable slopes: OLS(L|T) slope is 2.4 ± 0.3 and OLS(T|L) is 3.7 ± 0.5 while the bisector approach splits the difference, 2.9 ± 0.3. The larger measurement errors and any preference toward higher luminosity at the higher redshifts of this heterogeneous sample would tend to steepen the fit of the raw relation. Either way, the slopes we obtain here do not differ much from other cluster Lx–Tx determinations, and we see no strong evidence for dispersion beyond the measurement error.
To investigate how much the measurement uncertainties limit our sensitivity to an intrinsic dispersion, we created 24 mock catalogs of cluster luminosity and temperature, based on the luminosities and temperature measurement errors for 29 out of the 32 clusters (including the three reported here) with z ∼ 0.3 and error in log T < 0.5. The clusters that were excluded from the analysis due to large uncertainty in the temperature were RX J1648 (Jeltema et al. 2006), CXOU J1422, and CXOU J1423 (Jeltema et al. 2009). Each catalog was generated using temperature errors drawn randomly from the actual temperature errors and luminosities smoothly sampled from 1043–3 × 1045 erg s−1. Temperature points were generated using the exact temperature based on the fit above. We then added two random Gaussian errors, the measurement error (scaled by either 1.0 or 0.5 to investigate the effect of smaller measurement errors), and an intrinsic scatter of δlog T(keV) of 0, 0.05, 0.1, and 0.25. We generated cluster catalogs of three different sizes for each combination of intrinsic and experimental errors. We then used WLS_REGRESS from Akritas & Bershady (1996) to estimate the slope, intercept, and intrinsic dispersion for each catalog, and compare that result to the known slope, intercept, and dispersion used to generate the catalog. Estimates of the scatter, slope, and intercept with δlog T = 0.25 can be found in Table 3.
Table 3. Fit Properties
| N | Error Factor | S | B | A |
|---|---|---|---|---|
| 1000 | 1 | 0.250 ± 0.008 | 0.283 ± 0.010 | −12.0 ± 0.43 |
| 1000 | 0.5 | 0.242 ± 0.006 | 0.294 ± 0.008 | −12.4 ± 0.37 |
| 300 | 1 | 0.258 ± 0.016 | 0.267 ± 0.018 | −11.2 ± 0.78 |
| 300 | 0.5 | 0.259 ± 0.011 | 0.277 ± 0.017 | −11.2 ± 0.74 |
| 100 | 1 | 0.247 ± 0.022 | 0.308 ± 0.030 | −13.2 ± 1.3 |
| 100 | 0.5 | 0.225 ± 0.018 | 0.279 ± 0.027 | −11.8 ± 1.2 |
| 50 | 1 | 0.237 ± 0.030 | 0.304 ± 0.041 | −12.8 ± 1.8 |
| 50 | 0.5 | 0.214 ± 0.032 | 0.301 ± 0.041 | −12.7 ± 1.8 |
Notes. Estimates of intrinsic scatter (S), slope (B), and intercept (A) from a bootstrapped sample with S = 0.25, B = 0.289, and A = −12.2. Column 2 lists the factor by which the catalog uncertainty was multiplied in order to see the effects of improved measurements on the parameter estimation.
Download table as: ASCIITypeset image
For catalogs with 50 clusters, we found that the slope B(=1/α) was estimated to within 20%–30% and the intercept A was estimated ±1 (log keV): the mean properties are not very well estimated even with 50 clusters. This situation was improved by halving the experimental error (in log T): under those circumstances B is estimated within 10–15%, and A to ±0.5 (log keV). Interestingly, if one simply doubled the sample to N = 100, but obtained measurements of a similar quality, the situation is not much improved over that of an N = 50 cluster sample. In contrast, the result for intrinsic dispersion was more encouraging, although partly a consequence of the ideal Gaussian nature of the simulated errors and scatter in the catalog. Fits to a small sample of 50 predicted an intrinsic dispersion of δlog10T < 0.1 for catalogs with no intrinsic dispersion, even with a random sampling of the measurement errors in the current sample. If the intrinsic simulated scatter were 0.05 or 0.10 in δlog10T, the resulting fits identified similar dispersions, the estimates of which improved to within 40% of the true dispersion when the experimental error was halved.
If we took the results of this mock catalog exercise at face value, we might suggest that the dispersion in the Lx–Tx relation for these moderate redshift clusters is similar to the dispersion seen in HIFLUGCS clusters, and possibly even less. In reality, estimates of the magnitude of the scatter depend on the accuracy and nature of the temperature uncertainties. An inspection of temperature estimates would show that temperatures are not symmetric, particularly large uncertainties (although this effect is not so bad in log space). Therefore, lower quality X-ray temperature probability distributions are only approximately Gaussian. We conservatively assigned the larger (positive) error bar in our fits, but an overestimate of the measurement error leads to an underestimate of the intrinsic scatter. A simple experiment of running WLS_REGRESS and assigning 1/2 the measurement error to each point resulted in an intrinsic scatter estimate in δlog T ∼ 0.05 ± 0.02, beyond the measurement error.
Nevertheless, we conclude that improvement over the current state of Lx–Tx characterization is possible, if some of the larger measurement uncertainties of existing temperature estimates were reduced, and analyzed with compensation for possible Malmquist bias of flux-limited samples. Large numbers of clusters from one or more well-understood cluster samples are optimal, but temperature uncertainties that are somewhat smaller than the intrinsic dispersion would improve the reliability of the mean parameter estimates as well as that of any intrinsic dispersion. Future wide field surveys such as eROSITA (Predehl et al. 2007) and the Wide Field X-ray Telescope (Murray & WFXT Team 2010) of sufficient sensitivity to make accurate temperature measurements and sufficient sky coverage to include a large number of clusters with a wide range of luminosities are required. We note that more sophisticated Monte Carlo techniques will be required to test models that predict a variation of scatter with the relation. Standard statistical fitting routines usually assume the intrinsic scatter is not a function of the dependent variable.
5. CONCLUSION
We have presented new XMM-Newton observations of three intermediate redshift, low-luminosity X-ray clusters of galaxies. Two of these clusters were known X-ray emitters, selected from the ROSAT 160 Square Degree Survey in order to measure their X-ray properties: RX J0110.3+1938 and RX J1011.0+5339, with z = 0.317 and 0.329, respectively. The third is a serendipitous detection of X-ray emission (XMMU J101119.6+533436) from a known optical cluster, KDCS112, from the DEEPRANGE survey. It lies in the same observation and at slightly higher redshift (z = 0.391) as RX J1011.0+5339. This cluster turns out to have similar properties as the X-ray-selected clusters, which was surprising since this cluster was not detected in the 160SD Survey, and RXJ1011 was not detected in the DEEPRANGE survey.
We provide an explanation, with 20/20 hindsight, of why KDCS112 and RX J1011.0 were not identified in the 160 Square Degree and the KPNO/DEEPRANGE surveys, respectively. For both clusters in the 160SD Survey, marginal spatial resolution of X-ray observations with ROSAT prevented galaxy clusters from being correctly identified or measured in the observations. The plausible confusion of RX J1011.0 with a nearby point source and the (proper) exclusion of KDCS112 from the WARPS survey demonstrate the importance of spatial resolution in X-ray observations for both detection of cluster and the correct calculation of cluster properties and cluster numbers. We established that RX J1011.0+5339, the X-ray cluster not found in the KPNO/DEEPRANGE survey, has moderately low optical richness, where the KPNO/DEEPRANGE survey is only partially complete. This cluster, after correction for the point source, turns out to be the one of the lowest luminosity, z > 0.3, X-ray clusters with a measured X-ray temperature.
The X-ray (Lx, Tx) and optical (Λcl) properties of these clusters are consistentwith X-ray luminosity and temperatures clusters of similar X-ray luminosity, X-ray temperature, and optical richness, regardless of redshift. However, the observed scatter in these relations, and indeed even in this small sample, is significant. The two X-ray clusters have very similar properties, especially if the core luminosity is ignored. It is possible that RXJ0110.3+1938 is a cool-core cluster based on its peaked luminosity profile and slightly compact core (∼100 kpc), but our X-ray data are insufficient to determine this. The optically selected cluster, XMMU J101119.6+533436, is the hottest, most X-ray luminous, and richest one of the three.
While measurement error dominates the observed scatter in the Lx–Tx relation, an investigation of the intrinsic scatter of moderate redshift groups and clusters shows that the intrinsic scatter is ≲0.1 in log Tx, assuming Gaussian measurement uncertainties. Future studies should aim not only to increase the number of clusters with Lx and Tx measurements, but ensure that the estimates have sufficient counts to measure a temperature to 10% accuracy or better to constrain scatter along the relation.
We thank Marc Postman for review and comments on drafts of this paper. S.B. and M.D. acknowledge the support of an XMM GO grant NASA NNX-07AQ65G. M.D. and G.M.V. received significant support from a NASA Long Term Space Astrophysics grant (NNG-05GD82G). The present work is based on observations obtained with XMM-Newton, an ESA science mission with instruments and contributions directly funded by ESA Member States and the USA (NASA).
Footnotes
- 4
By convention, radii in clusters are scaled to the overdensity enclosed. R500 is the radius of a region with an average density 500 times that of the critical density, 8πG/3H20. The virial radius in simulations is ∼r200, while faint X-ray clusters are rarely detected by Chandra or XMM-Newton beyond r2500.