


ABSTRACT
We present 24 μm and 70 μm images of a non-radiative shock in the Cygnus Loop supernova remnant, obtained with the Multiband Imaging Photometer for Spitzer on board the Spitzer Space Telescope. The post-shock region is resolved in these images. The ratio of the 70 μm to the 24 μm flux rises from about 14 at a distance 0 1 behind the shock front to about 22 in a zone 075 further downstream, as grains are destroyed in the hot plasma. Models of dust emission and destruction using post-shock electron temperatures between 0.15 keV and 0.30 keV and post-shock densities, nH∼ 2.0 cm−3, predict flux ratios that match the observations. Non-thermal sputtering (i.e., sputtering due to bulk motion of the grains relative to the gas) contributes significantly to the dust destruction under these shock conditions. From the model calculations, we infer that about 35% by mass of the grains are destroyed over a 0.14 pc region behind the shock front.
Export citation and abstract BibTeX RIS
1. INTRODUCTION
Dust grains overrun by supernova remnant (SNR) shocks are collisionally heated and may eventually be destroyed. The main destruction mechanism in non-radiative shocks (i.e., where the post-shock gas has not had time to cool, and the shock dynamics are not affected by radiative losses) is the sputtering of grains (e.g., Jones et al. 1994). The heated dust emits strongly at infrared wavelengths. Therefore, infrared observations of SNR shocks provide a means to study the swept-up dust properties and the dust destruction process.
The earliest systematic infrared observations of SNRs were obtained as part of the Infrared Astronomical Satellite (IRAS) all sky survey (Arendt 1989; Saken et al. 1992). These studies showed that remnants are detectable in the infrared, and that the infrared and X-ray morphologies are similar. They also established that the major contribution to the infrared flux was thermal emission from dust. The IRAS observations motivated theoretical work on dust processing in hot plasmas and its effects on the emission (Dwek & Arendt 1992; Vancura et al. 1994; Dwek et al. 1996). Although much was learnt about the nature of dust emission in SNRs, the low angular resolution of the IRAS instruments did not allow individual shocked regions to be resolved even in the nearest remnants. Thus, in the remnants with non-radiative and radiative shocks existing close to each other, the thermal emission from dust could not be separated from line emission arising in the gas. (Subsequent observations by the Infrared Space Observatory showed that indeed there are several strong emission lines detected in the infrared spectra of radiative shocks; e.g., Oliva et al. 1999; Reach & Rho 2000.) Thus, despite the extensive data and theoretical modeling, our understanding of dust destruction remained quite incomplete.
More recently, the Spitzer Space Telescope (Spitzer) has been used to observe many SNRs in the Galaxy and in the Magellanic Clouds. In the case of four prominent Type Ia remnants in the Large Magellanic Cloud (LMC; Borkowski et al. 2006), and Kepler's SNR in our Galaxy (Blair et al. 2007), images obtained through the 24 μm and 70 μm bands with the Multiband Imaging Photometer for Spitzer (MIPS) have allowed us to reliably measure the fluxes from the dust associated with fast non-radiative shocks. These measurements provide stringent tests of the models, and have consequently led to a clearer understanding of the dust destruction process and a more accurate estimate of the amount of dust destroyed than had been possible with pre-Spitzer data.
In this paper, we study the dust destruction in a non-radiative shock in the Cygnus Loop SNR using MIPS 24 μm and 70 μm images. The shock has a velocity of about 350 km s−1 (Ghavamian et al. 2001; Raymond et al. 2003); it is significantly slower than the non-radiative shocks in the LMC Balmer remnants and in Kepler, most of which are 1000 km s−1 or more. Thus, we are exploring dust destruction at lower plasma temperatures than has been done in the earlier studies mentioned above. Furthermore, the Cygnus Loop at a distance of 540+100−80 pc (Blair et al. 2005) is close enough that the post-shock emitting region is resolved in the MIPS images. This permits a more detailed study of grain destruction than would be possible with unresolved infrared emission.
2. PREVIOUS OBSERVATIONS OF THE NON-RADIATIVE FILAMENT
The filament observed by Spitzer was chosen from the non-radiative filaments that define the northern edge of the Cygnus Loop because of the extensive existing observations at other wavelengths. Ghavamian et al. (2001) obtained Hα and Hβ profiles. The two-component profile of Hα showed a broad component width of 262 ± 32 km s−1 (FWHM) and an intensity ratio of broad-to-narrow components of 0.59 ± 0.3. Model calculations then indicated a shock speed of 300–365 km s−1 and nearly equal ion and electron temperatures (Te/Tp = 0.7–1.0). However, models by van Adelsberg et al. (2008) that match the Hα profiles of many faster shocks are not able to simultaneously match the width and the broad-to-narrow component intensity ratio of this filament.
Ultraviolet observations made with the Hopkins Ultraviolet Telescope (Davidsen 1992) and Far Ultraviolet Spectroscopic Explorer (FUSE; Moos et al. 2000) were presented in Raymond et al. (2003). The UV line intensity ratios helped confirm the post-shock electron temperature, and analysis of the O vi doublet led to an estimate of the pre-shock density of 0.2–0.5 cm−3 and a depth of the emitting region along the line of sight of 0.7–1.5 pc. In addition, the widths of the O vi lines indicated that the kinetic temperatures of oxygen and hydrogen are nearly equal (TO < 2.9 Tp). Raymond et al. (2003) also examined ROSAT spectra from the region just behind the shock. They found that a bright rim about 1'–2' thick could be best interpreted as a region of strong 1/4 keV emission resulting from the underionization of the most recently shocked gas, and that the post-shock electron temperature was in the range 0.14–0.20 keV.
Spectral analyses have been performed on X-ray data from a number of satellites for the northeast part of the Cygnus Loop. A general finding is that single-temperature models and models based on time-dependent ionization behind a single shock do not provide adequate fits to Chandra, XMM-Newton, or Suzaku data (e.g., Katsuda et al. 2008; Tsunemi et al. 2007; Miyata et al. 2007). They also tend to find depleted elemental abundances, even for elements such as oxygen that should not be depleted onto grains (Miyata et al. 2007) and evidence for resonance line scattering (Miyata et al. 2008).
The proper motions of a number of non-radiative filaments in the Cygnus Loop were measured by Salvesen et al. (2009). Two of those filaments, numbers 5 and 6, lay on either side of the position observed by Ghavamian et al. (2001). (These are just outside the box in Figure 1.) Their proper motions of 3 4 and 41 ± 02 in 39.1 yr translate into shock speeds of 278 and 333 km s−1 at the upper limit distance of 640 pc to the Cygnus Loop (Blair et al. 2005, 2009). These proper motion measurements imply shock speeds of 235 and 281 km s−1 at the nominal distance of 540 pc to the Cygnus Loop, which are somewhat lower than the shock speeds 300–365 km s−1 derived by Ghavamian et al. (2001) and ∼350 km s−1 implied by the temperatures derived from X-ray observations.
3. OBSERVATIONS
Spitzer observations of the non-radiative shock on the northeast limb of the Cygnus Loop were obtained in 2005 December as part of Cycle 2 Guest Observer program 20743. The target field was centered on αJ2000 = 20h54m35s, δJ2000 = +32°17'30''. The 24 μm observations included 12 frames and totaled 375 s. The field of view (FOV) of the shocked region is about 57 × 57. The 70 μm images consisted of a 3 × 3 raster obtained in the narrow FOV mode. For each position, 40 frames were obtained with a total exposure time of about 340 s. The overall FOV of the 70 μm image is about 8' × 13', and completely overlaps the 24 μm image FOV.
The Spitzer Science Center archive provides "Basic Calibrated Data" (BCD) images, one for each individual "data collection event," and pipeline-processed "post-BCD" products, wherein all BCD images for a given observation are combined. The BCD images are scientifically reliable, while post-BCD images need to be examined carefully before they can be subjected to scientific analysis. Fortunately, for our observations, the post-BCD products are usable. The 24 μm image is of excellent quality. The 70 μm image is of very good quality, although it shows distinct striping. We attempted to remove the striping by re-processing the data through Germanium Reprocessing Tools (GeRT6) but were unable to make any improvement in the final image. In consultation with the Spitzer MIPS team experts at the Spitzer Science Center, we decided to use the post-BCD products for both 24 μm and 70 μm data. The error in the measured flux introduced by the striping is estimated in Section 4.
4. RESULTS
A three-color image of the non-radiative shock is shown in Figure 1. Red is an Hα image obtained at the Mt. Hopkins Whipple Observatory 1.2 m telescope, green is the Spitzer 24 μm image, and blue is an exposure-corrected 0.35–2.0 keV Chandra image made from the ACIS-S3 data (ObsID 2821) using CIAO 3.4. The Hα emission traces a narrow zone (∼1014 cm thickness) just behind the shock front. The infrared emission arises in a more extended zone behind the shock front. The X-ray emission comes from the entire post-shock region where the gas initially is heated to a temperature of a few times 106 K. As the gas ionizes, the X-ray emission is dominated by different species: Si and Fe make the major contribution just behind the shock, and O and Ne further downstream. A fainter shock is clearly seen ahead of the main shock, near the left edge of the 24 μm image FOV. The three images are shown separately along the bottom of the figure.
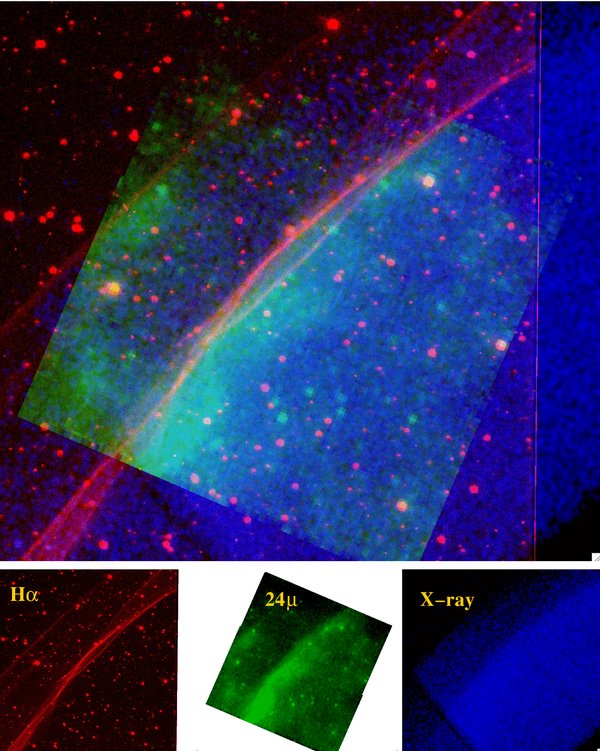
Figure 1. Three-color image of the non-radiative shock in the northeast limb of the Cygnus Loop, with the individual images shown at the bottom. North is up and east is to the left. The Spitzer 24 μm image has a 57 × 57 FOV.
Download figure:
Standard image High-resolution imageThe Spitzer 24 μm and 70 μm images are shown in Figure 2. Fluxes were measured along each of the three strips shown in these images. The strips were chosen to be perpendicular to the shock front as seen in the 24 μm image. Each strip is about 60'' across and each box is 2033 wide. This corresponds to 22 pixels and 8 pixels, respectively, in the 24 μm image and about 14 pixels and 5 pixels in the 70 μm image.
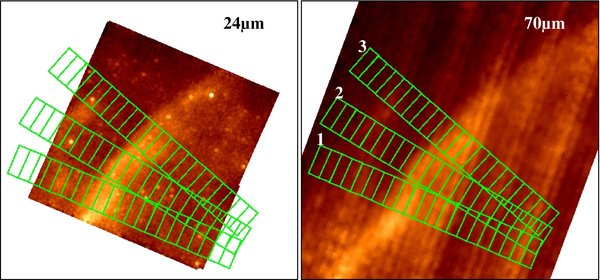
Figure 2. Spitzer MIPS images of the non-radiative shock; left: 24 μm, right: 70 μm. North is up and east is to the left. The strips along which flux profiles were obtained are overlaid on the images. The strips are about 60'' across and each box is 2033 wide.
Download figure:
Standard image High-resolution imageThe total fluxes within each box were calculated for the MIPS images by summing the data values (in MJy sr−1) for pixels contained in the box multiplied by the solid angle subtended. These were used to construct flux profiles along each strip. The background in the 24 μm image is about 3 mJy pixel−1, and fairly uniform over most of the detector. We subtract this value off each pixel to obtain background-subtracted profiles. The uncertainty in the background value is ∼0.003 mJy pixel−1 or ∼0.53 mJy in each box. This uncertainty translates to about 5% error in the flux measurement near the peak of the 24 μm emission. The exception to the near-uniform background is in the region around the northern corner of the FOV, where the background is lower and more variable. There is no such difference associated with that part of the sky in the 70 μm image. This suggests that the anomaly is due to the 24 μm detector and does not have any astrophysical significance. Therefore, we avoid the region in our analysis.
The background in the 70 μm image varies across the FOV. For each profile, we fit a low-order polynomial to the boxes near the ends and used that for the background. We varied the background fit in several reasonable ways—using different number of points, different order polynomials (including constant-value backgrounds)—to see how these changes affected the measured fluxes. We find that uncertainties in the background contribute an error of about 5% to the flux measurements near the peaks of the profiles.
In Figure 3, we plot the fluxes (mJy) against angular distance (arcminutes). The zero value on the x-axis corresponds to the front edge of the zone where the 24 μm flux peaks for each strip. The first zone is then half a box width downstream, i.e., at an angular distance of 017. Positive values represent the downstream direction. In these plots, the shock is moving from right to left. The 24 μm flux profiles are shown in the top panel, and the 70 μm flux profiles in the bottom panel. The 24 μm peak fluxes for strips 1, 2, and 3 are 12.8, 11.1, and 9.2 mJy, respectively. Along each of these strips, the 24 μm flux falls to half the peak value about 09 downstream of the peak position. The 70 μm peak fluxes for strips 1, 2, and 3 are 168, 156, and 191 mJy, respectively. The peak of the 70 μm emission coincides with the peak of the 24 μm emission for strip 2, and is displaced by one resolution element (i.e., ∼03) for strips 1 and 3. Along strips 1 and 2, the 70 μm profile is significantly broader than the 24 μm profile. Along strip 3, both profiles have about the same width.
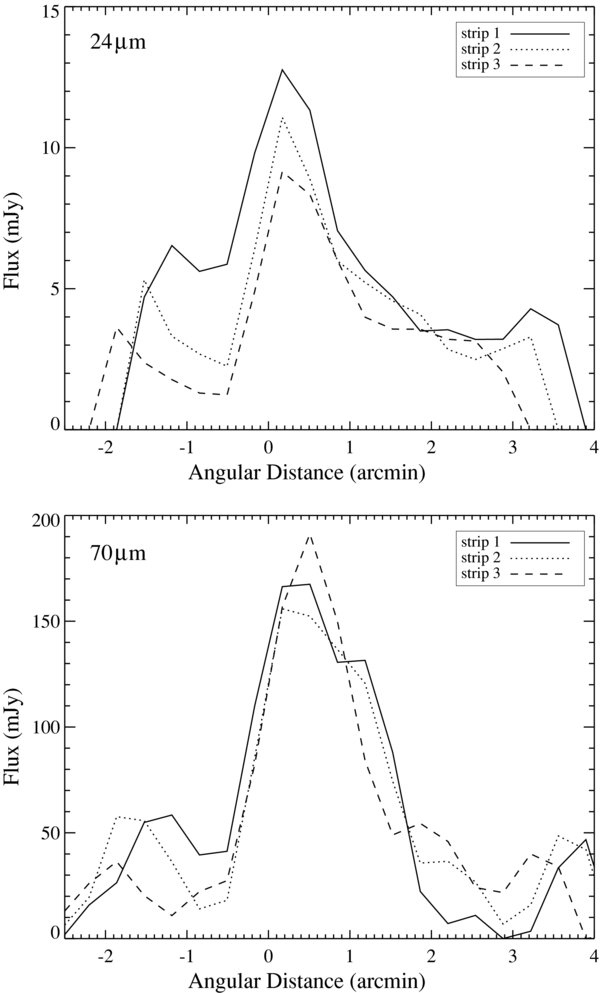
Figure 3. Fluxes (mJy) plotted against angular distance (arcmin) for the three strips shown in Figure 2. The profiles are aligned so that the peak of the 24 μm emission is at x = 017, which corresponds to half a box width. Positive values of x-axis represent the downstream direction. Top: 24 μm profiles, bottom: 70 μm profiles.
Download figure:
Standard image High-resolution imageThe fainter shock is seen in these profiles at x-axis values between about −2' and −15. We do not consider this shock in our analysis since the emission is weak, and the shock parameters are not known. However, we note that it is sufficiently well separated from the main shock and its emission does not compromise the measurement of the latter.
The primary diagnostic from our infrared observations is the 70 μm to 24 μm flux ratio, and its variation with position behind the shock front. In Table 1, we present these ratios for each of the strips out to the third zone, 085 behind the shock front. We also present the ratios for the combined fluxes from the three strips. The profiles were aligned to the peak 24 μm emission (as in Figure 3) and then summed.
Table 1. Observed 70 μm to 24 μm Flux Ratios
| Zone | Distance | Strip 1 | Strip 2 | Strip 3 | Combineda |
|---|---|---|---|---|---|
| 1 | 017 |
13.0 | 14.1 | 17.1 | 14.5 ± 2.2 |
| 2 | 051 |
14.8 | 17.1 | 23.0 | 17.9 ± 2.7 |
| 3 | 085 |
18.5 | 22.8 | 25.0 | 21.9 ± 3.3 |
Note. aThese values are the ratios obtained after summing the fluxes measured in strips 1, 2, and 3. The profiles were aligned to the peak 24 μm emission, as shown in Figure 3. 15% errors are reported—see the text for details.
Download table as: ASCIITypeset image
The errors in the absolute calibration of the 24 μm and 70 μm images are 5% and 10%, respectively (MIPS data handbook). The errors due to uncertainties in the background are about 5% for each of the images. The striping on the 70 μm image contributes an additional error. In the background region ahead of the shock, the flux/pixel along the stripes (each typically 2 pixels wide) is up to 10% higher than the flux/pixel along neighboring columns. We replaced the striped columns with the average value of pixels on either side in neighboring columns and recalculated the 70 μm flux and the flux ratio in several of the boxes. In the worst affected boxes, the change in the flux ratio was about 7%. Adding all the contributions to the error in quadrature, we find an overall error in the measured 70 μm to 24 μm flux ratio to be about 15%. In Table 1, explicit values for the errors are reported for the flux ratios obtained from the combined profile. We note that the flux ratios obtained from the three strips overlap within the errors. Therefore, in our analysis (Section 5), we treat the filament as a single shock and use the ratios from the combined profiles.
A comparison of the infrared and X-ray surface brightness profiles as a function of position is shown in Figure 4. The Chandra profile is extracted from the exposure-corrected imaging data shown in Figure 1. Both infrared and X-ray profiles shown are for strip 3 (Figure 2), with identical extraction regions used for both Spitzer and Chandra data. The X-ray emitting gas extends well beyond the infrared emission region. This is direct evidence that grain destruction is occurring in the hot plasma behind the shock, since in the absence of grain destruction one would expect the two profiles to be similar. Grain destruction is predicted to affect the 70 μm and 24 μm fluxes behind the shock front. In the following sections, the observed evolution of the 70 μm to 24 μm flux ratio will be examined in the context of specific models for dust destruction and emission.

Figure 4. Profiles along strip 3 (see Figure 2) comparing the infrared and X-ray emission. The X-ray profile is from the Chandra ACIS data, which was also used in Figure 1.
Download figure:
Standard image High-resolution image5. DUST DESTRUCTION MODELS
Dust in the Cygnus Loop shock is heated by collisions with thermal electrons, which lose their kinetic energy upon encountering dust grains. This energy is reradiated as thermal dust emission, with the spectral energy distribution well described by a modified blackbody function: the product of the Planck function, Bν(T), and the grain absorption coefficient. For submicron interstellar grains present in SNR shocks, grain cooling is proportional to their volume, while collisional heating increases with the grain geometrical cross section. Small grains emit their energy at higher temperatures than large grains because of their larger surface-to-volume ratios. For sufficiently small grains with small heat capacities, grain temperatures fluctuate between subsequent collisions with electrons, and they emit their energy at the highest temperatures. Dust sputtering by thermal ions is more effective in destroying small grains than large grains (again because of the higher surface-to-volume ratios of the former). Thus, as the smaller grains are destroyed, the average grain temperatures decrease downstream of the shock front. This accounts for the increasing 70 μm to 24 μm flux ratio with distance behind the shock. We can learn about the dust and its destruction from such data with the use of appropriate physical models.
We use dust models employed by us in our previous work with Spitzer data on SNRs in our own Galaxy (Blair et al. 2007; Morton et al. 2007) and in the Magellanic Clouds (Borkowski et al. 2006; Williams et al. 2006). These models have been described in sufficient detail in these references, and we elaborate here only on the most recent improvements relevant for the interpretation of Spitzer observations of the Cygnus Loop. The pre-shock grain size distribution is taken from the dust model of Weingartner & Draine (2001), which consists of separate carbonaceous and silicate grain populations. We now use improved sputtering yields from Nozawa et al. (2006), but with a yield enhancement for small grains discussed by Jurac et al. (1998). The most critical change in the model is that we now include grain motions, which result in "non-thermal sputtering" of the grains, and become important at the relatively low plasma temperatures present in the Cygnus Loop shock. Dust grains enter the shock with a velocity 3vs/4 relative to the downstream plasma, and slow down due to collisions with the ambient gas. We use formulas for the gas drag force from Draine & Salpeter (1979); the Coulomb drag is generally negligible in X-ray emitting plasmas. As a grain slows down, sputtering causes its mass and radius to decrease. The sputtering rate is given by Equation (27) of Draine & Salpeter (1979). The coupled equations for the grain radius and velocity are solved with standard numerical ordinary differential equation solvers. Since grain gyroradii are much smaller than the spatial scales of interest, we assume that dust and gas motions are tightly coupled, i.e., grains gyrate with small (and negligible) gyroradii around magnetic fields frozen into and moving with the shocked gas. As in our previous work on Galactic and LMC remnants, we use a plane-parallel approximation for the shock structure. The most important shock parameters are the pre-shock density and the shock speed, vs, which determine the post-shock temperature and density through the standard strong-shock jump conditions. The electron and ion temperatures in the post-shock region are expected to be equal for the relatively slow shock being studied (Ghavamian et al. 2001). In contrast with our previous work, the shock structure here is resolved, and each of the spatial bins can be conveniently described by τl and τu (τ ≡ ∫τ0npdt), the lower and upper "sputtering" ages bracketing its position.
Guided by our knowledge about the non-radiative shocks in the Cygnus Loop (see Section 2), we have calculated a grid of models with post-shock densities of 0.5, 1.0, 1.5, and 2.0 cm−3 and post-shock temperatures of 0.15, 0.20, 0.25, and 0.30 keV. The temperatures correspond to shock velocities of about 350, 400, 450, and 500 km s−1, respectively. The models were calculated with bin sizes corresponding to the width of the boxes used for measuring the observed fluxes, i.e., 2033 and extended to about 15 downstream. The conversion between angular and spatial scales assumed a distance of 540 pc to the Cygnus Loop.
In Figure 5, the 70 μm to 24 μm flux ratios predicted by the models are plotted against angular distance from the shock front. Each plot shows four models with the same post-shock densities, but different post-shock temperatures. The temperatures are coded by the same symbols in each of the four plots. (The comparison with the observed ratios, also plotted here will be discussed in Section 6.)

Figure 5. Model predictions and observed values of the 70 μm to 24 μm flux ratios. Each plot shows four models using the same post-shock density, but with different post-shock temperatures (the latter distinguished by the plot symbols). The densities (in cm−3) are indicated in the boxes, and the temperatures (in keV) are given in the legend in each plot. Overlaid on each plot are the observed ratios (strips 1, 2, and 3 combined) shown as solid square symbols along with error bars. The zero of the x-axis is the shock front in the model calculations, and the first measured point is at x = 017, consistent with the scale used in Figure 3.
Download figure:
Standard image High-resolution imageFor a post-shock density of 0.5 cm−3, the flux ratios depend quite sensitively on the post-shock temperature. Higher temperatures result in higher 70 μm to 24 μm flux ratios (Figure 5, top left panel). For post-shock densities of 1.0 and 1.5 cm−3 (top right and bottom left panels, respectively), the flux ratios are not sensitive to the post-shock temperature in the range of temperatures considered. For a post-shock density of 2.0 cm−3 (bottom right panel), higher temperatures result in lower values of the 70 μm to 24 μm flux ratio. This change in the dependence on temperature for low and high densities is due to the competing effects of sputtering by ions and grain heating by electrons. The rates of both processes increase with increasing temperature. The former results in the destruction of small grains and drives the F70 μm/F24 μm ratio up, while the latter results in heating the grains to higher temperatures and drives the ratio down. In the range of plasma temperatures considered, sputtering dominates for a post-shock density of 0.5 cm−3 and heating dominates for a post-shock density of 2.0 cm−3.
The run of the 70 μm to 24 μm flux ratio with position behind the shock front is determined by the evolution of the grain size distribution. In Figure 6, we plot this size distribution as a function of grain size in the pre-shock gas and in three zones (corresponding to the 2033 boxes) in the post-shock region. The top panel shows the distribution of graphite grains and the bottom panel shows the distribution of silicates. The plots shown are for the nH = 2.0 cm−3, kT = 0.20 keV model. Most of the sputtering happens in the first and second zones, which leads to a sharp rise in the 70 μm to 24 μm flux ratio immediately behind the shock, and a leveling off further downstream. We note that the temperatures of grains are a function of their size, and for these models lie between 30 and 60 K.
Figure 6. Grain size distribution plotted against grain radius. "n" is the number density of grains for carbonaceous grains (top panel) and silicates (bottom panel). The uppermost line is the distribution in the pre-shock gas. Successive lines, going downward, are distributions in the three zones downstream of the shock. The zones correspond to those in Figure 5. The absolute scale used for the vertical axes is arbitrary, but consistent between the plots, i.e., the relative numbers of graphite and silicate grains are correct.
Download figure:
Standard image High-resolution image
6. DISCUSSION
The observed 70 μm to 24 μm flux ratios obtained from the combined profiles, and the associated error bars (see Table 1) are shown in each of the four plots in Figure 5.
First, we note that the observed ratio in the zone closest to the shock front is higher than predicted by any of the models. The models assume a planar shock whose normal is exactly in the plane of the sky, so the bright 24 μm emission, produced just behind the shock by the smaller grains before they are destroyed, will appear in mainly the first bin. Projection effects due to the slightly curved shock surface will spread the emission among several bins, raising the flux ratio in the first model bin and lowering subsequent ones slightly. This would bring the model predictions for the first zone into closer agreement with observations.
Then, considering the flux ratios in the second and third zones behind the shock, the overlay of observed flux ratios on model predictions shows that the data are best fit by the set of models with post-shock density, nH = 2.0 cm−3. The model with nH = 0.5 cm−3 and post-shock temperature 0.15 keV also matches the data, but the higher temperature models with this density predict a steeper rise in the ratio than is observed. All the models with post-shock densities of 1.0 or 1.5 cm−3 (except possibly the one using nH = 1.5 cm−3, kT = 0.30 keV) predict flux ratios that are inconsistent with the observations.
At the relatively low plasma temperatures that obtain in the Cygnus Loop shocks, non-thermal sputtering is expected to contribute significantly to the dust destruction (e.g., Dwek et al. 1996). In order to check this, we ran a grid of models that included only thermal sputtering. The 70 μm to 24 μm flux ratios predicted in these models were about 40% lower than in the original set, and failed to reproduce the observed ratios. Considering the post-shock region out to three zones (0.14 pc), the original models predicted dust destruction fractions of 21% (nH = 0.5 cm−3, kT = 0.15 keV) to 40% (nH = 2.0 cm−3, kT = 0.30 keV) by mass. The fractions predicted by models with the same input parameters but not including non-thermal sputtering are 15% and 30%, respectively. Our data clearly show that non-thermal sputtering is an important process for dust destruction in shocks with speeds ≲500 km s−1.
Based on our comparison of models with observations, we take the nH = 2.0 cm−3, kT = 0.20 keV model to be the fiducial model for the non-radiative shock. This model predicts that 35% by mass of the grains are destroyed in the post-shock region out to 09 (0.14 pc). The post-shock temperature of the model corresponds to a shock speed of about 400 km s−1, so the thickness of the post-shock zone and the post-shock density imply that the age of the shock is about 1350 yr. The model further predicts that by the time the shock has swept up enough material for the post-shock zone to extend 15 (0.24 pc), about 43% of the dust would have been destroyed. These fractions include all grains smaller than 1 nm, which are assumed to be destroyed instantaneously at the shock front.
In order to compare the model-predicted fluxes with observations, we need to specify the dust-to-gas ratio in the pre-shock medium, and the path length through the emitting gas in the shocked region. The observed 24 μm flux averaged over the zone where it peaks and the adjacent one immediately downstream, and averaged over strips 1, 2, and 3, is about 10.3 mJy (Figure 3). We calculate the dust-to-gas ratio using parameters derived by Weingartner & Draine (2001) and presented in their Table 1. Their preferred model for the Galactic grain size distribution is the one with ratio of visual extinction to reddening, RV = 3.1, and the parameter specifying carbon abundance in small grains, 105bC = 6.0. Using the total graphite and silicate volumes per H atom for this model, and assuming 10% helium by number in calculating the gas mass density, we obtain a dust-to-gas mass ratio for our Galaxy of 0.75%. In our calculation, we use bulk densities of 3.2 and 2.2 g cm−3 for silicate and graphite grains, respectively.
For a dust-to-gas mass ratio of 0.75%, the fiducial model reproduces the observed 24 μm flux for a path length of about 0.35 pc. This value for path length is rather low. Raymond et al. (2003) find that in order to be consistent with FUSE and ROSAT data, the path length through the shocked region is 0.7–1.5 pc. Furthermore, a glance at Figure 2 shows that the filament extends about 45 in the plane of the sky, which corresponds to about 0.7 pc. We may expect that the path length in the radial direction is approximately that in the plane of the sky. This longer path through the emitting region requires a dust-to-gas mass ratio of only 0.38%, about half the preferred value.
The question of whether such a low value for the dust-to-gas ratio is reasonable or not is an open one. However, it is consistent with our earlier findings: for several remnants in the LMC (Borkowski et al. 2006; Williams et al. 2006) and Kepler's SNR in our Galaxy (Blair et al. 2007), the inferred dust-to-gas ratios are invariably lower than the standard values.
The post-shock density used in our fiducial model implies that the pre-shock density n0 = 0.5 cm−3. This agrees with the upper end of the density range estimated from the FUV and X-ray fluxes (Raymond et al. 2003). We calculated a shock model using the parameters of the fiducial model and compared the X-ray predictions with the observed ROSAT counts. In the model, the refractory elements C, Mg, Si, Ca, and Fe were assumed to be depleted by a factor of 5. This provides a way to approximate the average between normal depletion in the interstellar medium and partial destruction of the grains. The emergent counts were calculated for a line-of-sight path length of 0.7 pc. The observed counts were extracted in 25'' × 250'' bins parallel to the filament from a ROSAT PSPC image of the Cygnus Loop (details in Raymond et al. 2003). The distance behind the shock front, the observed counts, and the model-predicted counts are shown in Table 2.
Table 2. ROSAT Counts: Observation and Model Prediction
| Zone | Distancea (cm) | Observedb | Modelc |
|---|---|---|---|
| 1 | 0.9 × 10¹⁷ | 3800 | 4560 |
| 2 | 2.7 × 10¹⁷ | 2900 | 2040 |
| 3 | 4.5 × 10¹⁷ | 1600 | 1470 |
| 4 | 6.3 × 10¹⁷ | 1400 | 1350 |
| 5 | 8.1 × 10¹⁷ | 1700 | 1240 |
Notes. aConversion from arcminutes to cm based on a distance of 540 pc to the Cygnus Loop. bObserved values adapted from Raymond et al. (2003). cThe model counts assume a path length of 0.7 pc through the emitting gas.
Download table as: ASCIITypeset image
The observations and model predictions match reasonably well, given the several approximations and uncertainties. For instance, the refractory elements are liberated gradually over the observed region. Thus, the severe depletion close to the shock most probably leads to the model overestimating the X-ray count rate. Further downstream, as more heavy elements enter the gas phase, the model would underestimate the X-ray count rate. While the data quality do not warrant making further detailed calculations, it is reassuring that this is the correct trend for bringing the observed and model counts in better agreement with each other.
One caveat is that the gas density inferred from the Spitzer data, although it is at the upper limit of values estimated from FUV and X-ray data, may imply an inconsistency in the width of the observed X-ray rim that results from time-dependent ionization. The thickness of the rim is well matched for models with pre-shock density 0.25 cm−3 (see Figure 11 of Raymond et al. 2003), but would be half as much for n0 = 0.5 cm−3. However, considering the resolution of the ROSAT PSPC and the smearing due to using long, straight bins for a curved filament, the observations and model predictions are most likely consistent with each other.
7. SUMMARY AND CONCLUDING REMARKS
We have presented infrared images of a well-studied non-radiative shock in the Cygnus Loop SNR. Dust models of shocks with a velocity of about 400 km s−1 and running into gas with a density 0.5 cm−3 produce the observed 70 μm to 24 μm flux ratios. The models predict that about 35% of the dust has been destroyed in the shock over a period of about 1350 yr. The model calculations also show that non-thermal sputtering contributes significantly to the grain destruction in the relatively low temperature plasma that exists in the shocked region. To our knowledge, this is the first time non-thermal sputtering of grains in SNR shocks has been observationally verified.
The analysis and results presented here suggest certain very clear avenues for future exploration. One such study would be to calculate a self-consistent model of the infrared and X-ray emission. This would require following the gas phase abundances with position behind the shock as refractory elements are liberated from dust grains. Diagnostic information required to constrain these models would need to be obtained from a thorough analysis of Chandra X-ray observations of the shock.
In our study, we have assumed a fixed set of properties for the dust grains entering the shock. The model calculations can be extended to examine the effects of varying grain properties and/or their size distribution. For example, preliminary work in this direction (B. J. Williams et al. 2010, in preparation) indicates that porous grains may affect the longer wavelength (100 μm) emission without changing the 70 μm to 24 μm ratio. Future observations of the Cygnus Loop with Herschel and SOFIA would allow us to refine our infrared diagnostics and examine these and other questions in more detail.
We thank the referee for a careful reading of the paper and useful comments. This work was supported in part by JPL Award 1278412 to the University of California, Berkeley and North Carolina State University, Raleigh. R.S. acknowledges support from USRA at the SOFIA Science Center. T.J.G. acknowledges support under NASA contract NAS8-03060 with the Chandra X-ray Center.
Facilities: Spitzer - Spitzer Space Telescope satellite, CXO - Chandra X-ray Observatory satellite
Footnotes
- *
Based on observations made with the Spitzer Space Telescope.
- 6
Information about GeRT is available at http://ssc.spitzer.caltech.edu/mips/gert.