


ABSTRACT
We report Al–Mg, Ca, and Ti isotopic data in 16 silicon carbide grains and four silicon nitride grains from the Qingzhen enstatite chondrite. Previous C, N, and Si isotopic measurements had identified these grains as type X grains, believed to have an origin in Type II supernovae (SNe). The grains analyzed include both subtypes X1 and X2. Twelve SiC and three Si3N4 grains show evidence for initial 26Al, and eight SiC grains evidence for 44Ti; 11 SiC grains have 49Ti excesses, possibly indicating the initial presence of 49V. A correlation with subtype is shown for 44Ti: X2 grains that have the highest inferred 44Ti/48Ti ratios. A weaker correlation exists for N ratios: X2 grains with 12C/13C > 300 have higher 14N/15N ratios than X1 grains. We compare our data and data from previous reports with the SN models by Rauscher et al. The SN models can explain the C and N isotopic ratios fairly well if material from the 15N-rich spike in the He/N zone of the 25 M☉ SN model is used. They also can explain the 44Ti/48Ti ratios of the X1 and X2 grains. For the latter, substantial contributions from the inner Ni core are required. They indicate that not for all grains the 49Ti excesses can be attributed to decay of 49V and material from the He/C zone, where 49Ti is produced by neutron capture, is needed. The SN models, however, fail in explaining the Si isotopic ratios of most of the grains in a satisfactory fashion and the distinction between X1 and X2 grains. They also fail in explaining the observed correlation between the 26Al/27Al ratios and 12C/13C (and 14N/15N) ratios.
Export citation and abstract BibTeX RIS
1. INTRODUCTION
Primitive meteorites, interplanetary dust particles, and cometary dust contain tiny grains of stardust. These grains, also called presolar grains, are recognized as stardust on the basis of their anomalous isotopic compositions, and can be identified, isolated, and analyzed in detail in the laboratory (Clayton & Nittler 2004; Hoppe 2004; Lodders & Amari 2005; Lugaro 2005; Zinner 2007). Their isotopic ratios indicate that they condensed in expanding atmospheres of evolved stars and in ejecta from supernovae (SNe). Isotopic and microstructural studies of the grains provide a wealth of information on stellar nucleosynthesis, stellar evolution, Galactic chemical evolution, physical properties of stellar atmospheres, mixing of SN ejecta, interstellar dust processing, and conditions in the early Solar system. Presolar grains comprise carbonaceous phases (diamond, silicon carbide, and graphite), oxide phases (corundum, spinel, hibonite), and silicates.
Among all types of stardust, silicon carbide has been studied in most detail (e. g., Zinner 2007). According to their C and Si (and also N and Al) isotopic compositions, SiC grains have been classified into subtypes. Making up one of the rare subtypes are so-called X grains, which comprise only ∼1% of presolar SiC from the Murchison carbonaceous meteorite (Amari et al. 1992; Hoppe et al. 1996; Nittler et al. 1995). These grains are characterized by mostly 12C, 15N, and 28Si enrichments, and high inferred 26Al/27Al ratios (up to 0.6). These isotopic signatures already indicated an origin in Type II SNe, since only SNe produce Si isotopic compositions with large 28Si excesses (e.g., Woosley & Weaver 1995; Rauscher et al. 2002). The smoking gun for a SNII origin came from large 44Ca excesses observed in a subset of X grains that must come from the decay of 44Ti (T1/2 = 60 yr) (Amari et al. 1992; Hoppe et al. 1996, 2000; Nittler et al. 1996; Besmehn & Hoppe 2003). Inferred 44Ti/48Ti ratios range up to 0.6. Titanium-44 is only produced in SNe; in Type II SNe it is synthesized in the Ni- and Si-rich inner zones (Woosley & Weaver 1995; Timmes et al. 1996). Many X grains also exhibit large 49Ti excesses (Amari et al. 1992; Nittler et al. 1996), and Hoppe & Besmehn (2002) argued that they are due to decay of 49V (T1/2 = 336 d). In Type II SNe, 49V is produced in the same layers as 44Ti.
Although SiC of type X is rare, it can be preferentially located by ion imaging (Hoppe et al. 1996; Nittler et al. 1997; Lin et al. 2002; Besmehn & Hoppe 2003) or automatic isotopic measurements (Nittler & Alexander 2003) in the ion microprobe and subsequently analyzed in detail for the isotopic compositions of many elements. To date, more than 500 X grains have been identified.
Our previous analyses of SiC-X from the Qingzhen (EH3) meteorite have shown a bimodal pattern in their δ29Si/δ30Si values, with two peaks at 0.65 and 1.25, respectively (Lin et al. 2002). Delta-values are isotopic ratios expressed as permil (‰) deviations from the solar (terrestrial) ratios:

While most of the X grains in that study fall into the first group, about 25% of a total 36 grains are more depleted in 29Si relative to 30Si. These more 29Si-deficient grains were referred to as X2 grains, in order to distinguish them from the more abundant X1 grains. This bimodal pattern is also seen among X grains from other meteorites. Figure 1 is a three-isotope δ-value plot of all X grains for which data are presently available (http://presolar.wustl.edu/~pgd/). We define the grains that plot in the narrow band between the two lines as X1 grains, the grains plotting above as X0, and those plotting below as X2. Figure 2 shows a plot of the different types of X grains according to our definition. The correlation line for the type X1 grains has a slope of 0.66. Silicon nitride grains have 28Si enrichments like SiC X grains and are also plotted.
Figure 1. Silicon isotopic ratios of SiC grains of type X. The ratios are expressed as δ values, deviations from the solar (normal) ratios (broken lines) in permil (‰). Most grains lie between the two solid lines. They are defined as X1 grains and are distinguished from X0 grains, plotting above, and X2 grains, plotting below that region. The grain data are from the Presolar Database at http://presolar.wustl.edu/~pgd/.
Download figure:
Standard image High-resolution image
Figure 2. Silicon isotope ratio plot of subtypes of type X SiC grains. Also plotted are silicon nitride grains. In this and subsequent figures, the filled-in symbols are data from this study, the open symbols are data from other publications (http://presolar.wustl.edu/~pgd/). The solid line is a fit through the X1 grain data points.
Download figure:
Standard image High-resolution imageIn the Lin et al. (2002) study, we noticed already some correlation between the Si and C isotopic ratios of X grains: the 12C/13C ratios of the nine X2 grains are on average higher than those of the 27 X1 grains. During that study we identified 9 X type Si3N4 grains. In their C and Si isotopic compositions they appear to be closer to X1 than X2 grains.
In order to explore in more detail the differences between the X1 and X2 subtypes and to see whether these differences extend to the isotopic ratios of other elements, we measured isotopic and elemental compositions of Mg, Al, Ca, Ti, and V in the X grains from the Qingzhen enstatite meteorite previously identified (Lin et al. 2002). With these data we determine the inferred isotopic ratios of the short-lived nuclides 26Al, 44Ti, and possibly 49V. The results are then compared with theoretical models of Type II SNe (Rauscher et al. 2002).
2. SAMPLES AND EXPERIMENTS
In our previous study (Lin et al. 2002), two size fractions, QZR4 (0.4–0.8 μm) and QZR5 (0.8–2 μm), of acid residues from Qingzhen were mapped for 16O−/18O− and 28Si−/30Si− ratios in the Cameca IMS 3f ion microprobe at Washington University. High-mass-resolution analyses of C, N, and Si were conducted on the 30Si deficient Si-rich grains and led to the identification of 36 SiC X grains and nine type X Si3N4 grains. A total of 23 of the X grains (10 SiC-X1, 8 SiC-X2, 5 Si3N4) from the QZR4 and one of the QZR5 fractions were selected for the present study.
All of the X grains were re-located and examined in a JEOL 840A scanning electron microscope (SEM) equipped with an energy dispersive X-ray spectrometer (EDS). Significant X-ray signals of Al were detected in almost all X grains, while Mg was found in a smaller number of grains. The high-mass-resolution analyses of Al, Mg, Ca, Ti, and V isotopes were carried out with the CAMECA NanoSIMS 50 at Washington University. In order to avoid interference of Mg and Al from neighboring spinel (MgAl2O4) grains, only 15 of the X grains (12 SiC, 3 Si3N4), well separated from spinel, were analyzed for Mg isotopes and Al. Magnesium-24, 25Mg, 26Mg, 27Al, and 28Si were measured in multidetection by rastering a primary O− beam of ∼10 pA over an area of 3 × 3 μm2. Possible interferences from surroundings were avoided by accepting counts only from an area containing the grain within the raster area. After the Al–Mg measurements, the remaining grains (ten SiC-X, two Si3N4) and another six SiC-X grains and two Si3N4 grains were analyzed for Ca and Ti. Measurements were made in a combined mode of magnetic peak jumping and multidetection. During the first field step we detected 28Si, 40Ca, 44Ca, 46Ti, and 48Ti, during the second field step 47Ti, 49Ti, and 51V. Terrestrial spinel was used as a standard for Mg and Al, and perovskite (CaTiO3) for the isotopes of Ca and Ti. For the determination of the elemental abundances of Ca, Ti, and V we used NIST Silicate Glass Certified Reference Material SRM 610 (previously NBS 610 glass; Kane 1998) as a standard.
As sensitivity factors of Mg and Al relative to Si we used the values 5.82 and 4.45 determined by Hoppe et al. (2000). The resulting Mg/Al sensitivity factor of 1.31 is not very different from the ratio of 1.25 we obtained from the terrestrial spinel standard. The sensitivity factors of Ca, Ti, and V relative to Si measured on SRM 610 are 10.8, 3.82, and 3.76, respectively. Except for Ti, they are quite similar to the ratios of 9.96, 4.57, and 3.89 of Hinton (1990) we obtain if we use the recently determined concentrations of 460 ppm and 462 ppm for Ti and V (Rocholl et al. 1997) instead of the values of 437 ppm and 500 ppm used by Hinton. Besmehn & Hoppe (2003) obtained 8.2 and 4.2 for the Ca/Si and Ti/Si sensitivity factors. Elemental sensitivity factors depend not only on the instrument but also on instrumental settings. We therefore use the values obtained by our measurements on SRM 610. Sensitivity factors also depend on the matrix. Our Ca/Ti factor of 2.83 is very different from the factor of 5.48 we obtain from perovskite, which in turn agrees with the value of 5.6 measured by Hoppe et al. (2000). We think that the Ca/Ti sensitivity factor in SiC is probably closer to that in a silicate glass than in perovskite.
Radiogenic excesses of 26Mg and 44Ca (26Mg* and 44Ca*) were calculated by subtracting the "normal" components obtained by multiplying the 24Mg and 40Ca signals with the terrestrial 26Mg/24Mg and 44Ca/40Ca ratios measured in the spinel and perovskite standards, respectively. This procedure is strictly speaking not correct because the intrinsic initial 26Mg/24Mg and 44Ca/40Ca ratios, i.e., the ratios without contributions from 26Al and 44Ti decay cannot be considered to be normal. However, in essential all cases, because of large Al/Mg and Ti/Ca ratios, the radiogenic contributions dominate. For Mg we can estimate the intrinsic anomaly in the 26Mg/24Mg ratio from the 25Mg/24Mg ratio. These issues have been discussed before (Zinner et al. 1991; Nittler et al. 1996). Deviations from the inferred 26Al/27Al and 44Ti/48Ti are probably small.
Another possibility of distorting these ratios is the presence of contamination by terrestrial Mg, Al, Ca, and Ti. Because the SiC-rich residues from Qingzhen also contain spinel, contamination is more likely to be an issue for Mg and Al than for Ca and Ti. Admixture of Mg with terrestrial isotopic ratios does not affect the inferred 26Al/27Al ratios. It reduces both the measured 26Mg/24Mg and Al/24Mg ratio in the same way so that the 26Al/27Al ratio remains the same. The situation is different for contamination with Al. Any addition of non-intrinsic Al reduces the inferred 26Al/27Al ratio. Although we tried to avoid spinel grains, the possibility of their presence means that all 26Al/27Al ratios are strictly speaking only lower limits.
An example of some of the difficulties encountered in these analyses is exhibited in Figure 3, which shows secondary ion signals of several isotopes and isotopic ratios as a function of measurement time during the analysis of grain 5A-551-24. The increase of the Si signal at the beginning of the measurement is an artifact that is a combination of preferential sputtering and the differences in ionization efficiencies of different elements during the time O from the primary beam is implanted into the sample. What complicates the situation is that the sample has previously been analyzed with a Cs beam, i.e., the sample contains implanted Cs. Since Cs easily gives off an electron, its presence affects the ionization efficiency of other elements. The ionization efficiency might even depend on the site of atoms. Note that right at the beginning of the run, the behavior of the 26Mg signal differs from that of the other Mg isotopes, probably reflecting the fact that the 26Mg signal is dominated by radiogenic 26Mg, derived from the decay of 26Al. Thus, ion signals should be taken as reflecting the composition of the grain only after removal of Cs and implantation of O at around 200 s.
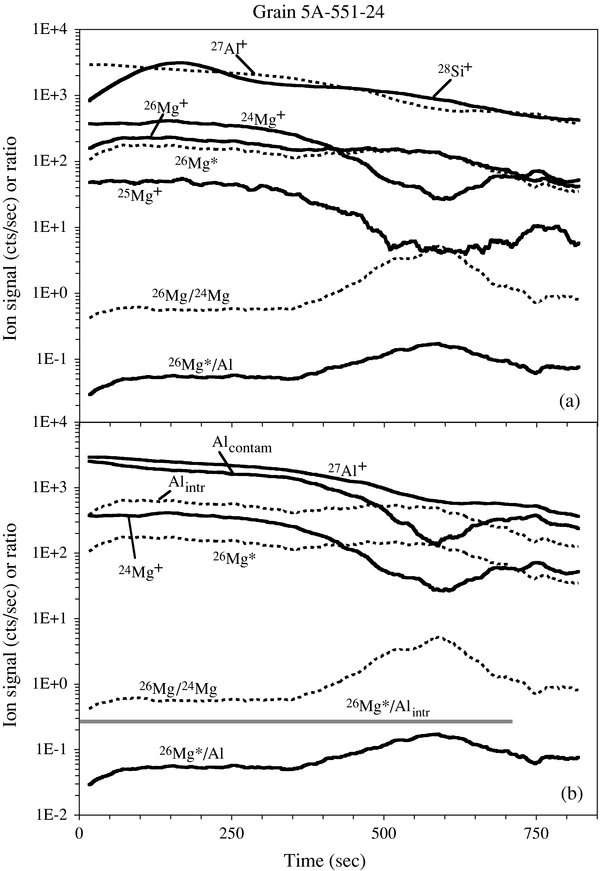
Figure 3. Depth profiles of ion signals and of isotopic ratios in grain 5A-551-24. In order to reduce scatter, we plot running averages over ten measurements. 26Mg* denotes the radiogenic excess of 26Mg due to the decay of 26Al. In panel (a), it can be seen that radiogenic 26Mg constitutes most of the 26Mg signal. The apparent 26Mg*/Al ratio is the same as the inferred initial 26Al/27Al ratio and varies as a function of depth. In panel (b), we assume that the initial 26Al/27Al was constant throughout the grain (horizontal line labeled 26Mg*/Alintr) and calculate the corresponding original Al content (Alintr) and a contamination component (Alcontam) that would explain the apparent variation in the 26Mg*/Al ratio. See the text for a more detailed discussion.
Download figure:
Standard image High-resolution imageWhat is unexpected is that the 26Mg/24Mg and 26Mg*/Al ratios vary during the measurement. The 26Mg*/Al ratio (which within the Mg/Al sensitivity factor is the same as the 26Al/27Al ratio) varies from 0.058 at 200 s to a maximum of 0.19 at 600 s (corresponding to a variation from 0.044 to 0.15 for 26Al/27Al). The 26Al/27Al ratio derived from the counts obtained from the whole grain is 0.066. On the face of it, one might conclude that the 26Al/27Al ratio varies throughout the grain. However, this conclusion does not include the possibility of contamination. What makes us suspicious is the fact that the Mg concentration and the Mg/Al ratio in the grain are unusually high and the fact that the maximum of the inferred 26Al/27Al ratio occurs at a place where there is a dip in the 24Mg and Al signals (Figure 3). In order to test whether contamination could account for the apparent variation in 26Al/27Al, we assumed a constant 26Al/27Al ratio and calculated the corresponding intrinsic Al concentration, assuming that the remaining Al derives from contamination. The lower panel of Figure 3 shows this for an assumed 26Mg*/Al ratio of 0.275 (corresponding to an 26Al/27Al ratio of 0.21). As can be seen, the calculated Al contamination is quite parallel to the 24Mg signal, indicating a rather constant Al/Mg ratio for the contamination. Since contamination is likely for this grain, we cannot claim that its 26Al/27Al ratio is heterogeneous. Another consequence is that the true 26Al/27Al of the grain is much higher (0.21) than what we obtain from the total counts (0.066).
A possible problem with this scenario is that the Al/Mg ratio inferred for the contamination is ∼5.6, much higher than the atomic Al/Mg ratio of 2 for spinel (MgAl2O4), the most likely mineral other than SiC to be present in the analyzed residue. Corundum (Al2O3) and hibonite (CaAl12O19), the other oxide phases that could be present, are expected to have much higher Al/Mg ratios, and silicates, which could have an Al/Mg ratio of 5.6, should have been removed by the chemical treatment. Furthermore, before the Mg–Al analysis, grain 5A-551-24 was examined in the SEM and no obvious adhering grain could be seen in the image. Thus, we cannot absolutely rule out heterogeneous 26Al/27Al in the grain. Still, the fact that the depth profile of the Al signal inferred for extraneous Al from the assumption of uniform 26Al/27Al mimics the depth profiles of 24Mg and 25Mg (i.e., the isotopically normal Mg) appears to be too much of a coincidence and contamination seems to be a more likely proposition.
Even in the absence of obvious contamination, surface effects in the ionization efficiency can lead to apparent variation in the inferred 26Al/27Al ratio. An example is shown in Figure 4. As is seen also in other grains, in grain 4A-454-27 the Si signal rises slowly, the 26Mg signal less slowly, the Al signal even less so, and the 24Mg signal not at all. In this grain, the Al/24Mg ratio is much higher than in grain 5A-551-24 and the 26Mg signal is almost entirely of radiogenic origin. But because of its slower rise than the Al signal, the inferred 26Al/27Al ratio apparently varies from 0.105 to 0.237. Again, the higher ratio is most likely the correct one.
Figure 4. Depth profiles of ion signals and isotopic ratios in grain 4A-454-27. The different rates of increase of the 24Mg, 26Mg, 27Al, and 28Si are attributed to implantation effects at the beginning of the SIMS analysis. See the text for details.
Download figure:
Standard image High-resolution image3. RESULTS
3.1. Isotopic Compositions
Elemental and isotopic compositions of 10 SiC-X1, 8 SiC-X2, and 5 Si3N4 grains are given in Table 1. The C, N, and Si isotopic ratios in the table are taken from our previous analysis of these grains (Lin et al. 2002). All grains analyzed for Mg show normal 25Mg/24Mg ratios within measurement errors, but large excesses of 26Mg, indicating the initial presence of short-lived 26Al, with the inferred 26Al/27Al ratios ranging from 6.3 × 10⁻³ to 0.31. Figure 5 shows the 26Al/27Al ratio plotted versus 12C/13C and δ29Si/28Si. Together with the results of this study, we also plot the results of previous studies of X grains from other meteorites (Amari et al. 1992 and unpublished; Hoppe et al. 1994, 1996, 2000; Nittler 1996; Nittler et al. 1996; Nittler & Hoppe 2005; Huss et al. 1997; Henkel et al. 2007; Zinner et al. 2007). The X1 grains of our study appear to have on average somewhat higher 26Al/27Al ratios than the X2 grains. However, if we consider all grains, 45 out of 63 (71%) X1 grains and 17 out 27 (63%) of X2 grains have 26Al/27Al ratios greater than 0.1, a difference that is statistically not significant. There are no obvious strong correlations between 26Al/27Al and either 12C/13C or δ29Si/28Si. Except for one special grain with an unusually low 12C/13C ratio (Nittler & Hoppe 2005), the upper cutoff for 26Al/27Al increases with increasing 12C/13C (Figure 5(a)) and with decreasing δ29Si/28Si (Figure 5(b)), but more analyses are needed to make this a firm observation. In Figure 5(b), the δ29Si/28Si values of X2 grains are smaller but this is a consequence of the grains' definition based on their Si isotopic ratios (Figures 1 and 2).
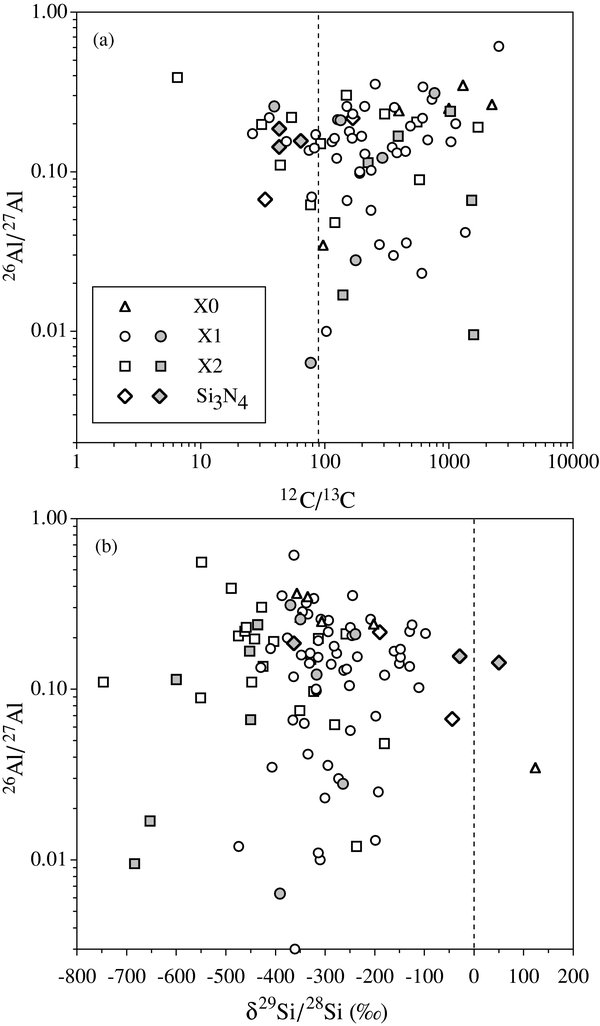
Figure 5. Inferred initial 26Al/26Al ratios of different subtypes of X grains as a function of the 12C/13C ratio (a) and the 29Si/28Si ratio (b). The upper limits of the 26Al/26Al ratio tend to increase with increasing 12C/13C ratios and decreasing 29Si/28Si ratios. The numbers of grains in the two plots are not identical because not all grains had their C and Si isotopic ratios measured.
Download figure:
Standard image High-resolution imageTable 1. Isotopic and Elemental Data on Type X SiC and Si3N4 Grains
| Grain Label | Type | 12C/13C | 14N/15N | δ29Si/28Si | δ30Si/28Si | 26Al/27Al | δ44Ca/40Ca | 44Ti/48Ti | δ46Ti/48Ti | δ47Ti/48Ti | δ49Ti/48Ti | Ala | Mga | Caa | Tia | Va |
|---|---|---|---|---|---|---|---|---|---|---|---|---|---|---|---|---|
| (‰) | (‰) | (×1000) | (‰) | (×1000) | (‰) | (‰) | (‰) | (%) | (%) | (ppm) | (ppm) | (ppm) | ||||
| 4A-277-18 | X1 | 77 ± 4 | 102 ± 10 | −391 ± 14 | −510 ± 12 | 6.3 ± 0.4 | 146 ± 66 | 3.5 ± 1.6 | −79 ± 51 | −133 ± 51 | 240 ± 72 | 12.5b | 2.17b | 1117 | 1088 | 22.6 |
| 4A-300-6 | X1 | 556 ± 42 | 80 ± 4 | −345 ± 9 | −549 ± 8 | 82 ± 61 | 49 ± 182 | −124 ± 167 | 888 ± 309 | 213 | 16 | 0.2 | ||||
| 4A-430-14 | X1 | 101 ± 3 | 136 ± 5 | −186 ± 10 | −235 ± 11 | 39 ± 26 | −40 ± 53 | −80 ± 53 | 305 ± 75 | 2774 | 385 | 2.7 | ||||
| 4A-438-25 | X1 | 134 ± 11 | 70 ± 3 | −239 ± 15 | −362 ± 14 | 210 ± 6 | 5.8 | 0.08 | ||||||||
| 4A-454-27 | X1 | 39 ± 1 | 24.9 ± 0.6 | −350 ± 12 | −439 ± 11 | 257 ± 7 | 122 ± 57 | 55 ± 26 | 314 ± 215 | 230 ± 210 | 897 ± 315 | 3.73 | 0.02 | 845 | 48 | 1.4 |
| 4A-461-5 | X1 | 101 ± 3 | 22.6 ± 0.5 | −96 ± 11 | −189 ± 11 | 48 ± 45 | −6 ± 25 | −67 ± 25 | 72 ± 32 | 1492 | 3196 | 27.4 | ||||
| 4A-482-20 | X1 | 765 ± 147 | 68 ± 3 | −370 ± 23 | −493 ± 20 | 311 ± 82 | −104 ± 175 | 195 ± 350 | 21 ± 325 | 1180 ± 598 | 4.98 | 0.0003 | 816 | 215 | 18.6 | |
| 5A-188-1 | X1 | 357 ± 9 | 81 ± 2 | −284 ± 3 | −443 ± 3 | 65 ± 19 | 1.2 ± 0.3 | −3 ± 17 | −16 ± 16 | 155 ± 21 | 1132 | 1432 | 23 | |||
| 5A-396-3 | X1 | 177 ± 6 | 138 ± 7 | −264 ± 6 | −389 ± 5 | 28 ± 1 | 32 ± 84 | 32 ± 169 | 40 ± 179 | 144 ± 217 | 1.43 | 0.02 | 434 | 76 | 1.9 | |
| 5A-564-14 | X1 | 291 ± 8 | −317 ± 6 | −487 ± 5 | 122 ± 2 | 1225 ± 297 | 5.7 ± 1.4 | −72 ± 71 | −137 ± 71 | 691 ± 124 | 1.09 | 0.04 | 62 | 306 | 8.9 | |
| 4A-134-9 | X2 | 391 ± 27 | 39 ± 1 | −452 ± 9 | −387 ± 11 | 167 ± 2 | 4977 ± 634 | 25.6 ± 2.5 | 138 ± 98 | −141 ± 85 | 1148 ± 173 | 0.5 | 0.07 | 42 | 189 | 3.3 |
| 4A-219-27B | X2 | 223 ± 39 | 102 ± 10 | −600 ± 18 | −459 ± 20 | 114 ± 10 | 136 ± 124 | −9 ± 46 | 15 ± 48 | 5 ± 55 | 2.55 | 0.03 | 653 | 3173 | 88.3 | |
| 5A-80-7 | X2 | 1026 ± 65 | 88 ± 2 | −436 ± 5 | −494 ± 5 | 239 ± 2 | 88 ± 32 | 7.4 ± 2.7 | 22 ± 48 | −62 ± 48 | 768 ± 83 | 7.65 | 0.11 | 1184 | 331 | 7.9 |
| 5A-117-3 | X2 | 1581 ± 102 | 116 ± 11 | −684 ± 3 | −490 ± 4 | 9.5 ± 0.7 | 7584 ± 571 | 935 ± 129 | 848 ± 557 | 116 ± 342 | 2517 ± 814 | 0.28 | 0.04 | 55 | 11 | 1.5 |
| 5A-247-4 | X2 | 95 ± 2 | 52 ± 2 | −469 ± 5 | −581 ± 5 | 383 ± 105 | 46 ± 17 | 72 ± 173 | 17 ± 178 | 118 ± 216 | 37 | 7 | 0.1 | |||
| 5A-283-8 | X2 | 1848 ± 378 | 6.9 ± 0.2 | −540 ± 9 | −308 ± 11 | 18 ± 127 | −242 ± 176 | −180 ± 196 | −396 ± 188 | 1307 | 345 | 7.2 | ||||
| 5A-425-14 | X2 | 140 ± 10 | 97 ± 10 | −653 ± 6 | −446 ± 7 | 17 ± 2 | 0.91 | 0.07 | ||||||||
| 5A-551-24 | X2 | 1528 ± 270 | 46 ± 2.0 | −450 ± 8 | −348 ± 9 | 66 ± 1 | 15.1b | 1.74b | ||||||||
| 4A-107-16 | Si3N4 | 43 ± 5 | 26 ± 1 | 50 ± 23 | −174 ± 20 | 143 ± 4 | 72 ± 40 | 342 ± 147 | 5 ± 126 | 255 ± 165 | 0.92 | 0.02 | 4651 | 295 | 4.5 | |
| 4A-194-20 | Si3N4 | 64 ± 20 | 189 ± 18 | −29 ± 14 | −42 ± 15 | 156 ± 4 | 63 ± 123 | 397 ± 740 | 56 ± 635 | 504 ± 904 | 1.47 | 0.23 | 3896 | 70 | 2.4 | |
| 4A-280-3 | Si3N4 | 67 ± 2 | 64 ± 1 | −165 ± 10 | −262 ± 10 | 28 ± 14 | 97 ± 38 | 71 ± 39 | 150 ± 46 | 7860 | 306 | 2.7 | ||||
| 4A-306-21 | Si3N4 | 43 ± 9 | −363 ± 22 | −445 ± 20 | 186 ± 21 | 1.54 | 0.03 | |||||||||
| 5A-339-5 | Si3N4 | 221 ± 48 | 127 ± 8 | −442 ± 9 | −436 ± 8 | −223 ± 92 | 1819 ± 1085 | 2284 ± 1236 | 170 ± 748 | 7777 | 92 | 7.4 | ||||
Notes. All errors are 1σ. aElemental concentrations are based on total counts, without taking into account any surface effects as discussed in the text. For Mg, Ca, and Ti they are based on 24Ma, 40Ca, and 48Ti under the assumption of normal isotopic ratios. bA substantial amount might be contamination. See Figure 3 and discussion in the text.
Download table as: ASCIITypeset image
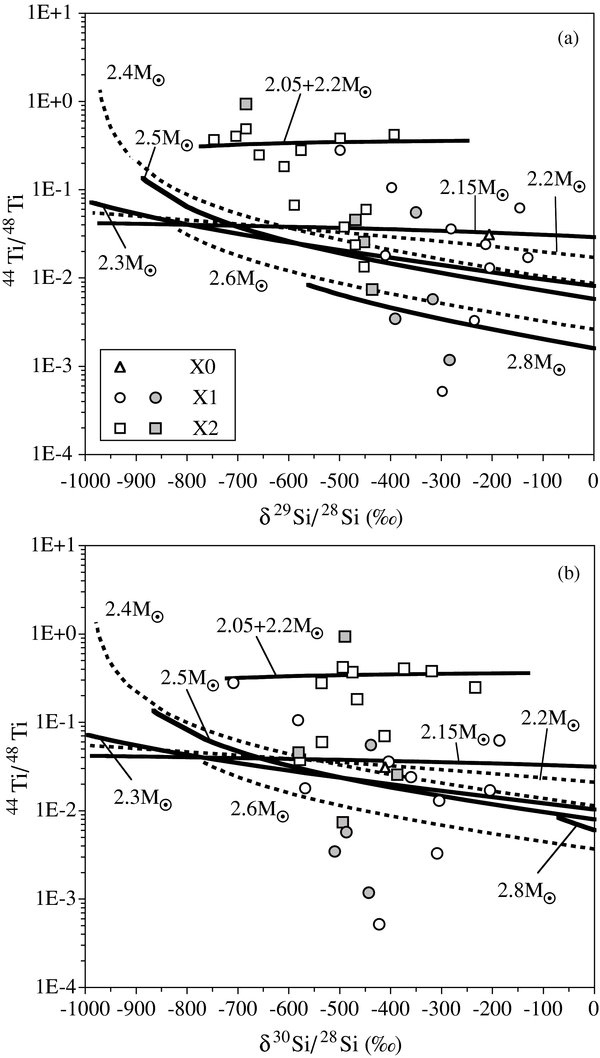
Four SiC-X1 grains and four SiC-X2 grains have 44Ca excesses of more than 2σ (Table 1). No excess of 44Ca was detected for all four Si3N4 grains within the analytical errors. Although we have not obtained isotopic ratios for 42Ca and 43Ca, we assign a radiogenic origin to these 44Ca excesses. The O/C and O/Ne zones have high 44Ca and low 40Ca abundances (Rauscher et al. 2002) that would give large 44Ca excesses. However, these zones are so rich in oxygen that any admixture from these layers that would reproduce the 44Ca excesses in our grains results in C/O ratios of much less than 1, i.e., in conditions that are not conducive to the condensation of SiC (Ebel & Grossman 2001). Still, we caution the reader that 44Ca excesses of less than 200‰ could reflect contributions from the O-rich SN zones if these grains can condense in a gas with C < O. Figure 6 is a plot of inferred 44Ti/48Ti versus δ29,30Si/28Si of our data and those of other investigators (Amari et al. 1992 and unpublished; Hoppe et al. 1996, 2000; Nittler et al. 1996; Besmehn 2001; Besmehn & Hoppe 2003). The 44Ti/48Ti versus δ29Si/28Si plot (Figure 6(b)) exhibits a clear negative correlation between these two ratios. It also shows that, although there is some overlap, X2 grains on average have much larger 44Ti/48Ti ratios than X1 grains. The ratio of 0.94 in grain 5A-117-3 is the highest value reported to date.

Figure 6. Inferred initial 44Ti/48Ti ratios of different subtypes of X grains as a function of the C and Si isotopic ratios. Type X2 grains have the highest 44Ti/48Ti ratios and there is an overall negative correlation between these ratios and the 29Si/28Si ratios, with X2 grains having the smallest 29Si/28Si ratios and largest 44Ti/48Ti ratios. No such correlations are apparent between 44Ti/48Ti and 12C/13C or 30Si/28Si. There are fewer data points in (a) because not all X grains had their C isotopic ratios measured.
Download figure:
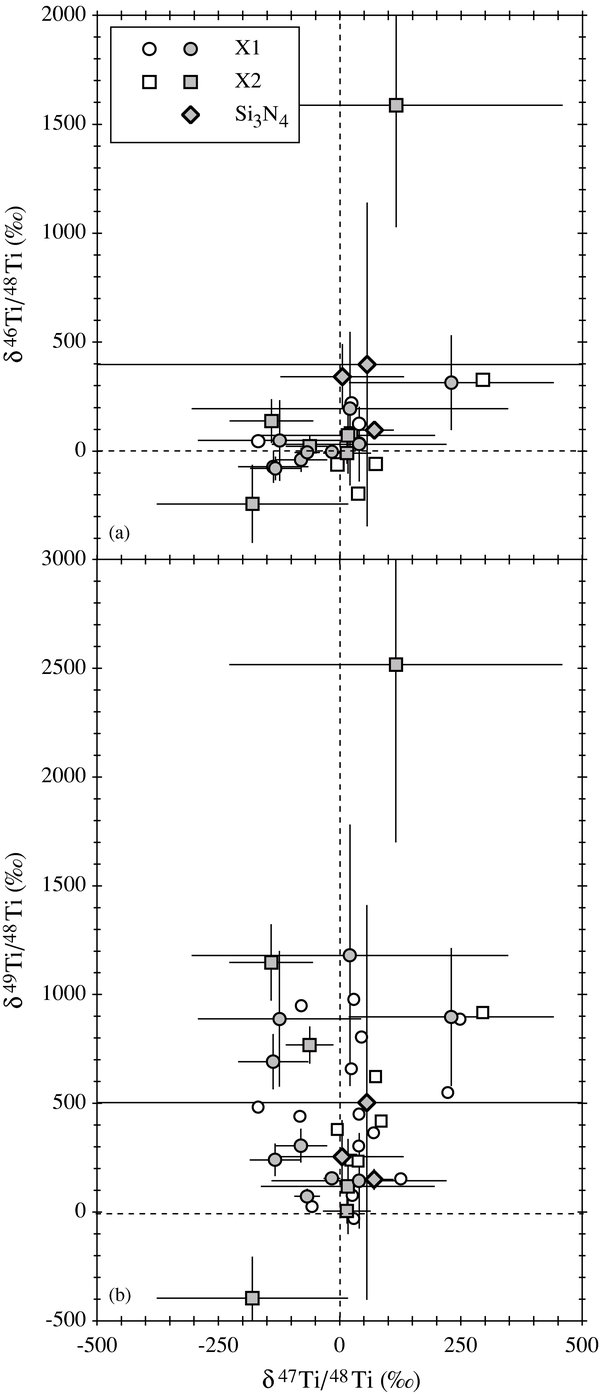
Standard image High-resolution imageOur Ti isotopic ratios are plotted in Figure 7 together with data from other investigations (Amari et al. 1992 and unpublished; Nittler et al. 1996; Hoppe & Besmehn 2002; Nittler & Hoppe 2005). The 46Ti/48Ti and 47Ti/48Ti ratios of most of our grains are normal. Two Si3N4 grains have 46Ti excesses larger than 2σ and two SiC X1 grains 47Ti deficits exceeding 2σ. The situation is completely different for 49Ti, for which we find large excesses (Table 1 and Figure 7(b)). Grain 5A-283-8 has 46Ti and 49Ti deficits, but the anomalies in this grain are marginal. Figure 7(c) shows that quite a few previously measured X grains have substantial deficits in 46Ti and 49Ti. These grains do not show up in Figures 7(a) and 7(b) because their 47Ti/48Ti ratios had not been measured. Hoppe & Besmehn (2002) have argued on the basis of a correlation between 49Ti excesses and the V/Ti ratios in X grains for a radiogenic origin of these excesses from the decay of short-lived (T1/2 = 332 d) 49V. In Figure 8, we plot δ49Ti/48Ti versus the 51V/48Ti ratio together with the data by Hoppe & Besmehn (2002) and a few unpublished measurements by Amari. We observe a general correlation for our data, although there is a lot of scatter. However, the best-fit (dashed) line through our data has a much larger slope than the (solid) line through the data points of Hoppe & Besmehn (2002). One glaring difference is that, on average, our 51V/48Ti ratios are much smaller. If 49Ti has indeed a radiogenic origin (we shall return to this issue in the next section), our data imply a higher 49V/51V ratio than those by Hoppe & Besmehn (2002).
Download figure:
Standard image High-resolution image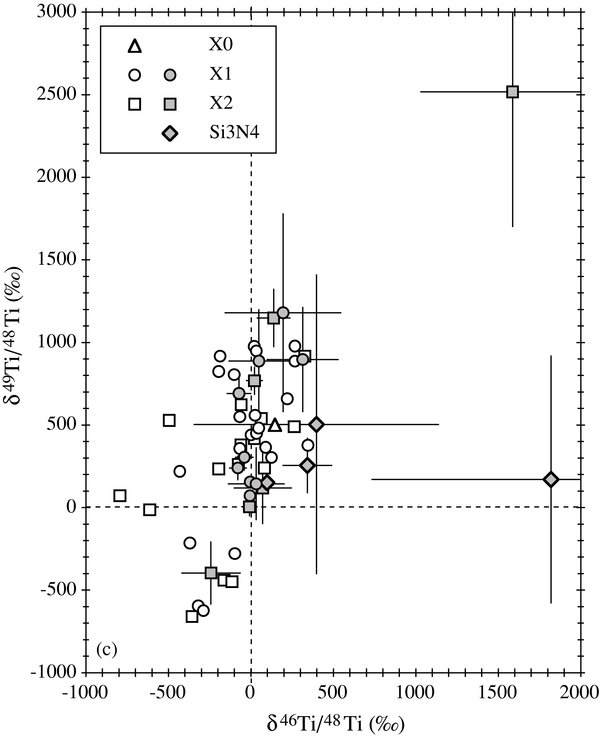
Figure 7. Titanium isotopic ratios of different subtypes of X grains. 1σ errors are shown only for the grains of this study. Data from other studies are plotted if at least one ratio is anomalous by 1.5σ.
Download figure:
Standard image High-resolution image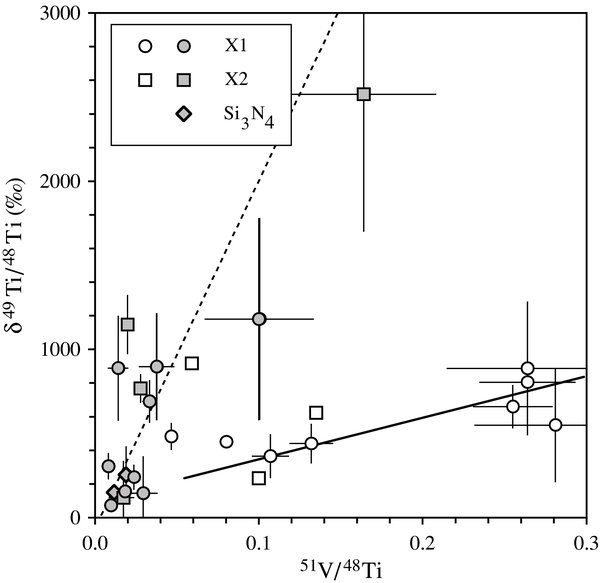
Figure 8. 49Ti/48Ti ratios of different subtypes of X grains as a function of the 51V/48Ti ratio. The solid line is a correlation line through the data obtained by Hoppe & Besmehn (2002), the broken line a correlation line through our data.
Download figure:
Standard image High-resolution image3.2. Elemental Compositions
The Al and Mg contents of all X grains of this study cover a large range as do the Al/Mg ratios (Table 1). Magnesium does not condense easily into SiC (Lodders & Fegley 1995, 1997) and Mg concentrations of all types of SiC grains are lower than Al concentrations (Amari et al. 1995). The Mg concentrations of two X grains of this study (4A-277-18 and 5A-551-24) are much higher than those of the other grains. These two grains have also the highest Al contents, and for the second grain we argued that contamination could possibly account for the high Al and Mg concentrations, in which case the true inferred 26Al/27Al ratio could be much higher (Figure 3). In contrast to grain 5A-551-24, the Al and Mg signals are essentially constant throughout the analysis of grain 4A-277-18 but, again, we cannot exclude contamination to account for most of the Al and Mg measured. Another grain with a relatively low Al/Mg ratios is grain 4A-134-9; however, both the Al and Mg concentrations are low. This grain also has a large 26Mg excess (Figure 9(a)) and the inferred 26Al/27Al ratio is 0.17 (Table 1). The situation is similar for X Si3N4 grain 4A-194-20. A special case of the opposite extreme is represented by grain 4A-482-20, which has an extremely low content of normal Mg (Table 1) and in which essentially all of its Mg is radiogenic 26Mg. During the analysis of this grain, we obtained only 29 counts of 24Mg, compared to 131,000 counts of 26Mg, resulting in a 26Mg/24Mg ratio of 4500 (the normal ratio is 0.139). We cannot observe any obvious differences between X1 and X2 grains either in their Al and Mg contents or their Al/Mg ratios.

Figure 9. Depth profiles of ion signals and isotopic ratios in grain 4A-134-9. Panel (a) displays traces of Mg, Al, and Si, panel (b) of Si, Ca, and Ti. The measurements of (a) were made before those of (b). Because of the low ion signal in panel (b), we plotted running averages over ten measurements. As for grain 4A-454-27 (Figure 4), the slow initial increase of the 28Si signal (and to a lesser extent that of 26Mg in (a)) is an implantation effect of the primary beam. Because O was already implanted when the Ca–Ti profile was obtained, there is no such increase in (b) and the 28Si signal decreases as the grain is sputtered away. The Ti signals vary strongly, indicating the presence of Ti-rich subgrains. The 49Tisol line is the signal expected for a solar 49Ti/48Ti ratio. This grain clearly has a 49Ti excess.
Download figure:
Standard image High-resolution imageThe Ca, Ti, and V concentrations also cover large ranges (Table 1 and Figure 10). We cannot observe any obvious correlation between the Ca and Ti abundances, as well as no differences between X1 and X2 grains. Silicon nitride X grains have higher Ca abundances than any of the SiC X grains (Figure 10(a)). There is a clear difference in the distribution of Ca, Ti, and V inside the grains. Figures 9(b) and 11 show depth profiles of the ion signals of selected isotopes of two SiC grains during the NanoSIMS analysis as the primary ion beams sputter material from the grains. Titanium appears to reside in subgrains, an observations made previously for an SiC X grain (Besmehn & Hoppe 2003), but also for mainstream grains (Gyngard et al. 2006). Transmission electron microscope (TEM) studies of SiC grains identified TiC subgrains within a mainstream grain (Bernatowicz et al. 1992) and an X grain (Hynes et al. 2006). In contrast to Ti, Ca is more uniformly distributed (Figures 9(b) and 11) throughout the grains as are Al and Mg (Figure 9(a)). The spatial distribution of Ti and Ca in X grains is similar to that of Fe and Ni, where Fe resides in subgrains, whereas Ni is fairly uniformly distributed throughout the SiC grains (Marhas et al. 2008).
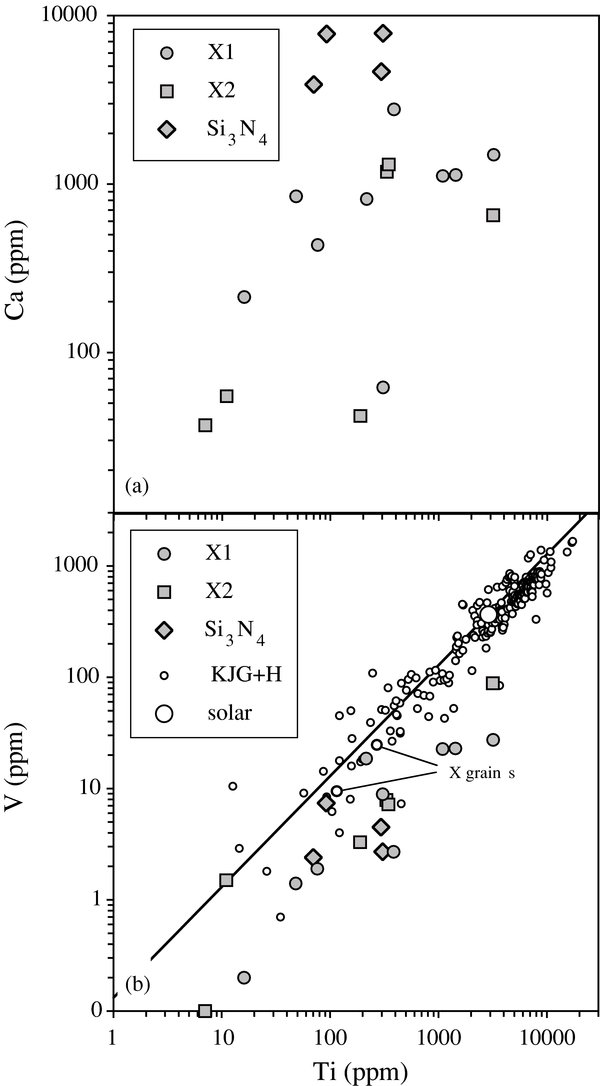
Figure 10. Concentrations of Ca, Ti, and V measured in X grains. Panel (b) shows also Ti and V abundances previously measured in the KJG and KJH size fractions of Murchison SiC grains (Amari et al. 1995; Gyngard et al. 2006 and unpublished). Two X grains from the previous studies are indicated. The solid black line in panel (b) is a line with solar V/Ti ratio.
Download figure:
Standard image High-resolution imageVanadium and Ti abundances are fairly well correlated (Figure 10(b)). This is also shown in Figure 11, where V follows Ti in grain 4A-461-5; in grain 4A-134-9 (Figure 9(b)) the V signal was too low for determination of its spatial distribution. Grain 4A-461-5 has no 49Ti excess, but grain 4A-134-9 does. In Figure 9(b), we plot a 49Ti profile expected for a solar 49Ti/48Ti ratio in this grain. It can be clearly seen that the measured 49Ti signal is higher. Figure 10(b) shows also Ti and V abundances previously measured in grains from Murchison SiC separates KJG and KJH (Amari et al. 1995; Gyngard et al. 2006 and unpublished). Most of these grains are mainstream grains; two X grains from KJH are indicated in the plot. The Ti and V abundances of our grains are not only lower than those of most KJG and KJH grains, but the V/Ti ratios are lower. Most KJG and KJH grains have V/Ti ratios close to the solar ratio (the solid line in Figure 10(b)), and this has been interpreted that both Ti and V go into SiC during its condensation (Amari et al. 1995; Lodders & Fegley 1995, 1999). In contrast, our X grains fall below this line. It has been noted before (Amari et al. 1995) that X grains have lower concentrations of refractory trace elements than mainstream grains. However, we have no satisfactory explanation why the V/Ti ratios of our X grains are not only lower than those of mainstream grains but, as already pointed out in the previous section, also lower than those of the X grains from Murchison measured by Hoppe & Besmehn (2002). We believe that we can exclude an experimental artifact and we still see a general correlation between the Ti and V abundances. Even the 51V/48Ti ratios measured by Hoppe and Besmehn span a factor of almost 3, and 4 of their grains have higher than solar ratios (51V/48Tisolar = 0.16). In addition, ratios measured in several X grains by Amari (unpublished) are lower than 0.1 (open symbols in Figure 8). On the other hand, it is difficult to believe that X grains from Qingzhen have different V/Ti ratios than X grains from Murchison. This issue still needs further exploration.
Figure 11. Depth profiles of ion signals (running averages over ten analyses) in grain 4A-461-5. Similar to grain 4A-134-9, the variation in the Ti signals indicates the presence of Ti-rich subgrains. This grain has normal Ti isotopic ratios. Vanadium appears to have the same spatial distribution as Ti, markedly different from that of Ca.
Download figure:
Standard image High-resolution image4. DISCUSSION
Our measurements of X grains from Qingzhen show high inferred 26Al/27Al and 44Ti/48Ti ratios, in agreement with previous analyses of X grains from other meteorites (see references cited in the previous section). They also reveal large excesses in 49Ti, possibly from the decay of short-lived 49V (Hoppe & Besmehn 2002). The isotopic properties of X grains and their stellar origin have been discussed previously (see section on Type X Grains in Zinner 2007, and references therein) and we do not want to repeat that discussion. Here we first discuss the possible radiogenic origin of 49Ti excesses and then concentrate of the different classes (X0, X1, and X2) of SiC X grains and the question whether or not differences of other isotopic systems can be found among these classes.
4.1. Initial Presence of Short-lived 49V?
Hoppe & Besmehn (2002) argued for a radiogenic origin of the 49Ti excesses observed in X grains from the decay of 49V on the basis of a correlation between 49Ti excesses and the 51V/48Ti ratio (see Figure 8 and the discussion in the previous section). Travaglio et al. (1999) also argued for the initial presence of 49V in low-density graphite grains, which are believed to have a SN origin. That 49V is present during grain formation is expected because 49V is produced in the Si/S zone, which is rich in 28Si and where also 44Ti is produced (Woosley & Weaver 1995; Timmes et al. 1996; Rauscher et al. 2002, see Figures 12(a)–12(c)). On the other hand, a strict correlation between 49Ti excesses and 51V/48Ti would correspond to a constant 49V/51V ratio, which should not be expected. First, even if all 49Ti excesses are indeed of radiogenic origin, the final 49V/51V ratio depends on how much 49V from the Si/S (and possibly the O/Si zone, see Figures 12(b) and 12(c)) is mixed into C-rich regions. Furthermore, the 49V abundance is not constant in these interior SN regions (Figures 12(a)–12(c)). We want to point out that in Figures 12(a)–12(c) and in later figures showing theoretical SN predictions, stable isotopes are shown after the decay of short-lived precursors. For example, 48Ti is taken after the decay of 48Cr and 48V, 49Ti after the decay of 49V, and 51V after the decay of 51Cr. The radionuclides 48V and 51Cr have short enough half-lives (16 and 28 d, respectively) that they most likely decayed before grain formation. In contrast, 49V has a half-life of 336 d, and a substantial fraction probably condensed into SiC grains as 49V. Thus, elemental fractionation between V and Ti potentially may play a role. Finally, the inferred 44Ti/48Ti ratios in X grains vary over a wide range and are roughly correlated with the 29Si/28Si ratios (Figure 6(b)). In order to see whether this is the case also for 49V/51V, we plot this ratio, calculated under the assumption that the whole 49Ti excess is of radiogenic origin, against the 29Si/28Si ratio (Figure 13). In contrast to the 44Ti/48Ti ratio, the 49V/51V ratio in the grains does not show any obvious correlation with 29Si/28Si, nor is this ratio systematically higher in X2 grains. However, we note that the 44Ti/48Ti versus 29Si/28Si correlation mainly depends on X2 grains with δ29Si/28Si < −500‰, whereas there are only two 49V/51V data points with such δ29Si/28Si values, one with a large error (Figure 13).
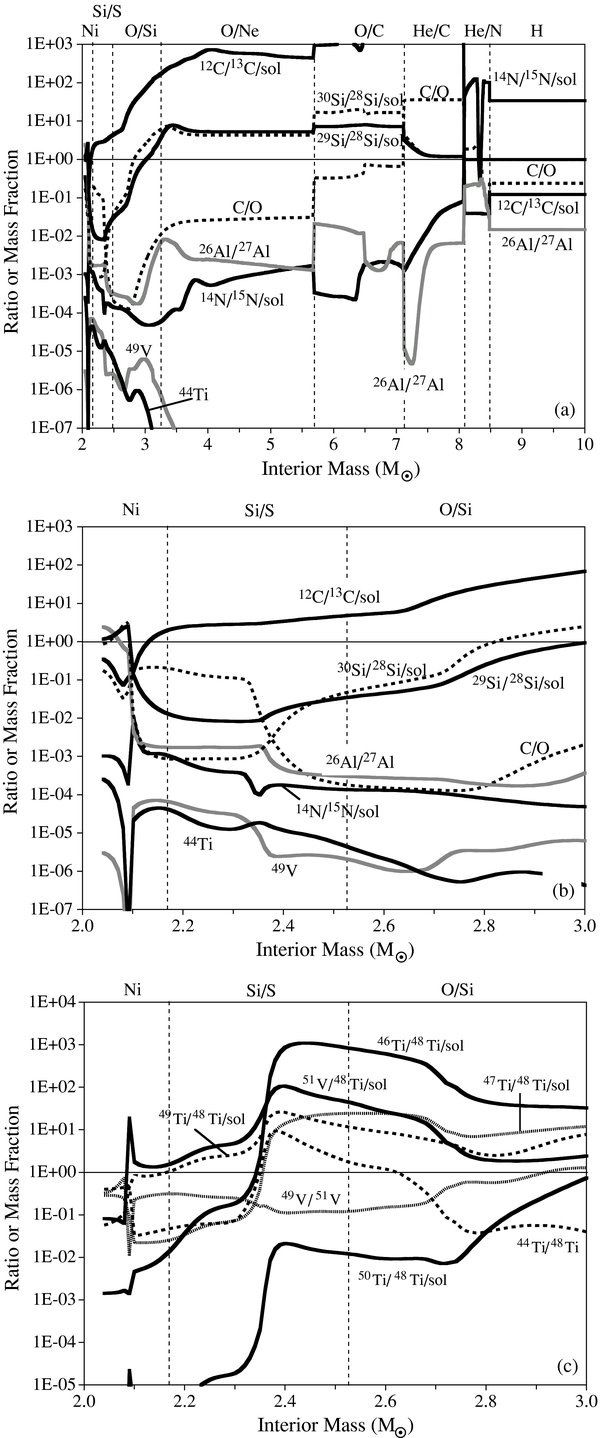
Figure 12. Theoretical predictions of isotopic ratios and isotopic abundances from the 25 M☉ SN model by Rauscher et al. (2002). The isotopic ratios of C, N, Si, Ti, and V are normalized to the solar ratios. C/O > 1, believed to be required for SiC condensation, is found in the He/C zone and the inner part of the He/N zone (panel (a)). The short-lived radioisotopes 44Ti and 49V are produced in the interior zones (panels (b) and (c)). The isotopic ratios, specifically the Ti ratios in panel (c), are obtained after the decay of the short-lived nuclides such as 48,51Cr and 48,49V, except where 44Ti and 49V are plotted.
Download figure:
Standard image High-resolution image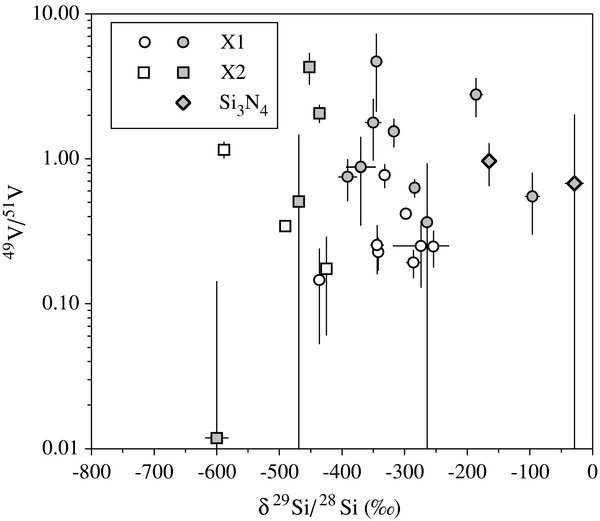
Figure 13. Inferred initial 49V/51V ratios of different subtypes of X grains as a function of the 29Si/28Si ratio.
Download figure:
Standard image High-resolution imageThis difference between 44Ti and 49V is also shown in Figure 14(a), where we plot the 49V/51V ratio versus the 44Ti/48Ti ratio. Unfortunately, data on both these ratios are limited. Although the lack of correlation between these ratios is not unexpected because their relative abundances vary throughout the inner zones (Figure 12(c)), the relative abundances in the grains (Figure 10(b)) cannot easily be explained. In Figure 14(a), we also show as small diamonds both ratios predicted for the layers between 2.05 and 3.0 M☉ interior mass of the 25 M☉ SN model by Rauscher et al. (2002, henceforth RAU). Because in these layers C ≪ O, mixing with C-rich material is required and the diamonds should be taken only as reference points. Thus, in addition, we show lines representing isotopic ratios obtained by mixing various layers from the Ni, Si/S, and O/Si zones (indicated by the interior mass) with a mix of material from the He/N and He/C zones. The mixing is between layers at 7.6 M☉ (He/C zone) and 8.2 M☉ (He/N zone), and we have chosen a mix that gives 12C/13C = 100. Such a mix has a δ49Ti/48Ti value of 522‰. Taking a more interior layer from the He/C zone or choosing a higher 12C/13C ratio would have resulted in an even higher δ49Ti/48Ti value. The mixing lines in Figure 14(a) are only for material with C > O. The two lines with material at 2.05 and 2.8 M☉ are not realistic, because these layers do not have large 28Si excesses (see Figure 12(b)). It is seen in Figure 14(a) that most of our data points fall above the mixing lines. This would indicate that not all the 49Ti excesses measured in the grains are due to the decay of 49V, as was assumed for determining the 49V/51V ratios of the grains plotted in Figures 13 and 14(a). In Figure 14(a), we have also indicated, by gray data points (and arrows), the inferred 49V/41V ratios of our Qingzhen grains if the 51V/48Ti ratio of the grains were solar (0.16) instead of the much lower ratios we measured. This moves our data points closer to the mixing curves, although three points are still removed from the curves by at least a factor of 3. Grain 5A-117-3, with the highest inferred 44Ti/48Ti ratio, has already a close-to-solar 51V/48Ti ratio and its 49V/41V ratio does not change much.

Download figure:
Standard image High-resolution image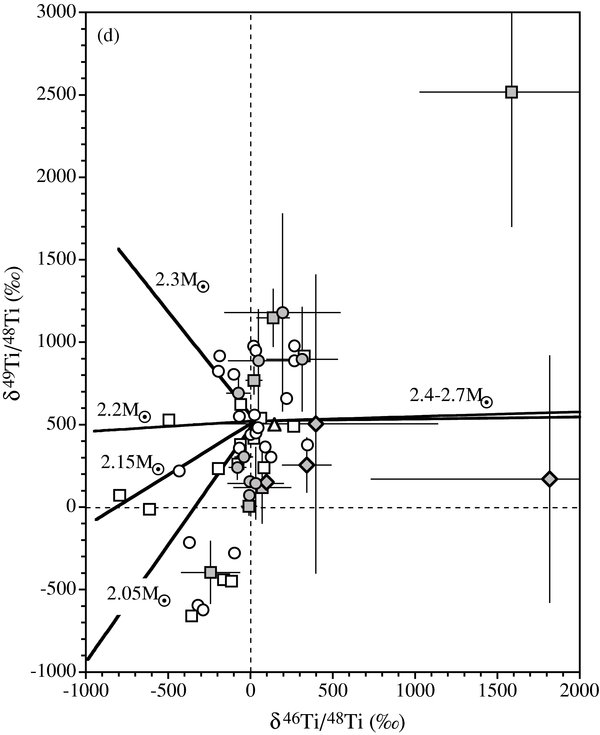
Figure 14. Inferred initial 49V/51V ratios and δ46,49Ti/48Ti values of different subtypes of X grains are plotted as a function of the inferred 44Ti/48Ti ratio and compared with theoretical predictions for the 25 M☉ RAU SN model. The diamonds in panel (a) are the ratios in various layers of the zones containing most of the 44Ti and 49V (see Figure 12(b)). The lines are predictions for the ratios if material from different layers of the Ni, Si/S, and O/Si zones is mixed with a mixture from the He/N and He/C zones. Only mixtures with C/O > 1 are plotted. The numbers next to the data symbols in panel (b) are the 12C/13C ratios for these grains. See the text for details.
Download figure:
Standard image High-resolution imageHowever, the suspicion that 49V-decay does not account for all the 49Ti excesses measured in the grains is supported by other observations. The He/C zone has large excesses in 49Ti from neutron capture. In the 25 M☉ RAU SN model, the 49Ti excess varies from 1530‰ to 127,700‰ as one traverses the He/C zone from the outside to the inside. In order to explain the C and N isotopic ratios of X grains, material from the He/C zone (where 12C/13C ratios are high and 14N/15N ratios low) has to be mixed with the He/N zone (where the 26Al/27Al ratios are highest). Material from the He/C zones is also needed to explain the Fe and Ni isotopic ratios measured in X grains (Marhas et al. 2008). We have already pointed out that the He/N–He/C mix used for Figure 14(a) has a δ49Ti/48Ti value of 522‰. In Figure 14(b), we plot the 49Ti/48Ti ratios of the grains against their inferred 44Ti/48Ti ratios together with mixing curves obtained after mixing with layers from the Ni, Si/S, and O/Si zones as we did in Figure 14(a). It can be seen that for almost half the grains the 49Ti excesses can be accounted for by neutron capture in the He/C zone and we do not need any contributions from 49V decay. Our He/N–He/C mix has 12C/13C = 100. Increasing this ratio requires admixture of more material from the He/C zone and results in higher 49Ti/48Ti ratios. For example, a He/N–He/C mix with 12C/13C = 400 has a δ49Ti/48Ti value of 1039‰. In Figure 14(b), next to the data symbols, we show the 12C/13C ratios of the grains. Many of them are much higher than 100, implying higher δ49Ti/48Ti values for the He/N–He/C mix. Thus, only for a couple of grains do we seem to need a 49V contribution. We thus conclude that the 49Ti excesses in X grains must have contributions from both, admixture of material from the He/C zone and decay of 49V from the interior zones. We note that, in contrast to 49Ti, 44Ca is not enhanced in the He/C zone relative to the He/N zone (RAU), thus, admixture of material from the He/C zone does not result in 44Ca excesses. This makes it likely that 44Ca excesses are due to 44Ti decay, even when, as in our case, we do not have information on the other Ca isotopic ratios.
We can obtain more information about admixture from the inner SN zones from the Ti isotopic ratios of the grains. Figure 14(b) shows that the largest increase in the 49Ti/48Ti ratio comes from admixture from the Si/S layer at 2.4 M☉ interior mass because there the relative contribution from 49V, i.e., the 49Ti/48Ti ratio after 49V decay, is highest (see Figure 12(c)). However, the outer layer of the Si/S zone is extremely 46Ti-rich with very high 46Ti/48Ti ratios. In Figure 14(c), we plot 46Ti/48Ti and 44Ti/48Ti ratios of grains and SN mixing curves. It is apparent that any admixture from the outer Si/S and inner O/Si zones from layers with ≥2.4 M☉ interior mass results in very large 46Ti excesses. The lack of such excesses in the grains indicates that not much material for the outer Si/S and the inner O/Si zones has been in the mixture from which X grains condensed. A similar conclusion has been reached from the lack of large 54Fe excesses in X grains (Marhas et al. 2008). Figures 14(c) and (d) show that some grains have 46Ti deficits and a few also have 49Ti deficits. These signatures so far have received only scarce attention. Deficits in 46Ti can be explained by admixture of material from the inner Si/S zone (see Figure 12(c)), but 49Ti depletions are more difficult to explain. The layer at 2.05 M☉ interior mass is very much depleted in 49Ti and its admixture results in negative δ49Ti/48Ti values (Figure 14(c)). However, as already mentioned, this layer has no 28Si excess and low Si abundance. The layer at 2.15 M☉ interior mass has 28Si excesses, but its δ49Ti/48Ti value is only −110‰ and larger 49Ti deficits cannot be explained this way.
4.2. Distinctions Between the Different Subtypes of X Grains
Many isotopic signatures of X grains point to an origin in Type II SNe. However, in order to explain these signatures one has to take material from different zones. In Figure 12, we plot various isotopic ratios and abundances predicted for a 25 M☉ RAU SN model. Silicon-28 excesses (in the figure shown as 29Si/28Si and 30Si/28Si ratios smaller than the solar ratios), as well as 44Ti and 49V are found in the Si/S and O/Si zones, high 12C/13C and low 14N/15N ratios relative to solar in the He/C zone (which also is C-rich, i.e., C/O > 1), and high 26Al/27Al ratios in the He/N zone (part of which is also C-rich). We also plot the C/O ratio because equilibrium condensation of SiC requires a C-rich gas where C > O (Lodders & Fegley 1995, 1997). Yoshida & Hashimoto (2004) have tried to reproduce the isotopic ratios of individual X grains through multizone mixing models. We shall not attempt to do so but compare the distributions of selected isotopic ratios and correlations between them with theoretical SN models, similar to the approach used by Travaglio et al. (1999), somewhat analogous to population synthesis in astronomy. We shall not even consider all isotopic data but concentrate on those that show differences for the different subtypes of X grains.
4.2.1. Silicon, C, N, and Al Isotopes
We start with a comparison of the Si isotopic compositions of X grains with the predictions of the SN models for three different masses of RAU in Figure 15. The figure shows only the region of the grain data; there are some very 29Si- and 30Si-rich compositions in the O/Ne and O/C zones (see Figure 12(b)) that plot outside of the displayed region. It is obvious from Figure 15 that the Si isotopic ratios of most X grains, in particular X1 grains, cannot be reproduced by the SN models. Mixing between material of isotopically normal Si with 28Si-rich material from the Si/S and O/Si zones can reproduce the compositions of only those grains that plot on or below the broken line. This line is a mixing line between pure 28Si (δ29,30Si/28Si = −1000‰) and isotopically normal Si (δ29,30Si/28Si = 0). To explain the ratios of most of the X1 grains requires a component with a composition close to the star in Figure 15. This would be a component with a 29Si/28Si ratio of ∼0.024 (the solar ratio is 0.051) and essentially no 30Si. No SN model to date has produced such a composition in a given layer. The existence and abundance of X1 grains indicate that SNe must produce more 29Si than the models can account for. Timmes & Clayton (1996) have pointed out that SN models produce approximately equal amounts of 29Si and 30Si and cannot account for the solar 29Si/30Si ratio of 1.51. While the solar ratio is the result of contributions from many stellar sources, the remarkable correlation of the Si ratios in X1 grains imposes a fairly tight constraint: it means that the proposed hypothetical component (the star in Figure 15) must be well represented in different SNe.

Figure 15. Silicon isotopic ratios of SiC X grains are plotted together with predictions from the 15, 20, and 25 M☉ SN models by RAU. The oblique gray solid line is the correlation line for X1 grains, the oblique broken line a mixing line between Si of solar isotopic composition with pure 28Si. The star indicates a hypothetical isotopic composition whose mixing with solar Si would explain the isotopic ratios of X1 grains. The two black solid lines are mixing lines between material from the O/Ne zone at 2.5 M☉ interior mass and the Si/S zone at 1.87 M☉ interior mass for the 15 M☉ Rauscher model. For one line, the 29Si yield in the O/Ne zone has been increased by a factor of 2 (Hoppe et al. 2009). The large open circles indicate Si isotopic compositions that, if mixed with normal Si, would reproduce the trend of the X1 grains. The large open squares are compositions obtained if the mixing ratio between Si/S and O/Ne material is only half of that for the open circles.
Download figure:
Standard image High-resolution imageSo far we have considered only binary mixing. Hoppe et al. (2009) reported a SiC grain with a large 29Si excess (δ29Si/28Si = 634‰) and 30Si deficit (δ30Si/28Si = −177‰). The authors explain these isotopic ratios by taking the 15 M☉ RAU SN model and assuming that the 29Si yield in the O/Ne and O/Si zones is twice that of the model because of a proposed increase in the 26Mg(α,n)29Si reaction rate. In the 15 M☉ SN model the solar-normalized excess of 29Si over 30Si is more pronounced than in the 25 M☉ SN model (Figure 12(b)). Doubling the 29Si yield gives a Si isotopic composition that plots in the right upper quadrant of Figure 15 but outside of the limits of the figure, with a much higher δ29Si/28Si than δ30Si/28Si value. Mixing of this material with essentially pure 28Si can reproduce the Si isotopic ratios of that particular grain. However, such a scenario cannot reproduce the correlated array of the X1 grains. In a three-isotope plot such as in Figure 15, any isotopic composition can be obtained by mixing of three components as long as the composition in question lies within the triangle spanned by the three components. Thus, in principle, the isotopic ratios of the X1 grains can be reproduced by mixing of essentially pure 28Si from the Si/S zone, the 29Si-rich component from the O/Ne zone of a 15 M☉ SN model considered by Hoppe et al. (2009), and a component from the O/C zone where δ30Si/28Si > δ29Si/28Si (see Figure 12(a)).
The question is why such a mix would produce the tight trend shown by the X1 grains and not a wide distribution of ratios. To demonstrate that in Figure 15 we show two mixing curves between material from the 2.5 M☉ interior mass layer of the O/Ne zone from the 15 M☉ RAU SN model and the Si/S zone, one with a twofold increase in the 29Si yield in the O/Ne zone and the other without it. The large open circles in the figure indicate compositions that, when mixed with isotopically normal Si would reproduce the correlation line for the X1 grains. However, it is not clear what is so magic about these particular mixing ratios between the O/Ne and Si/S zones. For example, if we add only half as much Si/S material to O/Ne material, we obtain Si isotopic ratios depicted by the large open squares in Figure 15. In this case, we would completely miss the X1 grain compositions. Another consideration that makes such an explanation for the X1 trend unlikely is the following. The O/Si layer lying between the Si/S and O/Ne zones has a large 30Si excess relative to the 29Si excess (see Figure 3 of Hoppe et al. 2009). In addition, the Si abundance of the O/Si zone is at least an order of magnitude higher than that of the O/Ne zone. Contributions from this zone would shift the O/Ne compositions in Figure 15 to compositions with higher 30Si/29Si ratios, i.e., to the right in the plot. In summary, while, yes, the Si isotopic ratios of the X1 grains can be obtained by mixing of three components, it requires a lot of ad hoc fine tuning to reproduce the trend shown by the X1 grains. We consider such an explanation as extremely unlikely and unsatisfactory and are still hoping that future SN models will produce a primary composition close to the star or the open circles in Figure 15.
In order to circumvent the problem of mixing between distant SN zones, Deneault et al. (2003) proposed formation of SiC X grains in a SN region where the Si abundance is at least 10 times the C abundance. In the 25 M☉ SN model they considered the region between 2.7 and 3.2 M☉ interior mass. One problem with this proposal is that this region is extremely rich in oxygen (O/C ratios are >100; see Figure 12(a)). Ebel & Grossman (2001) have raised doubts that SiC can condense from a gas with O > C even if C and O are not bound into CO, an assumption made by Deneault et al. (2003). In addition, the predicted isotopic ratios of SiC formed in this region do not agree with those measured in the grains. The predicted Si isotopic ratios (those in Figure 15 without any mixing with normal Si) are now missing those of all the grains, even those of the X2 grains. The situation is even worse if we consider the Si and C isotopic compositions together. Figure 16 shows plots of the Si versus the C isotopic ratios of X grains. There is a certain correlation between those ratios in the sense that there is a cutoff above which only very few grains plot. Nittler & Alexander (2003) have noticed such a cutoff for δ29Si/28Si and 12C/13C also for mainstream, Y, and Z grains, believed to come from AGB stars and that this cutoff extends to lower 12C/13C and higher δ29Si/28Si values. Figure 16(a) shows that most X2 grains plot below the X1 grains, i.e., have smaller 29Si/28Si ratios, as is clear from the Si three-isotope plot (Figure 2). The fraction of grains with 12C/13C > 1000 depends on subtype. It is 33%, 5.4%, and 20% for X0, X1, and X2 grains, respectively. This is also reflected in the averages for the 12C/13C ratio, which are 1113, 304, and 665 for the three subtypes. In Figure 16, we also plot the C and Si isotopic ratios in the Si/S and O/Si zones of three RAU SN models. The predicted ratios miss most of the grains and instead of the overall negative slope of the correlations shown by the grains, the theoretical curves have positive slopes. The situation is also untenable concerning the N isotopic ratios in the Si/S and O/Si zones. In Figure 12(a), it can be seen that the 14N/15N ratio is at least a factor of 1000 below solar, i.e., smaller than 0.3. However, almost all X grains have 14N/15N ratios between 10 and 100 (Figure 17(a)).
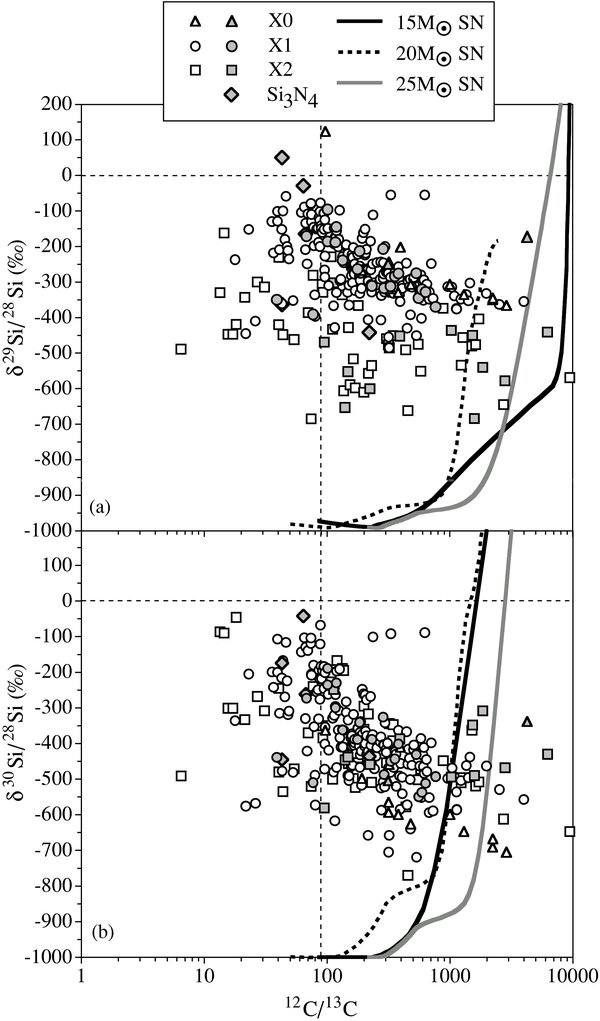
Figure 16. Silicon isotopic ratios of X grains are plotted vs. their 12C/13C ratios. Also plotted are the ratios predicted for the Si/S and O/Si zones of the 15, 20, and 25 M☉ SN models by RAU.
Download figure:
Standard image High-resolution image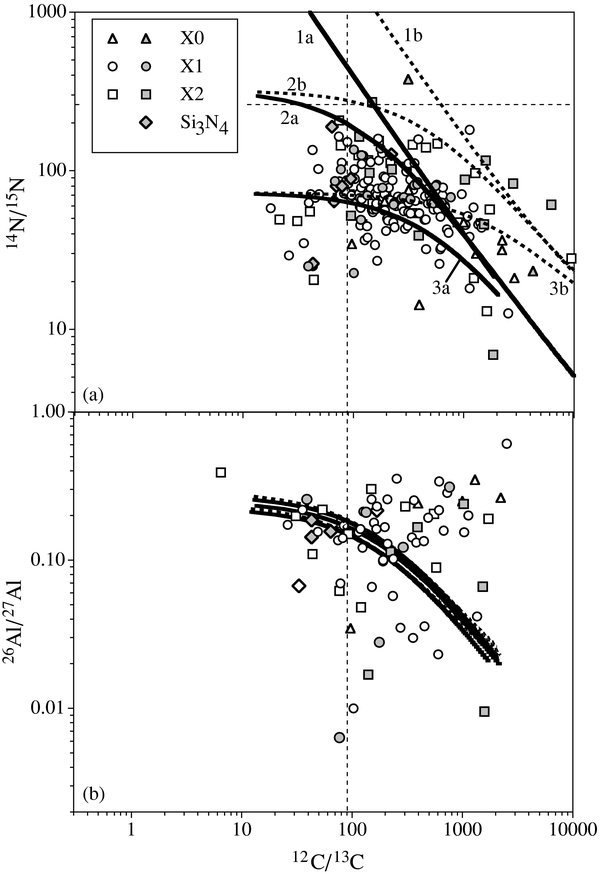
Figure 17. 14N/15N (panel (a)) and inferred initial 26Al/27Al (panel (b)) ratios of X grains are plotted against their 12C/13C ratios. The lines are predicted isotopic ratios obtained by mixing two layers form the He/C zones (Mix a and b) with three layers (Mix 1, 2, and 3) of the He/N zones of the 25 M☉ SN model by RAU. See the text for details.
Download figure:
Standard image High-resolution imageWe conclude that we have to mix material from the Si/S zone to material from the He/C and He/N zones (and possibly the H zone) in order to even approximately reproduce the isotopic signatures of the X grains and to achieve C > O. We say approximately, because all observed correlations cannot be reproduced in detail. We have already pointed out that the Si isotopic ratios of the X1 grains cannot be explained by existing SN models without making unlikely ad hoc mixing assumptions, because no model produces a primary composition close to the star symbol in Figure 15. In order to reproduce the range of 12C/13C ratios observed in X grains, mixing between the He/C and He/N zones is required. In the first of these zones, He burning produces 12C, resulting in very high 12C/13C ratios, and in the second, H burning in the CNO cycle results in a 12C/13C ratio of ∼3.5. Figure 17 shows the grains' C, N, and Al isotopic data and ratios produced if we add He/C-zone material to He/N-zone material with variable mixing ratios in the 25 M☉ RAU SN model. Mixes labeled a take material from the He/C layer at 7.24 M☉ interior mass, just outside of the boundary with the O/C zone (see Figure 12(b)); mixes labeled b take material from 7.6 M☉ interior mass. The first layer has a large 15N excess, i.e., a low 14N/15N ratio, and large 29Si, 30Si, and 49Ti excesses, but in the second layer, these excesses are more moderate (see Figure 12(b); the Ti isotopic ratios are not shown there). In the He/N zone, we chose three different layers: the first is at 8.2 M☉ interior mass, the second from the 15N-rich spike at 8.33 M☉ interior mass, the third the average of 20% of the He/N zone centered on the layer at 8.33 M☉ interior mass.
As can be seen in Figure 17(a), mixing of these combinations covers most of the C and N grain data fairly well. The He/C zone is 12C- and 15N-rich, with 14N/15N ratios decreasing as one traverses the zone from the outer to the inner boundary (Figure 12(b)). Thus, admixture of He/C material increases the 12C/13C ratio and decreases the 14N/15N ratio (Figure 17(a)). The N–C diagram shows that the sense of the correlation (a negative slope) shown by the grain data is reproduced by the mixing model, but reveals already some of the problems. In order to cover the isotopic ratios of most grains, we have to start with a low 14N/15N ratio in the He/N zone as represented by the 15N-rich spike. However, if we take the average of 20% of the zone centered on this spike (Mix 3), we miss most of the data points, even more so if we would take the average of the whole He/N zone. In addition, we have to admix material from a layer at the bottom of the He/C zone (Mix a), otherwise we also miss most of the data points. In other words, we have to make very special, ad hoc, assumptions in order to reproduce the C–N data. An additional puzzle is that the 15N-rich spike in the He/N zone that shows up in the RAU 25 M☉ SN model does not appear in their 15 M☉ and 20 M☉ models, nor in any of the Woosley & Weaver (1995) SN models and the models by Limongi and Chieffi (2003; 2009). As a matter of fact, the 15 M☉ and 20 M☉ models by the latter authors do not produce any 15N excesses in the He/C zone, and in more interior zones the N abundances are so low that they cannot affect the N isotopic compositions of the grains. We defer a more detailed study of this problem to the future.
In the C–N plot (Figure 17(a)), X2 grains with 12C/13C ratios above 300 have, on average, higher 14N/15N ratios than X0 and X1 grains. This is a puzzle, because the C and N isotopic ratios of the grains are dominated by contributions from the outer zones whereas the Si isotopic compositions need contributions from the Si/S and O/Si zones to explain the 28Si excesses in X grains. However, these inner zones have negligible contents of C and N. It is not clear why C–N and Si isotopic ratios should be correlated. Considering different mass models does not help us as long as none of the existing models can explain the Si isotopic ratios of most of the X grains (specifically the X1 grains) in a satisfactory fashion.
There are more problems with the He/N–He/C mixing models. Figure 17(b) shows the results of the mixing for the 26Al/27Al and 12C/13C ratios. Because 26Al/27Al ratios are very similar in the He/N layers selected for our mixing exercise and much lower in the He/C zone (see Figure 12(b)), the different mixing curves are very close to one another. Unfortunately, they not only miss most of the data points, the general trend in the grain data, i.e., increasing 26Al/27Al ratios with increasing 12C/13C ratios, is not reflected in the negative slope of the mixing models. Small inferred 26Al/27Al ratios might be the result of contamination with Al from adjacent Al-rich grains during the ion probe analysis, but the high 26Al/27Al ratios combined with high 12C/13C ratios shown by many grains clearly disagree with the mixing models. The 26Al/27Al ratio in the outer He/N zone decreases toward the H-rich envelope (Figure 12(a)), thus a component from this part or the average over the whole He/N zone would have resulted in lower mixing curves in Figure 17(b). In all existing SN models, the He/N zone is the only place where the predicted 26Al/27Al ratio approaches the ratios observed in X grains and where there is enough Al to affect the compositions of the grains. In all other zones, except the inner Ni zone (at 2.05 M☉ inner mass in the 25 M☉ RAU SN model), this ratio is much smaller (Figure 12(b)). However, as mentioned previously, this layer does have larger-than-solar 29,30Si/28Si ratios and the Al concentration is too low to make any significant contribution to the grains. As a result of H burning in the CNO cycle, the 12C/13C in the He/N zone is very low (3.5). In order to obtain the high 12C/13C ratios observed in the grains, one has to admix material from the He/C zone, in the process lowering the 26Al/27Al ratio. This is a long-recognized problem. In addition, for Mix 1a that gives 12C/13C = 390 and 14N/15N = 100 we obtain δ49Ti/48Ti = 6375‰, a value much higher than any that has been measured in an X grain (see Figure 7). For this case the C/O ratio is 17 and the C/Si ratio is 30. Such a high ratio would favor the condensation of graphite over SiC (Lodders & Fegley 1997). The bottom of the He/C zone is enriched in 29Si and 30Si (see Figure 12(b)) and Mix 1a with the above C and N isotopic ratios has δ29Si/28Si = 800‰ and δ30Si/28Si = 1,100‰.
Figure 18 shows the Si isotopic ratios resulting from mixing the above described Mix 1a (12C/13C = 390) with different layers from the Si/S and O/Si zones (see Figure 12(a)). All the compositions obtained from mixing with layers from 2.3 M☉ to 2.7 M☉ interior mass lie on lines between the Mix 1a composition of δ29Si/28Si = 800‰ and δ30Si/28Si = 1100‰ and the origin (pure 28Si). Since the O abundance of the layers in these zones increases as we move outward, the O/C ratio becomes greater than unity at some mixing ratio. In Figure 18, we indicated the Si isotopic compositions where this is the case for mixing with layers at 2.5, 2.6, and 2.7 M☉ interior mass. Only at the 2.8 M☉ layer is the Si isotopic composition sufficiently 30Si-rich (see Figure 12(a)) that we move substantially away from the other mixing lines. While mixing with the Si/S and O/Si layers produces the whole range in the 29Si/28Si and 30Si/28Si ratios observed in X grains (although not with the correct relative relationship between them), the C isotopic ratio of the original He/N–He/C mix remains essentially constant. The reason is that the Si/S and O/Si zones contain so little C that admixture from these zones does not affect the C isotopic ratios. In Si versus C isotopic ratio plots such as those in Figure 16, these mixing lines would be vertical lines for different 12C/13C ratios resulting from the original He/N–He/C mix. In other words, the C and Si isotopic ratios are completely decoupled from one another and mixing cannot explain the general trend observed in the grains (Figure 16).
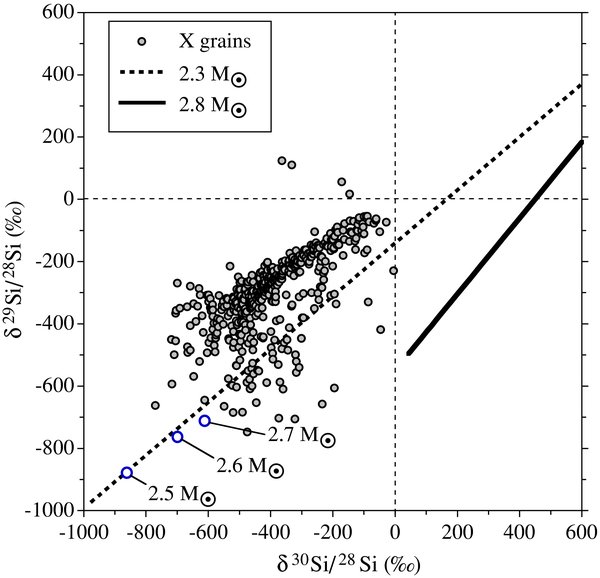
Figure 18. Silicon isotopic ratios of X grains and mixing lines between a mixture of the He/N and He/C zones (see the text) and material from different layers of the Si/S (2.3 M☉ interior mass) and O/Si zones (2.8 M☉). Only C-rich (C > O) final compositions are plotted. The open circles are the compositions where C/O = 1. The lines from these points are essentially the same as the 2.3 M☉ line, only truncated.
Download figure:
Standard image High-resolution imageA possible explanation for this trend and the upper cutoff in the plots of Figure 16 might be the following. As mentioned above, the C/O ratio of the Mix 1a composition considered here is very high, probably inhibiting SiC formation in favor of graphite. As material from the Si/S or O/Si zone is admixed to this composition, the 29,30Si/28Si ratios decrease whereas the 12C/13C ratio stays constant. However, in the case of admixture from the O/Si zone, O is added and the C/O ratio decreases. At some mixing ratio, the C/O ratio will approach unity, enabling the formation of SiC. This would explain the sharp upper cutoff in Figures 16(a) and (b), i.e., why for a given 12C/13C ratio there are no grains with 29,30Si/28Si ratios above some limiting values. In principle, it also explains the slope of the cutoff. For a higher 12C/13C ratio of the He/N–He/C mix, the C/O ratio will also be higher. This means that more material from the O/Si zone has to be admixed in order to lower the C/O ratio to close to unity, resulting in lower 29,30Si/28Si ratios. In practice, the situation is complicated. For example, if we mix He/N–He/C Mix 1a considered above (12C/13C = 390, 14N/15N = 100, δ29Si/28Si = 800‰, and δ30Si/28Si = 1,100‰) with material from the layer of interior mass 2.5 M☉, the δ29Si/28Si and δ30Si/28Si values reached when C/O = 1 are −885‰ and −864‰, respectively. These values are below essentially all the grain data at 12C/13C = 390 (Figure 16). If we move farther out in the O/Si zone, the δ29,30Si/28Si values become larger (−819‰ and −769‰ at interior mass 2.6 M☉, and −755‰ and −667‰ at interior mass 2.7 M☉). However, at interior mass 2.8 M☉, the values are −532‰ and +13‰. This behavior reflects the fact that δ30Si/28Si > δ29Si/28Si in the starting Mix 1a and also in the O/Si zone (Figure 12(a)). We can, of course, use different He/N–He/C mixes, giving different initial 29Si and 30Si excesses, but the basic fact that δ30Si/28Si will be larger than δ29Si/28Si is not going to change. The same behavior is obtained from the 15 M☉ and 20 M☉ models as well, another example that SN models cannot reproduce the grain data in all details. However, there is a fundamental problem with this scenario. As discussed previously in connection with the Ti isotopic ratios of the grains, any contributions from layers between 2.4 M☉ and 2.8 M☉ interior are predicted to result in large 46Ti excesses, which are not observed in the grains. Since Ti exists in Ti-rich subgrains (possibly TiC) within X grains (see Figures 9 and 11), these subgrains might have formed before SiC condensation in a different SN region. In this case, the Ti isotopic compositions of the grains would not necessarily have to be related to their Si isotopic compositions and the C/O ratio of the region where the grains formed. It is clear that fractionation between Ti and Si (and other elements) because of independent formation of TiC grains adds another layer of complexity to formation scenarios. We have to defer dealing with this possibility.
4.2.2. Titanium-44 and Si Isotopic Ratios
Besides the Si (Figures 1 and 2) and N (Figure 17) isotopic ratios, the inferred 44Ti/48Ti ratios show a clear distinction between Group X1 and X2 grains (Figure 6). 44Ti/48Ti ratios are higher in X2 grains than in X1 grains. A correlation between 44Ti/48Ti ratios and Si isotopic ratios is expected since the zones containing 44Ti are rich in 28Si (Figure 12(a)). However, such a correlation is observed only for the 29Si/28Si ratio (Figure 6(b)) and not for the 30Si/28Si ratio (Figure 6(c)). One thing is clear: to account for the initial presence of 44Ti in X grains, we have to mix material from the Si/S and/or O/Si zones with material from other zones needed to explain the C, N, and Al isotopic ratios of the grains.
In Figure 19, we show mixing curves obtained by mixing He/N–He/C Mix 1a (C/O = 16, 12C/13C = 390, 14N/15N = 100, δ29Si/28Si = 800‰, and δ30Si/28Si = 1,100‰) with material from different layers of the Ni, Si/S, and O/Si zones (see Figure 12(b)). As can be seen from the plots, while the sign of the correlation between the 44Ti/48Ti and 29Si/28Si ratios is reproduced by the mixing curves, and while the data for X1 grains can be accounted for by the SN model, most of the X2 grains plot above the curves. Although the 44Ti abundances are highest in the Ni zone (Figure 12(b)), the high 48Ti abundance there results in 44Ti/48Ti ratios that are lower than those in the outer Si/S and inner O/Si zones (Figure 12(c)). The ratio is highest in the layer at 2.4 M☉, and as a consequence the mixing curve with this layer reaches the highest 44Ti/48Ti ratio (Figure 19). However, the corresponding 29,30Si/28Si ratios are much lower than those measured in the grains. As in previous plots, mixing curves are shown only for mixtures with C > O. This explains why the curves for the 2.5, 2.6, and 2.8 M☉ layers terminate at increasing δ29,30Si/28Si values.
Figure 19. Inferred initial 44Ti/48Ti ratios of X grains are plotted against their Si isotopic ratios. The lines are obtained by mixing material from different layers of the Si/S and O/Si zones with a mixture between the He/N and He/C zones; the line labeled 2.05+2.2 M☉ combines contributions from the inner Ni zone with the Si/S zone (see the text).
Download figure:
Standard image High-resolution image
The layer at 2.05 M☉ interior mass does not have a 28Si excess and is low in Si (Figure 12(b)) and its admixture does not produce the Si isotopic ratios of the grains. However, if we combine contributions from this layer and layers above that carry 28Si, we can achieve higher 44Ti/48Ti ratios together with the range if Si isotopic ratios seen in X2 grains. For example, the curves labeled "2.05 + 2.2 M☉" in Figure 19 were obtained with 10% from the 2.05 M☉, 0.6%–3% from the 2.2 M☉ layer, and the remaining fraction from our He/N–He/C mix described above. This resulting mixture comes close to reproducing the ratios of most X2 grains, although it does not reach the highest measured ratios (44Ti/48Ti = 0.4 ratio at 2.05 M☉ interior mass). This confirms the conclusion of Hoppe et al. (1996) that contributions from the Ni core have to be included in order to explain the inferred 44Ti/48Ti of some of the grains.
For the mixing curves with the 2.15 and 2.2 M☉ layers and the 2.05+2.2 M☉ mixing curve, the high resulting C/O ratio, which essentially remains the same (16) as that of the He/N–He/C mix, might be a problem because it is not clear whether SiC can condense from a gas with such a high C/O ratio. However, we note that the Si/C ratios in the mixed material are fairly high, higher than the O/C ratio. For example, in the mix with the 2.05+2.2 M☉ layers, the Si/C ratio is 0.23 at δ29Si/28Si = −750‰. However, the Fe/Si and Fe/C ratios for this mix are 14 and 3.8, respectively. It remains to be seen whether SiC can condense under such conditions. A possibility is that the C-rich mix from the outer layers contains also some material from the O/C zone. The C content of this zone is high (actually much higher than that of the He/C zone; it is just that the O content is even higher) and the 12C/13C ratio is also extremely high (see Figure 12(a)). A proper mix might result in a moderate C/O ratio. A smaller C/O ratio would also help with the problem we had in reproducing the upper cutoff in the δ29,30Si/28Si versus 12C/13C ratio plots (Figure 16). With the high C/O ratios of our He/N–He/C mix, we ended up with much too low δ29,30Si/28Si values at C = O when we added material from the lower O/Si zone. If the material with a high 12C/13C ratio from the outer layers including the O/C zone has a smaller C/O ratio, we have to add less material from the O/Si zone and C = O is achieved at higher δ29,30Si/28Si values. However, the high Fe content, a consequence of admixture of Ni core material, might remain a problem. We want to emphasize that the composition of the gas from which X grains condensed is very different from a gas of close-to-solar compositions for which most condensation calculations are performed. The detailed exploration of all multizone mixing possibilities and that of grain condensation from the resulting gas is an extremely complicated problem, exceeding by far the scope of this paper.
5. REMARKS ON SUPERNOVA MODELS
In this paper, we have heavily relied on the SN models by Rauscher et al. (2002), concentrating on the 25 M☉ model. Among the three models used (15, 20, and 25 M☉), this model is the only one with a 15N spike in the He/N zone, which is needed to reproduce the C and N isotopic ratios of the grains. For all the other isotopic ratios investigated here, the three SN models lead to essentially the same basic conclusions. Rauscher et al. calculated also a series of models, most of which are listed on the web but not referred to in publications, with varying assumptions about the energy of the explosion, the amount of 56Ni in the core, and some reaction rates, mainly that of the 22Ne(α,n)25Mg reaction. We have not looked at the models in detail but used only the "best" models preferred by the authors.
We did look, however, at the 15, 20, and 25 M☉ models by Limongi & Chieffi (2003, 2009, hereafter L+C), graciously provided by these authors. These models seem to make it even more difficult to account for some of the grain data than the RAU models. We have already mentioned that the 15 and 20 M☉ L + C models do not have any 15N excesses in the He/C zone. The 25 M☉ model does not have a 15N-rich spike in the He/N zone and the 15N abundance is constant throughout the He/C zone. All these features make it more difficult to explain the 15N excesses in the X grains. Another difference is that in the L+C models 26Al/27Al ratios in the He/N zone are smaller than in the RAU models, missing the high ratios in grains even more than the RAU models. In contrast to the RAU models, the L+C models have C/O zones and admixture from these zones can explain the high 12C/13C ratios of most X grains. However, the C/O zones have high 14N/15N ratios and thus would not help with low 14N/15N ratios found in the grains (Figure 17). The Si/S and O/Si zones in the L + C models are narrower than in the RAU models and it might be more difficult to add the required amount of material. In most other aspects, the L + C are similar enough to the RAU models that we do not expect any fundamentally different conclusions.
We followed the suggestion of Hoppe et al. (2009) in increasing the 29Si yield from the O/Ne zone of the 15 M☉ RAU model. While it is clear that 29Si production in SNe have to be increased beyond what is predicted by models in order to produce the solar Si isotopic ratios (Timmes & Clayton 1996; Lugaro et al. 1999; Travaglio et al. 1999), we concluded that admixture from the O/Ne zone does not provide a satisfactory solution to the problem of the Si isotopic ratios of the X1 grains. However, in future efforts we might consider the grain data as a guide in exploring the consequences of alterations in various reaction rates and assumptions about convection in SN models with the goal to better reconcile theoretical predictions and laboratory data.
6. CONCLUSIONS
We performed isotopic measurements of C, N, Si, Al–Mg, Ca and Ti in SiC and Si3N4 grains of type X from the enstatite chondrite Qingzhen. X grains are believed to have formed in the ejecta of Type II SNe. The Si isotopic ratios of X grains indicate the presence of at least two subtypes, X1 and X2 (Lin et al. 2002). Mg, Ca, and Ti isotopic measurements were made to determine initial abundances of the short-lived radioisotopes 26Al, 44Ti, and 49V. The ultimate objective of this study was to see whether differences between X1 and X2 grains are also shown in other isotopic systems besides Si. We compared the isotopic compositions of the grains of this study and of previous studies by other investigators with theoretical model predictions for Type II SNe by RAU.
From the grain data and the SN models we arrive at the following conclusions.
- 1.No existing SN models can explain the Si isotopic compositions of most X grains, especially the X1 grains, without invoking very special, highly unlikely mixing conditions, which we find ad hoc and extremely unsatisfactory. To do so in a simple way, the models would have to produce a primary component in which 28Si is accompanied by 29Si with a ratio 29Si/28Si ∼ 0.024 and this component must be ubiquitous among different SNe.
- 2.The C and N isotopic ratios of X grains contradict the model by Deneault et al. (2003), which proposes that these grains condense directly from layers in the lower O/Si zone, invalidating this model. Material from the He/N and He/C zone is needed to explain the C, N, and Al isotopic ratios of the grains.
- 3.However, the He/N–He/C mix fails to reproduce the grain data in detail. The N and C isotopic data can be fairly well matched as long as the 15N spike in the He/N zone predicted for the 25 M☉ SN model by RAU is included in some of the mixes. This issue needs further exploration. The fact that X2 grains have higher N isotopic ratios than X1 grains remains unexplained. The SN models fail to account for the inferred 26Al/27Al ratios in connection with the 12C/13C ratios of the grains. Because the He/N zone has low 12C/13C and high 26Al/27Al ratios, whereas the He/C zone has high 12C/13C and low 26Al/27Al ratios, mixing produces a negative correlation between these two ratios, which is not shown by the grain data.
- 4.The 49Ti excesses found in X grains can be explained as the result of the decay of short-lived 49V only in some grains. In other grains, they must be due to contributions from the He/C zone where 49Ti excesses are produced by neutron capture. The lack of large 46Ti excesses indicates that only limited amounts from the outer Si/S and inner O/Si contributed to the mix from which X grains formed.
- 5.Inferred 44Ti/48Ti ratios are highest in X2 grains and can be reproduced by SN mixing models only if substantial contributions from the inner Ni core are taken into account. These contributions result in high Fe abundances and it is still not clear whether SiC can condense from this type of mixture. The ratios seen in the rest of the grains can be reproduced by mixing with material from the Si/S and the inner region of the O/Si zone.
In summary, as remarked by others before, SN models fail to account in detail for many of the isotopic compositions of X grains. The most glaring problems are the Si isotopic compositions themselves, the fact that most grains, the X1 grains, need a primary component with 29Si, and the high 26Al/27Al ratios in grains with high 12C/13C ratios (and low 14N/15N ratios). We can only hope that the grain data will guide stellar modelers to look for ways to overcome these problems with the models. There are other issues that need to be explored. One is to find out what range of elemental compositions under the temperature and pressure conditions of SN ejecta will allow the condensation of SiC.
This work is supported by the knowledge innovation program of Chinese Academy of Sciences (kzcx2-yw-110), the Natural Science Foundation of China (40830421) and NASA (NNX08AG71G). We thank Alessandro Chieffi, Alexander Heger, and Marco Limongi for providing SN models. We gratefully acknowledge constructive reviews by Peter Hoppe and an anonymous reviewer.