


ABSTRACT
We present 24 μm and 70 μm Multiband Imaging Photometer for Spitzer (MIPS) observations of 70 A through M-type dwarfs with estimated ages from 8 Myr to 1.1 Gyr, as part of a Spitzer guaranteed time program, including a re-analysis of some previously published source photometry. Our sample is selected from stars with common youth indicators such as lithium abundance, X-ray activity, chromospheric activity, and rapid rotation. We compare our MIPS observations to empirically derived Ks–[24] colors as a function of the stellar effective temperature to identify 24 μm and 70 μm excesses. We place constraints or upper limits on dust temperatures and fractional infrared luminosities with a simple blackbody dust model. We confirm the previously published 70 μm excesses for HD 92945, HD 112429, and AU Mic, and provide updated flux density measurements for these sources. We present the discovery of 70 μm excesses for five stars: HD 7590, HD 10008, HD 59967, HD 73350, and HD 135599. HD 135599 is also a known Spitzer IRS (InfraRed Spectrograph) excess source, and we confirm the excess at 24 μm. We also present the detection of 24 μm excesses for 10 stars: HD 10008, GJ 3400A, HD 73350, HD 112429, HD 123998, HD 175742, AT Mic, BO Mic, HD 358623 and Gl 907.1. We find that large 70 μm excesses are less common around stars with effective temperatures of less than 5000 K (3.7+7.6−1.1%) than around stars with effective temperatures between 5000 K and 6000 K (21.4+9.5−5.7%), despite the cooler stars having a younger median age in our sample (12 Myr vs. 340 Myr). We find that the previously reported excess for TWA 13A at 70 μm is due to a nearby background galaxy, and the previously reported excess for HD 177724 is due to saturation of the near-infrared photometry used to predict the mid-infrared stellar flux contribution. In the Appendix, we present an updated analysis of dust grain removal timescales due to grain–grain collisions and radiation pressure, Poynting–Robertson (P–R) drag, stellar wind drag, and planet–dust dynamical interaction. We find that drag forces can be important for disk dynamics relative to grain–grain collisions for LIR/L* < 10−4, and that stellar wind drag is more important than P–R drag for K and M dwarfs, and possibly for young (<1 Gyr) G dwarfs as well.
Export citation and abstract BibTeX RIS
1. INTRODUCTION
Nearly 25 years ago, the Infrared Astronomical Satellite (IRAS) launched the study of infrared excesses around stars that we attribute to mature extra-solar planetary systems (e.g., Rhee et al. 2007; Zuckerman 2001; Fajardo-Acosta et al. 2000; Mannings & Barlow 1998; Backman & Paresce 1993; Walker & Wolstencroft 1988; Aumann et al. 1984). Parent bodies in a planetary system—∼1 m and larger aggregates of rock and ice analogous to asteroids and Kuiper Belt objects in our own solar system—collide and produce dusty debris that is heated by incident stellar radiation. This optically thin "debris disk" re-emits the absorbed radiation at infrared wavelengths; it is detected in excess of the expected stellar radiation around ∼15% of main-sequence stars (e.g., Lagrange et al. 2000). Ground-based infrared and submillimeter efforts (e.g., Lestrade et al. 2006; Liu et al. 2004; Weinberger et al. 2004; Song et al. 2002), the Infrared Space Observatory (ISO; de Muizon 2005; Laureijs et al. 2002; Habing et al. 2001; Spangler et al. 2001), and the Spitzer Space Telescope (Werner et al. 2004) have discovered >100 nearby stars with infrared excess. These discoveries include several dozen debris disks around young stars less massive than the Sun (e.g., Rebull et al. 2008; Meyer et al. 2007b; Smith et al. 2006; Low et al. 2005; Chen et al. 2005b). Large samples of these systems observed with the Spitzer Space Telescope are useful in determining overall trends such as disk frequency, disk infrared luminosity, and dust dynamics as a function of age or effective stellar temperature both in the field (e.g., Carpenter et al. 2009; Hillenbrand et al. 2008; Trilling et al. 2008; Wyatt 2008; Gautier et al. 2008; Wyatt 2007; Beichman et al. 2006a, 2006b; Bryden et al. 2006; Su et al. 2006; Rieke et al. 2005; Chen et al. 2005b) and in clusters and associations (e.g., Currie et al. 2009; Dahm & Carpenter 2009; Cieza et al. 2008; Currie et al. 2008b; Hernandez et al. 2008; Cieza & Baliber 2007; Currie et al. 2007; Dahm & Hillenbrand 2007; Gorlova et al. 2007; Hernandez et al. 2007a, 2007b; Carpenter et al. 2006; Chen et al. 2005a; Low et al. 2005; Stauffer et al. 2005; Gorlova et al. 2004). High-contrast, high-resolution direct and coronagraphic imaging from a number of telescopes has spatially resolved ∼15 debris disks around solar-type stars in scattered and/or thermal emission that show disk structures and clearings indicative of possible unseen planets (e.g., Fitzgerald et al. 2007; Telesco et al. 2005; Krist et al. 2005a, 2005b; Marsh et al. 2005; Kalas et al. 2004; Stapelfeldt et al. 2004; Holland et al. 2003; Wahhaj et al. 2003; Heap et al. 2000; Schneider et al. 1999; Jayawardhana et al. 1998; Koerner et al. 1998). The recent reported discoveries of Fomalhaut b (Kalas et al. 2008; Chiang et al. 2009) and a possible planet orbiting Beta Pic (Lagrange et al. 2009) support the hypothesis that planets can directly influence debris disk structure. Spatially resolved systems provide further information about the dust dynamics and evolution, but discerning overall trends is limited by the small number of resolved systems.
In parallel with infrared observations and high-contrast imaging of young stars, over 300 extrasolar planets have been discovered, primarily with the radial velocity technique, in the past decade, but also through direct imaging, transits, microlensing, and pulsar timing (Marois et al. 2008; Kalas et al. 2008; Butler 2006; Marcy et al. 2005; Bond et al. 2004; Beaulieu et al. 2006; Wolszczan & Frail 1992, and references therein). The synergy of these planet-finding methods with the study of debris disks can yield new insights into the overall circumstellar architecture of exoplanetary systems. For example, radial velocity discovered extrasolar planets have revealed trends such as the Jovian planet frequency—host star metallicity correlation (Gonzalez 1997). This correlation is not observed for debris disks (Beichman et al. 2006a).
Fundamental questions remain about the dust dynamics, properties, and evolution of debris disks around young stars. For example, the evolutionary timescales for both primordial and debris disks appear to be dependent on spectral type. Optically thick primordial disks are common (∼50%) at ages of ∼1 Myr around stars with spectral types of A through M (Haisch et al. 2001; Meyer et al. 1997). These primordial disks provide the material to form planets and parent bodies that in turn can generate secondary debris disks. In the 3–5 Myr Upper Sco association, Carpenter et al. (2006) observe that primordial disks continue to persist in an optically thick state around K and M dwarfs, but have already transitioned to optically thin disks around earlier type stars. It might follow that debris disks should similarly persist for longer around K and M dwarfs due to lower stellar luminosities and masses (Section A.2). Debris disks can persist for stars older than ∼1 Gyr around A, F, and G-type stars (Trilling et al. 2008; Meyer et al. 2007b; Su et al. 2006; Bryden et al. 2006; Rieke et al. 2005). However, for K and M stars older than ∼50 Myr, there is a relative paucity of stars known with infrared excess associated with debris disks (e.g., Rhee et al. 2007; Plavchan et al. 2005). Before Spitzer, selection effects from a flux-limited survey could partially account for this apparent difference in disk frequency and disk lifetime; debris disks around K and M dwarfs are thought to be relatively colder and fainter than around solar-type stars, due to the lower stellar luminosities (Rhee et al. 2007; Zuckerman 2001). Indeed, two colder debris disks have been reported around M dwarfs with submillimeter observations (Lestrade et al. 2006; Liu et al. 2004). More sensitive observations with the Spitzer Space Telescope and ground-based efforts continue to identify a relative lack of bright 70 μm excesses (F70/F* ≳ 2–10) around K and M stars older than ∼50 Myr (Trilling et al. 2008; Gautier et al. 2008; Beichman et al. 2006a). This paper addresses and confirms this dearth of relatively bright excesses at 70 μm around stars cooler than our Sun, but find that small (∼10%–15%) flux excesses at 24 μm are common at ages of <100 Myr. Forbrich et al. (2008) also identify nine new candidate M dwarf debris disks with large 24 μm excesses in the ∼40 Myr open cluster NGC 2547, perhaps probing the epoch of icy planet formation for M dwarfs (Currie et al. 2008b; Kenyon & Bromley 2008).
Large ensemble infrared studies of young stars remain a valuable probe to address remaining questions about the dynamics, properties, and evolution of debris disks. In this paper, we present the results of a Spitzer-guaranteed time program to search for debris disks. We have obtained MIPS 24 μm and 70 μm observations of 70 young, nearby A-M stars with ages ranging from 8 Myr to ∼1 Gyr. Preliminary results for a subset of these stars have been reported in Rebull et al. (2008); Chen et al. (2005b); Low et al. (2005). In Section 2, we present our sample and selection criteria. In Section 3 we present the observations and our data analysis procedures. In Section 4, we present our analysis to evaluate the significance of our detections and nondetections, and place constraints on the disk properties of observed stars with and without infrared excess. In Section 5, we present our results on stars with identified infrared excesses. In Section 6, we discuss individual stars with excess in our sample, and the transition from grain–grain collisions to drag-force-dominated disks. In Section 7, we present our conclusions. In the Appendix, we present an updated analysis of the different timescales for dust grain removal in debris disks from radiative forces, stellar wind forces, and grain–grain collisions. We also consider the importance of planet–dust interaction relative to these processes.
2. SAMPLE SELECTION
Our sample of 70 stars were selected as being relatively young based upon a variety of youth indicators. For F-M stars, selection criteria include high X-ray activity from ROSAT detections, high lithium abundance, Calcium II H&K line chromospheric activity, and rapid rotation (Gaidos 1998; Gaidos et al. 2000). For A stars, we select candidates based on inferred youth from Stroemgren photometry and distances inferred from Hipparcos parallaxes (Song et al. 2001; Song 2000; J. Stauffer 2000, private communication), with the exception of HD 123998 which was selected for its apparent IRAS excess (confirmed in this work to be a false-positive, potentially due to IRAS beam-confusion; Song 2000; Song et al. 2001). We select 27 stars with stellar effective temperatures less than 5000 K, 28 stars with stellar effective temperatures between 5000 K and 6000 K, and 15 stars with stellar effective temperatures greater than 6000 K. We use these subgroups within the sample throughout our analysis. The choice of 5000 K and 6000 K to delineate the subgroups is motivated by the different sample selection techniques applied in each temperature regime, the X-ray activity, and estimated ages (Section 4.4). The subsamples also highlight differences in our results between solar-type (5000–6000 K), low-mass (<5000 K) and high-mass radiative atmosphere stars (>6000 K). Many of the stars in our sample are members or candidate members of young moving groups and associations. In Table 1 we list our targets along with literature spectral types, distances, cluster and moving group memberships, and other youth indicators.
Table 1. Stellar Properties
| Stellar Rotation | ||||||||||
|---|---|---|---|---|---|---|---|---|---|---|
| Name | HD/Name 2 | Spectral Typea | Da (pc) | Associationb | ROSAT (cnts/sec) | Lithium Abundance log(N(Li)) (H = 12) | log(R'HK)c | vsin i (km s−1) | Period (days) | Referencesd |
| ⋅⋅⋅ | 1835e | G0 | 20 | HSC | 2.89E−01 | 2.58 ± 0.10 | −4.46 | 3.6 | 7.81 | 1, 1, 2, 1 |
| ⋅⋅⋅ | 7590 | G0 | 24 | ⋅⋅⋅ | 1.91E−01 | 2.75 ± 0.10 | −4.46 | 6.4 | 5.67 | 1 |
| BB Sclf,g | 9770 | G5 | 24 | ⋅⋅⋅ | 2.59E+00 | ⋅⋅⋅ | ⋅⋅⋅ | 2 | ⋅⋅⋅ | 3 |
| ⋅⋅⋅ | 10008 | G5 | 24 | LA | 1.44E−01 | 1.96 ± 0.12 | −4.38 | 2.9 | ⋅⋅⋅ | 1 |
| ⋅⋅⋅ | 11131 | G0 | 23 | ⋅⋅⋅ | 3.86E−01 | 2.42 ± 0.10 | −4.47 | 3.4 | 8.92 | 1, 1, 4, 1 |
| ⋅⋅⋅ | 15089f,g | A5p | 43 | ⋅⋅⋅ | 2.28E−01 | ⋅⋅⋅ | ⋅⋅⋅ | 49 | 1.74 | 5, 6, 7 |
| ⋅⋅⋅ | 16287h | K0 | 24 | ⋅⋅⋅ | ⋅⋅⋅ | 0.55 | −4.32 | 4.9 | ⋅⋅⋅ | 8 |
| ⋅⋅⋅ | 16555 | A5 | 44 | ⋅⋅⋅ | 3.20E−03 | ⋅⋅⋅ | ⋅⋅⋅ | 315 | ⋅⋅⋅ | 9, 7 |
| ⋅⋅⋅ | 17240f | F2 | 47 | ⋅⋅⋅ | ⋅⋅⋅ | ⋅⋅⋅ | ⋅⋅⋅ | 45 | ⋅⋅⋅ | 10, 11, 12 |
| DO Eri | 24712 | F0 | 49 | ⋅⋅⋅ | ⋅⋅⋅ | ⋅⋅⋅ | ⋅⋅⋅ | 18 | 12.46 | 5, 6, 11, 12 |
| v833 Taue | GJ 171.2 | K3i | 18 | ⋅⋅⋅ | 2.69E+00 | ⋅⋅⋅ | −4.057 | ⋅⋅⋅ | ⋅⋅⋅ | 13 |
| ⋅⋅⋅ | 29697 | K2 | 13 | UMG | 2.36E+00 | 0.754 | −4.1 | 9.5 | 4 | 14, 13, 15, 15 |
| Gl 182 | ⋅⋅⋅ | M0j | 27 | LA | 6.51E−01 | 1.8 | ⋅⋅⋅ | 14 | 1.9 | 16, 3, 17 |
| ⋅⋅⋅ | 36435 | G0 | 20 | ⋅⋅⋅ | 1.42E−01 | 1.60 ± 0.15 | −4.44 | 4.5 | ⋅⋅⋅ | 1, 1, 18 |
| AB Dore | 36705 | G0 | 15 | ABDMG | 7.22E+00 | 3.1 | ⋅⋅⋅ | 53 | 0.51 | 16, 3, 17 |
| ⋅⋅⋅ | 41824f | G5 | 30 | ⋅⋅⋅ | 1.90E+00 | ⋅⋅⋅ | −4.17 | 8 | 3.3 | 19, 3, 20 |
| ⋅⋅⋅ | 41593 | K0 | 15 | UMG | 2.57E−01 | 1.22 ± 0.17 | −4.36 | 5.0 | 7.97 | 1 |
| GJ 3400Af | 48189 | G0 | 22 | ABDMG | 2.33E+00 | 3.3 | −4.29 | 17.6 | ⋅⋅⋅ | 16, 19, 3 |
| ⋅⋅⋅ | 51849f | K0 | 22 | ⋅⋅⋅ | 5.03E−01 | ⋅⋅⋅ | ⋅⋅⋅ | ⋅⋅⋅ | ⋅⋅⋅ | ⋅⋅⋅ |
| ⋅⋅⋅ | 52698 | K0 | 15 | ⋅⋅⋅ | 1.99E−01 | ⋅⋅⋅ | −4.59 | 3.5 | ⋅⋅⋅ | 1 |
| ⋅⋅⋅ | 59967 | G5 | 22 | ⋅⋅⋅ | 3.20E−01 | 2.50 ± 0.10 | −4.44 | 3.4 | ⋅⋅⋅ | 1 |
| ⋅⋅⋅ | 63433 | G0 | 22 | UMG | 2.24E−01 | 2.33 ± 0.10 | −4.34 | 6.1 | 6.46 | 1 |
| ⋅⋅⋅ | 72760 | G5 | 22 | ⋅⋅⋅ | 9.65E−02 | 0.57 ± 0.45 | −4.39 | 4.2 | ⋅⋅⋅ | 1 |
| ⋅⋅⋅ | 73350g | G0 | 24 | HSC | 1.30E−01 | 2.09 ± 0.10 | −4.49 | 3.8 | 6.14 | 1 |
| ⋅⋅⋅ | 74576 | K0 | 11 | ⋅⋅⋅ | 4.60E−01 | ⋅⋅⋅ | −4.31 | 3.9 | ⋅⋅⋅ | 19, 3 |
| ⋅⋅⋅ | 92139f | F2 | 27 | ⋅⋅⋅ | 2.03E−01 | ⋅⋅⋅ | ⋅⋅⋅ | 15 | ⋅⋅⋅ | 9, 11, 12 |
| ⋅⋅⋅ | 92945 | K0 | 22 | LA | 1.18E−01 | 2.41 | −4.39 | 5.1 | ⋅⋅⋅ | 8, 21 |
| ⋅⋅⋅ | 97334g | G0 | 22 | LA | 3.20E−01 | 2.64 ± 0.09 | −4.41 | 5.6 | 8.25 | 1 |
| TWA 14k | ⋅⋅⋅ | M0 | 55 | TW Hya | 1.07E−01 | ⋅⋅⋅ | ⋅⋅⋅ | ⋅⋅⋅ | 0.63 | 22 |
| TWA 12k | ⋅⋅⋅ | M2 | 55 | TW Hya | 4.29E−01 | ⋅⋅⋅ | ⋅⋅⋅ | 15 | 3.303 | 3, 23 |
| TWA 13Ak | ⋅⋅⋅ | M1 | 55 | TW Hya | 1.16E−01 | ⋅⋅⋅ | ⋅⋅⋅ | 12.3 | 5.56 | 3, 22 |
| TWA 13Bk | ⋅⋅⋅ | M1 | 55 | TW Hya | 1.16E−01 | ⋅⋅⋅ | ⋅⋅⋅ | ⋅⋅⋅ | 5.35 | 22 |
| ⋅⋅⋅ | 103928e | F0 | 47 | ⋅⋅⋅ | 5.00E−03 | ⋅⋅⋅ | ⋅⋅⋅ | 94 | 0.70 | 5, 24, 11, 12 |
| ⋅⋅⋅ | 105963g | K0 | 27 | ⋅⋅⋅ | 1.50E−01 | 2.06 | −4.22 | 6 | 7.44 | 8, 8, 8, 20 |
| ⋅⋅⋅ | 109011 | K0 | 24 | UMG | 6.00E−02 | 0.81 ± 0.15 | −4.36 | 5.5 | 8.81 | 1 |
| TWA 15Bk | ⋅⋅⋅ | M2 | 55 | TW Hya | 1.16E−01 | ⋅⋅⋅ | ⋅⋅⋅ | ⋅⋅⋅ | 0.72 | 22 |
| TWA 15Ak | ⋅⋅⋅ | M1.5 | 55 | TW Hya | 1.16E−01 | ⋅⋅⋅ | ⋅⋅⋅ | ⋅⋅⋅ | 0.65 | 22 |
| TWA 16k | ⋅⋅⋅ | M1.5 | 55 | TW Hya | 1.07E−01 | ⋅⋅⋅ | ⋅⋅⋅ | ⋅⋅⋅ | ⋅⋅⋅ | ⋅⋅⋅ |
| ⋅⋅⋅ | 112429 | F0 | 29 | ⋅⋅⋅ | ⋅⋅⋅ | ⋅⋅⋅ | ⋅⋅⋅ | 130 | ⋅⋅⋅ | 9, 11, 12 |
| ⋅⋅⋅ | 113449 | K0 | 22 | ⋅⋅⋅ | 1.70E−01 | 2.08 ± 0.12 | −4.34 | 5.8 | 6.54 | 1, 13, 1,1 |
| TWA 17k | ⋅⋅⋅ | K5 | 55 | TW Hya | 7.21E−02 | ⋅⋅⋅ | ⋅⋅⋅ | ⋅⋅⋅ | 0.69 | 22 |
| TWA 18k | ⋅⋅⋅ | M0.5 | 55 | TW Hya | 6.22E−02 | ⋅⋅⋅ | ⋅⋅⋅ | ⋅⋅⋅ | 1.11 | 22 |
| ⋅⋅⋅ | 116956 | G5 | 22 | LA | 2.01E−01 | 1.42 ± 0.12 | −4.447 | 5.6 | 7.8 | 1, 13, 1, 1 |
| ⋅⋅⋅ | 123998 | A2p | 43 | ⋅⋅⋅ | ⋅⋅⋅ | ⋅⋅⋅ | ⋅⋅⋅ | 15 | ⋅⋅⋅ | 9, 11, 12 |
| ⋅⋅⋅ | 125158 | A3 | 48 | ⋅⋅⋅ | ⋅⋅⋅ | ⋅⋅⋅ | ⋅⋅⋅ | ⋅⋅⋅ | ⋅⋅⋅ | 11, 12 |
| ⋅⋅⋅ | 128987 | G5 | 24 | ⋅⋅⋅ | 9.81E−02 | 1.78 ± 0.11 | ⋅⋅⋅ | 3.2 | 9.35 | 1 |
| ⋅⋅⋅ | 128400 | G0 | 20 | UMG | 1.40E−01 | ⋅⋅⋅ | −4.56 | 4.4 | ⋅⋅⋅ | 1, 3 |
| ⋅⋅⋅ | 135599 | K0 | 16 | UMG | 9.93E−02 | 0.34 ± 0.28 | ⋅⋅⋅ | 4.6 | 5.97 | 1 |
| ⋅⋅⋅ | 141272 | G5 | 21 | LA | 1.87E−01 | 0.48 ± 0.27 | −4.452 | 4.0 | 14.01 | 1, 13, 1,1 |
| ⋅⋅⋅ | 144197 | A3p | 38 | ⋅⋅⋅ | ⋅⋅⋅ | ⋅⋅⋅ | ⋅⋅⋅ | 7 | ⋅⋅⋅ | 25, 11, 12 |
| ⋅⋅⋅ | 148367f | A2 | 37 | ⋅⋅⋅ | 2.88E−01 | ⋅⋅⋅ | ⋅⋅⋅ | 18 | ⋅⋅⋅ | 25, 11, 12 |
| ⋅⋅⋅ | 165185 | G5 | 17 | UMG | 5.85E−01 | 2.65 ± 0.10 | −4.49 | 7.2 | ⋅⋅⋅ | 1 |
| RE1816+541l | EY Dra | M1.5 | 30 | LA | 2.92E−01 | ⋅⋅⋅ | ⋅⋅⋅ | 61 | 0.459 | 26, 17 |
| ⋅⋅⋅ | 175742 | K0 | 21 | UMG | 1.88E+00 | 1.39 | −3.90 | 14 | 2.907 | 8, 8, 8, 23 |
| ⋅⋅⋅ | 177724 | A0 | 26 | ⋅⋅⋅ | 1.41E−01 | ⋅⋅⋅ | ⋅⋅⋅ | 317 | ⋅⋅⋅ | 5, 11, 12 |
| ⋅⋅⋅ | 180161 | K0 | 20 | ⋅⋅⋅ | 1.55E−01 | 0.86 ± 0.14 | −4.44 | 3.1 | 9.7 | 1 |
| ⋅⋅⋅ | 186219 | A3 | 42 | ⋅⋅⋅ | ⋅⋅⋅ | ⋅⋅⋅ | ⋅⋅⋅ | 125 | ⋅⋅⋅ | 9, 7 |
| AT Micf | 196982 | M4.5j | 10 | BPMG | 3.91E+00 | ⋅⋅⋅ | ⋅⋅⋅ | 10.1 | ⋅⋅⋅ | 3 |
| eta Ind | 197157 | F0 | 24 | ⋅⋅⋅ | ⋅⋅⋅ | ⋅⋅⋅ | ⋅⋅⋅ | ⋅⋅⋅ | ⋅⋅⋅ | 11, 12 |
| AU Mice | 197481 | M0j | 10 | BPMG | 5.95E+00 | ⋅⋅⋅ | ⋅⋅⋅ | 9.3 | 4.9 | 3, 17 |
| BO Mic | 197890 | K0 | 44 | LA | 6.11E+00 | ⋅⋅⋅ | ⋅⋅⋅ | 120 | 0.38 | 27, 28 |
| ⋅⋅⋅ | 358623m | K6 | 24 | BPMG | 2.36E−01 | ⋅⋅⋅ | ⋅⋅⋅ | 15.6 | 3.41 | 3, 23 |
| SAO 145139f | ⋅⋅⋅ | K5j | 26 | ⋅⋅⋅ | 6.03E−01 | ⋅⋅⋅ | ⋅⋅⋅ | ⋅⋅⋅ | ⋅⋅⋅ | ⋅⋅⋅ |
| ⋅⋅⋅ | 202730e | A5 | 30 | ⋅⋅⋅ | 4.19E−01 | ⋅⋅⋅ | ⋅⋅⋅ | 135 | ⋅⋅⋅ | 25, 11, 12 |
| ⋅⋅⋅ | 203244 | G5 | 20 | ⋅⋅⋅ | 1.90E−01 | 1.64 ± 0.15 | −4.39 | 4 | ⋅⋅⋅ | 1, 1,3 |
| LO Peg | HIP 106231 | K3i | 25 | ABDMG | 9.23E−01 | 1.624 | −3.906 | ⋅⋅⋅ | 0.42 | 14, 13, 23 |
| Gl 859ABf | 212697 | G0 | 16 | ⋅⋅⋅ | 8.47E−01 | 2.9 | ⋅⋅⋅ | 9.7 | ⋅⋅⋅ | 29, 18 |
| HKAqr | Gl 890 | M0j | 22 | CMG | 4.27E−01 | ⋅⋅⋅ | ⋅⋅⋅ | ⋅⋅⋅ | 0.431 | 17 |
| ⋅⋅⋅ | 218738g | G5 | 25 | ⋅⋅⋅ | 1.93E+00 | 2.13 | −3.90 | 7 | ⋅⋅⋅ | 8 |
| Gl 907.1f | ⋅⋅⋅ | K7j | 27 | ⋅⋅⋅ | 4.04E−01 | ⋅⋅⋅ | ⋅⋅⋅ | 3.4 | ⋅⋅⋅ | 3 |
Notes. aSpectral type from the HD Catalog unless otherwise noted (Nesterov et al. 1995). Trigonometric parallax distance from Hipparcos unless otherwise noted. bTW Hya = ∼ 8 Myr TW Hya association (Kastner et al. 1997; Webb et al. 1999); BPMG = ∼12 Myr β Pic moving group (Zuckerman et al. 2001a); ABDMG = ∼50–100 Myr AB Dor moving group (Zuckerman et al. 2004; Luhman et al. 2005); LA = ∼20–100 Myr Local Association (Montes et al. 2001a); CMG = ∼200 Myr Castor moving group (Montes et al. 2001a; Barrado y Navascues 1998); UMG = ∼300–500 Myr Ursa major group (King et al. 2003; Soderblom & Mayor 1993a, 1993b); and HSC = Hyades supercluster (Montes et al. 2001a). cCalcium II R'HK ≡ log(LHK/Lbol) corrected for photospheric contribution. dReferences listed in order of association, lithium abundance, log(R'HK), stellar rotation, and young A star sources where appropriate. eVisual companion with separation >5'' not detected with Spitzer. The visual companion is of unknown age/distance, and is excluded from our sample. Projected separation is greater than 100 AU. fAll photometry in this paper includes both A and B components (separation <5''), including co-adding photometry if the binary is resolved in some (but not all) bandpasses. Projected separation is less than 100 AU. gVisual companion with separation >5'' detected with Spitzer at 24 μm and not at 70 μm. The visual companion is of unknown age/distance, and is determined to be photospheric at 24 μm from the Ks–[24] color. Projected separation is greater than 100 AU. We exclude this companion from our sample. hEinstein X-ray detection of 3.7 × 10⁻¹³ erg cm−2 s−1 (Johnson 1986). iGray et al. (2003) jHawley et al. (1996) kDistance set to median distance of TWA 1–19 members with known trigonometric parallax as in (Low et al. 2005). We note that Lawson & Crause (2005) present evidence for a median distance of ∼90 pc. Due to uncertainties in age and distance, we do not use photometric distances on a star-by-star basis. Spectral types from Barrado y Navascues (2006). lDistance estimated from absolute K magnitude distance modulus for a 115 Myr M1.5 dwarf. Age inferred from possible Pleiades measurement and LX/L* implied age of <300 Myr (Messina et al. 2003). Spectral type from Jeffries et al. (1994). The distance derived from the Ks magnitude is not consistent with Pleiades membership; hence the age, distance, and estimated radius for this source are not well constrained. mDistance estimated from absolute K magnitude distance modulus for a 12 Myr K7 dwarf. Age inferred from membership in the β Pic moving group. Spectral type from Torres et al. (2006). References. (1) Gaidos et al. (2000); (2) Valenti & Fischer (2005); (3) Torres et al. (2006); (4) Soderblom & Mayor (1993a); (5) Kudryavtsev & Romanyuk (2003); (6) Royer et al. (2002); (7) J. Stauffer (2000, priv. communication); (8) Strassmeier et al. (2000); (9) Glebocki et al. (2000); (10) Danziger & Faber (1972); (11) Song et al. (2001); (12) Song (2000); (13) Gray et al. (2003); (14) Fischer (1998); (15) Montes et al. (2001b); (16) Favata et al. (1998); (17) Messina et al. (2003); (18) Pace et al. (2003); (19) Henry et al. (1996); (20) Kazarovets et al. (2006); (21) Gray et al. (2006); (22) Lawson & Crause (2005); (23) Pojmanski et al. (2005); (24) Koen & Eyer (2002); (25) Erspamer & North (2003); (26) Jeffries et al. (1994); (27) Bromage et al. (1992); (28) Cutispoto et al. (1997); (29) Pallavicini et al. (1987).
3. OBSERVATIONS
We obtained 24 μm and 70 μm observations of our sample using the Multiband Imaging Photometer for Spitzer (MIPS; Rieke et al. 2004) on the Spitzer Space Telescope (Werner et al. 2004) in photometry mode (default scale). Each of our targets was observed in 2004 or 2005, using integration times of 48.2 s at 24 μm and 186–465 s at 70 μm. The data were reduced using the MIPS Data Analysis Tool (DAT; Gordon et al. 2005), which performs the necessary steps need to produce a final mosaic of the target. We also applied additional reduction techniques to remove instrumental artifacts and flux calibration as described by Engelbracht et al. (2007) and Gordon et al. (2007) at 24 and 70 um, respectively. We adopt flux density calibration factors at 24 μm and 70 μm of 0.0454 and 702, respectively, to convert from instrumental units to MJy per steradian. We also reduce and combine the "bcd" image data from the Spitzer Science Center "S13"/MOPEX/APEX pipeline. The "S13" pipeline processes and removes image artifacts such as bad pixels, cosmic rays, latent images, vertical array column "jailbars" from calibrating "stim flashes" for the 70 μm detector, and the "droop effect" at 24 μm (Gordon et al. 2005).
We extract photometry using point-spread Function (PSF) fits to the co-added image data with the DAT. We examine the 70 μm images for any cirrus contamination. We compare PSF-derived flux densities to aperture photometry derived with the DAT as in Su et al. (2006), as well as to flux densities derived from the MOPEX/APEX pipeline using both aperture photometry and fitting to empirically derived pixel-response functions (PRFs, Makovoz & Marleau 2005). In all four methods, we set a minimum detection threshold signal-to-noise ratio (S/N) of 3. For both sets of comparison aperture photometry, we use a circular aperture with radii of 14 94 (6 pixels) at 24 μm and 295 (3 pixels) at 70 μm as in Su et al. (2006), and use scalar aperture corrections of 1.143 and 1.694, respectively, inferred from Spitzer Tiny Tim models of the PSF (Krist et al. 2002). We estimate background noise from the standard deviation of flux density in background annuli with inner and outer radii of 2955 and 4233 (12–17 pixels) and 3940 and 6895 (4–7 pixels) at 24 μm and 70 μm, respectively. This includes detector noise and noise due to cirrus structures present in the image. If the observations were taken in regions with high cirrus, then the detection limits are dominated by cirrus noise. Our sample cirrus levels span from very low (<5 MJy sr−1 at 70 μm) to high (e.g., ∼20 MJy sr−1 at 70 μm for HD 125158).
In Table 2, we tabulate adopted 24 μm and 70 μm photometry, propagated uncertainties, S/N, expected photospheric flux densities (Section 4), and references in which Spitzer photometry for these sources has been previously published. All photometry in Table 2 assumes a λ−2 flux density across the bandpass. We find good agreement in the derived photometry for all four techniques at 24 μm, and for S/N ≳ 5 at 70 μm. At 70 μm, neither the DAT nor MOPEX/APEX demonstrate greater sensitivity at low S/N. As noted in Table 2, there are seven instances where one or more methods do report a detection at 70 μm at S/N > 3 whereas the other methods do not. These results at 70 μm are below the adopted threshold for the detection of excess (Section 4.2) in all seven cases, and do not affect our results. For the 24 μm excess source AT Mic, a partially resolved ∼3'' binary, we use a DAT aperture photometry rather than PSF fitting at 24 μm to measure the combined flux density from both components. Author: Please define the acronym "DAT", if required.
Table 2. MIPS 24 μm and 70 μm Fluxes (Not Color-Corrected)
| Name/HD | Measureda MIPS Fν(24 μm) (mJy) | Predicted Photosphereb Fν(24 μm) (mJy) | χ24 | Measureda MIPS Fν(70 μm) (mJy) | Predicted Photosphereb Fν(70 μm) (mJy) | χ70 | Referencesc | New Detection of Excess? |
|---|---|---|---|---|---|---|---|---|
| Stars with MIPS-24 and MIPS-70 excessesd | ||||||||
| 10008 | 41.6 ± 0.5 | 36 | 12.1 | 30 ± 1e | 4.1 | 19.8 | 1 | Y |
| 73350 | 66.2 ± 1.3 | 58 | 6.22 | 123 ± 4 | 6.6 | 32.3 | ⋅⋅⋅ | Y |
| 112429 | 132.8 ± 1.6 | 121 | 7.11 | 58 ± 4f | 14 | 10.3 | 1 | N |
| 135599 | 82.5 ± 0.9 | 74 | 9.15 | 106 ± 10 | 8.5 | 9.4 | ⋅⋅⋅ | Y |
| Stars with MIPS-70 excessesd | ||||||||
| 7590 | 62.7 ± 1.0 | 61 | 2.07 | 233 ± 16 | 6.9 | 13.9 | ⋅⋅⋅ | Y |
| 59967 | 70.5 ± 2.5 | 65 | 2.14 | 36 ± 4 | 7.4 | 7.5 | ⋅⋅⋅ | Y |
| 92945 | 39.5 ± 1.0 | 39 | 0.57 | 305 ± 15 | 4.4 | 19.4 | 1 | N |
| AU Mic | 155.2 ± 3.2 | 150 | 1.65 | 223 ± 26 | 17 | 8.0 | 1,2 | N |
| Stars with MIPS-24 excessesd | ||||||||
| GJ 3400A | 120.1 ± 1.4 | 109 | 8.25 | 16 ± 5g | 12 | 0.7 | 1 | Y |
| 123998 | 136.6 ± 2.3 | 123 | 5.7 | <20 | 14 | ⋅⋅⋅ | ⋅⋅⋅ | Y |
| 175742 | 46.9 ± 0.6 | 41 | 10.8 | <13 | 4.7 | ⋅⋅⋅ | 1 | Y |
| AT Mic | 131.6 ± 2.1f | 114 | 8.21 | 22 ± 5f | 13 | 1.8 | 1,2 | Y |
| BO Mic | 16.4 ± 0.4 | 14 | 5.66 | <12 | 1.6 | ⋅⋅⋅ | 1 | Y |
| 358623 | 14.2 ± 0.2 | 13 | 7.28 | <9 | 1.5 | ⋅⋅⋅ | 1,2 | Y |
| Gl 907.1 | 26.7 ± 0.4 | 24 | 5.44 | <13 | 2.8 | ⋅⋅⋅ | 1 | Y |
| Stars with no MIPS excessesd | ||||||||
| 1835 | 86.0 ± 1.0 | 81 | 4.95 | 18 ± 4g | 9.3 | 2.3 | 1 | ⋅⋅⋅ |
| BB Scl | 87.6 ± 1.4 | 97 | −6.89 | <13 | 11 | ⋅⋅⋅ | 1 | ⋅⋅⋅ |
| 11131 | 64.2 ± 2.3 | 62 | 0.83 | <16 | 7.1 | ⋅⋅⋅ | 1 | ⋅⋅⋅ |
| 15089 | 142.1 ± 8.6 | 143 | −0.08 | 28 ± 3h | 16 | 3.7 | ⋅⋅⋅ | ⋅⋅⋅ |
| 16287 | 30.8 ± 0.8 | 30 | 0.89 | <13 | 3.4 | ⋅⋅⋅ | ⋅⋅⋅ | ⋅⋅⋅ |
| 16555 | 108.5 ± 1.7 | 111 | −1.24 | <12 | 13 | ⋅⋅⋅ | ⋅⋅⋅ | ⋅⋅⋅ |
| 17240 | 56.2 ± 0.7 | 54 | 3.07 | 31 ± 6i | 6.2 | 3.9 | ⋅⋅⋅ | ⋅⋅⋅ |
| DO Eri | 56.6 ± 1.0 | 56 | 0.53 | <12 | 6.4 | ⋅⋅⋅ | ⋅⋅⋅ | ⋅⋅⋅ |
| v833 Tau | 63.5 ± 2.5 | 62 | 0.77 | <28 | 7.0 | ⋅⋅⋅ | ⋅⋅⋅ | ⋅⋅⋅ |
| 29697 | 69.7 ± 0.7 | 68 | 2.53 | <31 | 7.7 | ⋅⋅⋅ | 1 | ⋅⋅⋅ |
| Gl 182 | 28.7 ± 0.7 | 27 | 2.06 | <19 | 3.1 | ⋅⋅⋅ | 1 | ⋅⋅⋅ |
| 36435 | 61.0 ± 0.7 | 59 | 2.24 | <12 | 6.8 | ⋅⋅⋅ | ⋅⋅⋅ | ⋅⋅⋅ |
| AB Dor | 106.0 ± 8.8 | 95 | 1.22 | <47 | 11 | ⋅⋅⋅ | 1 | ⋅⋅⋅ |
| 41824 | 85.4 ± 1.5 | 84 | 0.74 | <11 | 9.6 | ⋅⋅⋅ | ⋅⋅⋅ | ⋅⋅⋅ |
| 41593 | 84.6 ± 1.4 | 84 | 0.34 | <22 | 9.6 | ⋅⋅⋅ | ⋅⋅⋅ | ⋅⋅⋅ |
| 51849 | 27.9 ± 0.4 | 26 | 4.67 | <10 | 3.0 | ⋅⋅⋅ | 1 | ⋅⋅⋅ |
| 52698 | 102.1 ± 2.0 | 100 | 1.15 | <13 | 11 | ⋅⋅⋅ | ⋅⋅⋅ | ⋅⋅⋅ |
| 63433 | 58.6 ± 0.6 | 56 | 3.64 | <13 | 6.4 | ⋅⋅⋅ | ⋅⋅⋅ | ⋅⋅⋅ |
| 72760 | 48.8 ± 0.8 | 48 | 0.61 | <12 | 5.5 | ⋅⋅⋅ | ⋅⋅⋅ | ⋅⋅⋅ |
| 74576 | 130.2 ± 1.7 | 129 | 0.71 | <16 | 15 | ⋅⋅⋅ | 1 | ⋅⋅⋅ |
| 92139 | 419.5 ± 3.5 | 403 | 4.57 | 59 ± 18 | 46 | 0.7 | 1 | ⋅⋅⋅ |
| 97334 | 73.3 ± 1.3 | 74 | −0.66 | <15 | 8.5 | ⋅⋅⋅ | ⋅⋅⋅ | ⋅⋅⋅ |
| TWA 14 | 4.21 ± 0.20 | 3.8 | 2.24 | <13 | 0.43 | ⋅⋅⋅ | 3 | ⋅⋅⋅ |
| TWA 12 | 6.04 ± 0.33 | 5.7 | 1.17 | <8 | 0.65 | ⋅⋅⋅ | 3 | ⋅⋅⋅ |
| TWA 13A | 8.67 ± 3.44 | 9.1 | −0.11 | <38 | 1.0 | ⋅⋅⋅ | 3 | ⋅⋅⋅ |
| TWA 13B | 8.67 ± 3.44 | 9.0 | −0.09 | <38 | 1.0 | ⋅⋅⋅ | 3 | ⋅⋅⋅ |
| 103928 | 42.0 ± 1.0 | 41 | 0.83 | <11 | 4.7 | ⋅⋅⋅ | ⋅⋅⋅ | ⋅⋅⋅ |
| 105963 | 36.1 ± 11.8 | 36 | −0.03 | <10 | 4.2 | ⋅⋅⋅ | 1 | ⋅⋅⋅ |
| 109011 | 39.7 ± 0.8 | 40 | −0.13 | <11 | 4.6 | ⋅⋅⋅ | ⋅⋅⋅ | ⋅⋅⋅ |
| TWA 15B | 1.60 ± 0.62 | 1.4 | 0.31 | <76 | 0.16 | ⋅⋅⋅ | 3 | ⋅⋅⋅ |
| TWA 15A | 1.44 ± 0.62 | 1.3 | 0.27 | <76 | 0.15 | ⋅⋅⋅ | 3 | ⋅⋅⋅ |
| TWA 16 | 5.87 ± 0.14 | 5.5 | 2.91 | <17 | 0.62 | ⋅⋅⋅ | 3 | ⋅⋅⋅ |
| 113449 | 48.5 ± 0.8 | 45 | 4.34 | <15 | 5.2 | ⋅⋅⋅ | ⋅⋅⋅ | ⋅⋅⋅ |
| TWA 17 | 2.20 ± 0.80 | 2.1 | 0.17 | <18 | 0.24 | ⋅⋅⋅ | 3 | ⋅⋅⋅ |
| TWA 18 | 2.78 ± 0.09 | 2.7 | 0.64 | <9 | 0.31 | ⋅⋅⋅ | 3 | ⋅⋅⋅ |
| 116956 | 50.5 ± 1.7 | 49 | 0.9 | 14 ± 2f | 5.6 | 3.6 | ⋅⋅⋅ | ⋅⋅⋅ |
| 125158 | 104.3 ± 9.8 | 97 | 0.77 | <429 | 11 | ⋅⋅⋅ | ⋅⋅⋅ | ⋅⋅⋅ |
| 128987 | 44.3 ± 0.5 | 44 | 1 | <22 | 5.0 | ⋅⋅⋅ | ⋅⋅⋅ | ⋅⋅⋅ |
| 128400 | 67.0 ± 1.2 | 67 | 0.15 | <11 | 7.6 | ⋅⋅⋅ | ⋅⋅⋅ | ⋅⋅⋅ |
| 141272 | 43.3 ± 0.8 | 45 | −2.13 | <14 | 5.1 | ⋅⋅⋅ | 1 | ⋅⋅⋅ |
| 144197 | 131.8 ± 1.4 | 140 | −6.04 | <26 | 16 | ⋅⋅⋅ | ⋅⋅⋅ | ⋅⋅⋅ |
| 148367 | 159.0 ± 2.2 | 154 | 2.25 | <23 | 18 | ⋅⋅⋅ | ⋅⋅⋅ | ⋅⋅⋅ |
| 165185 | 115.1 ± 3.8 | 116 | −0.35 | <16 | 13 | ⋅⋅⋅ | ⋅⋅⋅ | ⋅⋅⋅ |
| RE1816+541 | 7.52 ± 0.13 | 7.4 | 0.72 | <13 | 0.85 | ⋅⋅⋅ | 1 | ⋅⋅⋅ |
| 177724 | 498.2 ± 8.5 | 485 | 1.56 | 50 ± 14f | 55 | −0.4 | 1 | ⋅⋅⋅ |
| 180161 | 59.2 ± 0.6 | 59 | −0.14 | <11 | 6.8 | ⋅⋅⋅ | 1 | ⋅⋅⋅ |
| 186219 | 90.2 ± 0.9 | 86 | 4.38 | 23 ± 6 | 9.8 | 2.1 | 1 | ⋅⋅⋅ |
| eta Ind | 201.3 ± 3.1 | 212 | −3.37 | 31 ± 6 | 24 | 1.2 | 1 | ⋅⋅⋅ |
| SAO 145139 | 21.1 ± 0.9 | 21 | 0.37 | <15 | 2.4 | ⋅⋅⋅ | ⋅⋅⋅ | ⋅⋅⋅ |
| 202730 | 157.3 ± 17.1 | 157 | 0.02 | 27 ± 4g | 18 | 2.2 | 1,4 | ⋅⋅⋅ |
| 203244 | 61.2 ± 1.1 | 59 | 2.47 | <14 | 6.7 | ⋅⋅⋅ | ⋅⋅⋅ | ⋅⋅⋅ |
| LO Peg | 23.6 ± 0.4 | 21 | 4.97 | <8 | 2.4 | ⋅⋅⋅ | 1 | ⋅⋅⋅ |
| Gl 859A | 165.3 ± 2.9 | 163 | 0.7 | <18 | 19 | ⋅⋅⋅ | 1 | ⋅⋅⋅ |
| HK Aqr | 13.3 ± 0.4 | 13 | 0.29 | <16 | 1.5 | ⋅⋅⋅ | 1 | ⋅⋅⋅ |
| 218738 | 44.1 ± 10.4 | 39 | 0.5 | <8 | 4.4 | ⋅⋅⋅ | 1 | ⋅⋅⋅ |
Notes.
aFlux from DAT pipeline PSF fitting unless otherwise noted. Detection confirmed with MOPEX pipeline PRF fitting unless otherwise noted.
bFrom Ks–[24] empirical model derived in Gautier et al. (2008) and stellar effective temperature. Stellar effective temperatures derived from PHOENIX NextGen model photospheres fit to optical and near-IR photometry.
cPrevious publications of Spitzer MIPS photometry for these sources.
dA 70 μm excess is defined as χ70 > 5. A 24 μm excess is defined as χ24 > 5. χ24,70 ≡ (F24,70 − F*)/σ24,70 where the uncertainty σ24,70 does not include the uncertainty in the model photosphere flux density, but does include the uncertainty in the detection S/N and the flux density calibration uncertainty.
eCentroided position of 70 μm detection is offset 37 in right ascension and 29 in declination from position expected from 24 μm detection.
fDAT aperture corrected flux density. Detection confirmed with MOPEX PRF fitting.
gFlux from MOPEX pipeline PRF fitting. Detection not confirmed with DAT pipeline PSF fitting.
hDAT pipeline detection not confirmed with MOPEX pipeline PRF fitting.
iCentroided position of 70 μm detection is offset 74 in right ascension and −15 in declination from position expected from 24 μm detection.
References. (1) Chen et al. (2005b); (2) Rebull et al. (2008); (3) Low et al. (2005); (4) Rieke et al. (2005).
At both 24 and 70 μm, we use the DAT PSF photometry when available due to the smaller flux density calibration uncertainties. At 24 μm, we detect all of our sample targets. At 70 μm, we detect 19 of our 70 sample targets with S/N > 3 at the expected positions inferred from the 24 μm source position, unless otherwise noted in Table 2. For nondetections at 70 μm, we calculate 3σ upper limits by measuring the standard deviation of flux density within a circular aperture with a radius of 295 at the expected source location. Our photometry are consistent with preliminary results in Chen et al. (2005b) and Low et al. (2005), but we obtain better overall precision and sensitivity.
4. ANALYSIS
In Section 4.1, we use a χ2 minimization procedure to fit PHOENIX NextGen model photospheres (Hauschildt et al. 1999a) to optical and near-infrared photometry to estimate stellar effective temperature and radii. In Section 4.2, we compare the Ks–[24] colors to the relation empirically derived by Gautier et al. (2008) from nearby (<5 pc) disk less main-sequence G, K, and M dwarfs. In Section 4.3, we place constraints on the circumstellar material for detected and nondetected mid-infrared excesses. In Section 4.4, we estimate ages, masses, and calculate X-ray luminosities for our sample.
4.1. Modeling of Stellar Photospheres
We obtain photoelectric optical UBVRcIc photometry from the literature, with B and V magnitudes primarily from the Tycho catalog, transformed to the Johnson photometric system using the corrected relations in Mamajek et al. (2006, 2002). We obtain JHKs near-infrared photometry from the 2MASS All-Sky Catalog of Point Sources (Skrutskie et al. 2006). In several cases, our sources saturate the 2MASS detectors, and for two of these sources we obtain J- and K-band magnitudes from Morel & Magnenat (1978). Due to saturation, we do not include 2MASS J-band photometry for HD 112429, HD 16555, HD 125158, and HD 144197, and H-band photometry for HD 112429. We also do not include optical photometry for several sources when the literature magnitudes appear inconsistent with the magnitudes in other bands—Rc-band magnitudes for HD 10008, TWA 18, and HK Aqr, and I-band magnitudes for SAO 145139, TWA 12, and HK Aqr. We tabulate and cite all the photometry in Table 3.
Table 3. Optical and Near-IR Photoelectric Photometry and Derived Stellar Properties
| Name/HD | R*a (R☉) | T*a (K) | L*a (L☉) | U (mag) | B (mag) | V (mag) | Rc (mag) | Ic (mag) | J (mag) | H (mag) | Ks (mag) | References |
|---|---|---|---|---|---|---|---|---|---|---|---|---|
| 1835 | 0.98 | 5840 ± 20 | 1.00 | 7.16 | 7.04 | 6.38 | 6.01 | 5.68 | 5.253 ± 0.021 | 5.035 ± 0.034 | 4.861 ± 0.016 | 1,2,2,3,4,5,5,5 |
| 7590 | 0.97 | 5980 ± 20 | 1.07 | ⋅⋅⋅ | 7.17 | 6.59 | 6.25 | 5.93 | 5.515 ± 0.018 | 5.258 ± 0.029 | 5.177 ± 0.016 | -,2,2,3,4,5,5,5 |
| BB Scl | 1.38 | 4820 ± 20 | 0.91 | 8.66 | 8.09 | 7.16 | 6.62 | 6.09 | 5.34 ± 0.023 | 4.973 ± 0.076 | 4.69 ± 0.018 | 1,2,2,6,6,5,5,5 |
| 10008 | 0.80 | 5340 ± 20 | 0.46 | 8.90 | 8.46 | 7.66 | ⋅⋅⋅ | 6.82 | 6.225 ± 0.024 | 5.899 ± 0.036 | 5.753 ± 0.018 | 1,2,2,-,4,5,5,5 |
| 11131 | 0.98 | 5780 ± 20 | 0.95 | 7.48 | 7.36 | 6.73 | 6.34 | 6.00 | 5.536 ± 0.023 | 5.289 ± 0.023 | 5.149 ± 0.02 | 1,2,2,3,4,5,5,5 |
| 15089 | 2.19 | 8740 ± 20 | 25.0 | 4.69 | 4.64 | 4.48 | 4.37 | 4.31 | 3.981 ± 0.428 | 4.29 ± 0.036 | 4.248 ± 0.031 | 1,2,2,7,7,5,5,5 |
| 16287 | 0.78 | 5040 ± 20 | 0.35 | 9.81 | 9.08 | 8.13 | ⋅⋅⋅ | 7.14 | 6.518 ± 0.024 | 6.035 ± 0.033 | 5.938 ± 0.026 | 1,2,2,-,4,5,5,5 |
| 16555 | 2.19 | 7280 ± 20 | 12.1 | ⋅⋅⋅ | 5.58 | 5.29 | ⋅⋅⋅ | 4.96 | 4.564 ± 0.306b | 4.6 ± 0.023 | 4.525 ± 0.021 | -,2,2,-,4,5,5,5 |
| 17240 | 1.69 | 6860 ± 20 | 5.63 | 6.61 | 6.61 | 6.24 | ⋅⋅⋅ | 5.79 | 5.504 ± 0.032 | 5.369 ± 0.017 | 5.302 ± 0.023 | 8,2,2,-,9,5,5,5 |
| DO Eri | 1.73 | 7280 ± 20 | 7.49 | 6.34 | 6.31 | 5.99 | ⋅⋅⋅ | 5.62 | 5.432 ± 0.018 | 5.314 ± 0.024 | 5.262 ± 0.02 | 10,2,2,-,4,5,5,5 |
| v833 Tau | 0.84 | 4500 ± 20 | 0.26 | 10.29 | 9.20 | 8.10 | ⋅⋅⋅ | 6.92 | 5.945 ± 0.023 | 5.4 ± 0.018 | 5.24 ± 0.023 | 11,2,2,-,4,5,5,5 |
| 29697 | 0.67 | 4440 ± 20 | 0.15 | 10.16 | 9.24 | 8.13 | 7.48 | 6.97 | 5.854 ± 0.019 | 5.31 ± 0.02 | 5.146 ± 0.02 | 1,2,2,12,4,5,5,5 |
| Gl 182 | 0.89 | 3860 ± 100 | 0.16 | 12.61 | 11.48 | 10.10 | ⋅⋅⋅ | 8.26 | 7.117 ± 0.02 | 6.45 ± 0.031 | 6.261 ± 0.017 | 1,2,2,-,9,5,5,5 |
| 36435 | 0.84 | 5480 ± 20 | 0.56 | 8.06 | 7.76 | 6.99 | 6.57 | 6.20 | 5.704 ± 0.018 | 5.342 ± 0.049 | 5.2 ± 0.018 | 1,2,2,3,4,5,5,5 |
| AB Dor | 0.84 | 5100 ± 20 | 0.43 | 8.14 | 7.77 | 6.94 | ⋅⋅⋅ | 6.00 | 5.316 ± 0.019 | 4.845 ± 0.033 | 4.686 ± 0.016 | 1,2,2,-,4,5,5,5 |
| 41824 | 1.51 | 5520 ± 20 | 1.88 | 7.53 | 7.27 | 6.59 | 6.18 | 5.81 | 5.345 ± 0.026 | 4.971 ± 0.034 | 4.82 ± 0.02 | 1,2,2,6,6,5,5,5 |
| 41593 | 0.80 | 5320 ± 20 | 0.46 | 8.00 | 7.58 | 6.75 | 6.28 | 5.90 | 5.317 ± 0.018 | 4.942 ± 0.038 | 4.822 ± 0.017 | 1,2,2,3,4,5,5,5 |
| GJ 3400A | 1.22 | 5740 ± 20 | 1.45 | 6.86 | 6.76 | 6.14 | 5.78 | 5.45 | 5.079 ± 0.272 | 4.747 ± 0.092 | 4.544 ± 0.026 | 1,2,2,6,9,5,5,5 |
| 51849 | 0.68 | 4460 ± 20 | 0.16 | 11.31 | 10.25 | 9.16 | ⋅⋅⋅ | ⋅⋅⋅ | 6.903 ± 0.026 | 6.368 ± 0.053 | 6.19 ± 0.027 | 1,2,2,-,-,5,5,5 |
| 52698 | 0.84 | 5120 ± 20 | 0.43 | 8.21 | 7.60 | 6.70 | 6.22 | 5.79 | 5.152 ± 0.017 | 4.845 ± 0.047 | 4.636 ± 0.015 | 1,2,2,3,4,5,5,5 |
| 59967 | 0.95 | 5720 ± 20 | 0.87 | ⋅⋅⋅ | 7.29 | 6.65 | 6.28 | 5.94 | 5.527 ± 0.026 | 5.253 ± 0.023 | 5.099 ± 0.021 | -,2,2,3,4,5,5,5 |
| 63433 | 0.90 | 5600 ± 20 | 0.71 | ⋅⋅⋅ | 7.59 | 6.91 | 6.52 | 6.17 | 5.624 ± 0.043 | 5.359 ± 0.026 | 5.258 ± 0.016 | -,2,2,3,4,5,5,5 |
| 72760 | 0.86 | 5260 ± 20 | 0.51 | ⋅⋅⋅ | 8.13 | 7.31 | 6.89 | 6.49 | 5.917 ± 0.026 | 5.551 ± 0.036 | 5.423 ± 0.02 | -,2,2,3,4,5,5,5 |
| 73350 | 0.96 | 5840 ± 20 | 0.97 | 7.56 | 7.39 | 6.74 | 6.36 | 6.02 | 5.626 ± 0.023 | 5.318 ± 0.027 | 5.223 ± 0.029 | 1,2,2,3,4,5,5,5 |
| 74576 | 0.74 | 5040 ± 20 | 0.31 | 8.16 | 7.52 | 6.58 | 6.06 | 5.61 | 4.937 ± 0.037 | 4.441 ± 0.212 | 4.358 ± 0.02 | 1,2,2,3,4,5,5,5 |
| 92139 | 2.49 | 7360 ± 20 | 16.2 | 4.20 | 4.14 | 3.83 | 3.59 | 3.43 | 3.27 | 3.17 ± 0.208 | 3.12 | 1,2,2,7,7,7,5,7 |
| 92945 | 0.77 | 5180 ± 20 | 0.38 | 9.17 | 8.61 | 7.71 | 7.21 | 6.79 | 6.176 ± 0.024 | 5.77 ± 0.046 | 5.66 ± 0.018 | 1,2,2,13,4,5,5,5 |
| 97334 | 0.99 | 5920 ± 20 | 1.08 | 7.14 | 7.02 | 6.41 | 6.06 | 5.74 | 5.265 ± 0.024 | 5.021 ± 0.018 | 4.959 ± 0.017 | 1,2,2,3,4,5,5,5 |
| TWA 14 | 0.72 | 3600 ± 100 | 0.08 | ⋅⋅⋅ | ⋅⋅⋅ | 13.80 | 11.85 | 10.60 | 9.415 ± 0.028 | 8.727 ± 0.04 | 8.495 ± 0.031 | -,-,14,15,16,5,5,5 |
| TWA 12 | 0.88 | 3600 ± 100 | 0.12 | ⋅⋅⋅ | 14.38 | 12.85 | ⋅⋅⋅ | ⋅⋅⋅ | 8.999 ± 0.034 | 8.334 ± 0.033 | 8.053 ± 0.029 | -,17,17,-,-,5,5,5 |
| TWA 13A | 1.08 | 3760 ± 20 | 0.21 | ⋅⋅⋅ | 12.88 | 11.46 | ⋅⋅⋅ | 9.57 | 8.431 ± 0.043 | 7.727 ± 0.067 | 7.491 ± 0.038 | -,17,17,-,17,5,5,5 |
| TWA 13B | 1.03 | 3900 ± 20 | 0.22 | ⋅⋅⋅ | 13.43 | 11.96 | ⋅⋅⋅ | 9.88 | 8.429 ± 0.037 | 7.684 ± 0.055 | 7.46 ± 0.027 | -,17,17,-,17,5,5,5 |
| 103928 | 1.45 | 7120 ± 20 | 4.81 | ⋅⋅⋅ | 6.74 | 6.42 | ⋅⋅⋅ | 6.03 | 5.757 ± 0.026 | 5.66 ± 0.026 | 5.599 ± 0.024 | -,2,2,-,4,5,5,5 |
| 105963 | 0.94 | 5000 ± 20 | 0.49 | 9.49 | 8.93 | 8.00 | ⋅⋅⋅ | 7.11 | 6.313 ± 0.023 | 5.867 ± 0.027 | 5.734 ± 0.017 | 1,2,2,-,9,5,5,5 |
| 109011 | 0.89 | 4820 ± 20 | 0.38 | 9.69 | 9.05 | 8.11 | 7.32 | 7.18 | 6.324 ± 0.052 | 5.814 ± 0.027 | 5.662 ± 0.02 | 1,2,2,7,4,5,5,5 |
| TWA 15B | 0.44 | 3600 ± 100 | 0.03 | ⋅⋅⋅ | ⋅⋅⋅ | 14.00 | 13.41 | 11.81 | 10.487 ± 0.038 | 9.826 ± 0.035 | 9.561 ± 0.038 | -,-,14,15,15,5,5,5 |
| TWA 15A | 0.42 | 3600 ± 100 | 0.03 | ⋅⋅⋅ | ⋅⋅⋅ | 14.10 | 13.51 | 11.94 | 10.562 ± 0.026 | 9.935 ± 0.023 | 9.673 ± 0.023 | -,-,14,15,15,5,5,5 |
| TWA 16 | 0.87 | 3600 ± 100 | 0.11 | ⋅⋅⋅ | ⋅⋅⋅ | 12.30 | 11.64 | 10.17 | 8.994 ± 0.026 | 8.332 ± 0.038 | 8.09 ± 0.023 | -,-,14,15,15,5,5,5 |
| 112429 | 1.50 | 7180 ± 20 | 5.36 | 5.55 | 5.52 | 5.23 | ⋅⋅⋅ | 4.88 | 4.803 ± 0.230 | 4.604 ± 0.204 | 4.425 ± 0.016 | 1,2,2,-,4,5,5,5 |
| 113449 | 0.87 | 4940 ± 20 | 0.40 | ⋅⋅⋅ | 8.57 | 7.70 | 7.28 | 6.81 | 6.053 ± 0.021 | 5.674 ± 0.038 | 5.509 ± 0.023 | -,2,2,3,4,5,5,5 |
| TWA 17 | 0.49 | 4080 ± 20 | 0.06 | ⋅⋅⋅ | ⋅⋅⋅ | 12.70 | 11.69 | 10.78 | 9.806 ± 0.022 | 9.187 ± 0.023 | 9.013 ± 0.019 | -,-,14,15,15,5,5,5 |
| TWA 18 | 0.61 | 3600 ± 100 | 0.06 | ⋅⋅⋅ | ⋅⋅⋅ | 12.90 | ⋅⋅⋅ | 10.92 | 9.744 ± 0.023 | 9.076 ± 0.023 | 8.846 ± 0.019 | -,-,14,-,15,5,5,5 |
| 116956 | 0.87 | 5280 ± 20 | 0.52 | ⋅⋅⋅ | 8.11 | 7.29 | 6.85 | 6.46 | 5.812 ± 0.023 | 5.481 ± 0.021 | 5.411 ± 0.024 | -,2,2,3,4,5,5,5 |
| 123998 | 2.13 | 7860 ± 20 | 15.5 | 5.24 | 5.14 | 4.89 | ⋅⋅⋅ | 4.65 | 4.873 ± 0.288 | 4.624 ± 0.248 | 4.406 ± 0.024 | 1,2,2,-,4,5,5,5 |
| 125158 | 2.16 | 7700 ± 20 | 14.7 | 5.64 | 5.50 | 5.21 | 4.97 | 4.93 | 5.059 ± 0.224b | 4.788 ± 0.047 | 4.67 ± 0.023 | 1,2,2,7,4,5,5,5 |
| 128987 | 0.86 | 5520 ± 20 | 0.62 | ⋅⋅⋅ | 7.97 | 7.23 | 6.84 | 6.47 | 5.947 ± 0.021 | 5.629 ± 0.018 | 5.531 ± 0.018 | -,2,2,3,4,5,5,5 |
| 128400 | 0.91 | 5600 ± 20 | 0.73 | ⋅⋅⋅ | 7.44 | 6.73 | ⋅⋅⋅ | 5.97 | 5.525 ± 0.021 | 5.214 ± 0.044 | 5.072 ± 0.018 | -,2,2,-,4,5,5,5 |
| 135599 | 0.77 | 5180 ± 20 | 0.38 | ⋅⋅⋅ | 7.76 | 6.93 | 6.47 | 6.06 | 5.484 ± 0.018 | 5.115 ± 0.027 | 4.958 ± 0.017 | -,2,2,13,4,5,5,5 |
| 141272 | 0.82 | 5240 ± 20 | 0.45 | ⋅⋅⋅ | 8.25 | 7.44 | 7.01 | 6.60 | 5.991 ± 0.021 | 5.61 ± 0.027 | 5.501 ± 0.018 | -,2,2,13,4,5,5,5 |
| 144197 | 2.00 | 7920 ± 20 | 14.1 | 5.11 | 4.96 | 4.71 | 4.51 | 4.51 | 4.519 ± 0.300b | 4.285 ± 0.268 | 4.267 ± 0.316 | 1,2,2,7,4,5,5,5 |
| 148367 | 2.06 | 8040 ± 20 | 15.8 | 4.91 | 4.82 | 4.63 | 4.43 | 4.34 | 4.271 ± 0.244 | 4.155 ± 0.2 | 4.165 ± 0.036 | 1,2,2,7,7,5,5,5 |
| 165185 | 0.99 | 5940 ± 20 | 1.09 | 6.60 | 6.53 | 5.94 | 5.59 | 5.26 | 4.835 ± 0.037 | 4.614 ± 0.016 | 4.469 ± 0.016 | 1,2,2,3,9,5,5,5 |
| RE1816+541 | 0.54 | 3620 ± 100 | 0.04 | ⋅⋅⋅ | 13.43 | 11.83 | ⋅⋅⋅ | 9.73 | 8.616 ± 0.021 | 7.96 ± 0.031 | 7.75 ± 0.02 | -,18,18,-,19,5,5,5 |
| 175742 | 0.81 | 4780 ± 20 | 0.31 | 9.68 | 9.13 | 8.19 | ⋅⋅⋅ | 7.24 | 6.243 ± 0.019 | 5.762 ± 0.018 | 5.637 ± 0.02 | 1,2,2,-,9,5,5,5 |
| 177724 | 2.27 | 9620 ± 20 | 39.4 | 3.00 | 2.99 | 2.95 | 2.98 | 2.96 | 2.93 | 3.048 ± 0.28 | 2.92 | 1,2,2,7,4,7,5,7 |
| 180161 | 0.86 | 5400 ± 20 | 0.56 | 8.28 | 7.84 | 7.03 | ⋅⋅⋅ | 6.19 | 5.651 ± 0.03 | 5.297 ± 0.6 | 5.202 ± 0.02 | 1,2,2,-,4,5,5,5 |
| 186219 | 1.76 | 7600 ± 20 | 9.26 | 5.74 | 5.64 | 5.39 | ⋅⋅⋅ | 5.13 | 5.01 ± 0.288 | 4.888 ± 0.018 | 4.797 ± 0.017 | 1,2,2,-,4,5,5,5 |
| AT Mic | 0.81 | 3200 ± 100 | 0.06 | 12.69 | 11.80 | 10.24 | 8.98 | 7.31 | 5.807 ± 0.026 | 5.201 ± 0.046 | 4.944 ± 0.042 | 1,12,12,12,12,5,5,5 |
| eta Ind | 1.64 | 7400 ± 20 | 7.18 | 4.86 | 4.78 | 4.50 | ⋅⋅⋅ | 4.20 | 3.909 ± 0.278 | 3.692 ± 0.28 | 3.82 ± 0.268 | 1,2,2,-,4,5,5,5 |
| AU Mic | 0.84 | 3500 ± 100 | 0.09 | 11.16 | 10.21 | 8.76 | 7.81 | 6.70 | 5.436 ± 0.017 | 4.831 ± 0.016 | 4.529 ± 0.02 | 1,2,2,20,20,5,5,5 |
| BO Mic | 1.00 | 4680 ± 20 | 0.43 | 10.93 | 10.39 | 9.45 | 8.89 | 8.33 | 7.513 ± 0.021 | 6.93 ± 0.029 | 6.794 ± 0.026 | 1,2,2,6,17,5,5,5 |
| 358623 | 0.54 | 4060 ± 20 | 0.07 | ⋅⋅⋅ | 11.60 | 10.62 | ⋅⋅⋅ | 9.13 | 7.849 ± 0.021 | 7.249 ± 0.031 | 7.039 ± 0.02 | -,2,2,-,17,5,5,5 |
| SAO 145139 | 0.72 | 4460 ± 20 | 0.18 | 11.60 | 10.61 | 9.42 | ⋅⋅⋅ | ⋅⋅⋅ | 7.146 ± 0.024 | 6.589 ± 0.036 | 6.428 ± 0.018 | 11,2,2,-,-,5,5,5 |
| 202730 | 1.61 | 8360 ± 20 | 11.3 | 4.76 | 4.66 | 4.48 | ⋅⋅⋅ | 4.27 | 3.426 ± 0.434 | 4.224 ± 0.076 | 4.145 ± 0.026 | 1,2,2,-,9,5,5,5 |
| 203244 | 0.87 | 5440 ± 20 | 0.59 | ⋅⋅⋅ | 7.71 | 6.98 | 6.58 | 6.21 | 5.651 ± 0.019 | 5.297 ± 0.024 | 5.216 ± 0.018 | -,2,2,3,4,5,5,5 |
| LO Peg | 0.70 | 4520 ± 20 | 0.18 | 11.04 | 10.24 | 9.24 | ⋅⋅⋅ | 8.14 | 7.075 ± 0.021 | 6.524 ± 0.04 | 6.382 ± 0.026 | 1,2,2,-,9,5,5,5 |
| Gl 859A | 1.11 | 5960 ± 20 | 1.39 | 6.22 | 6.14 | 5.52 | 5.17 | 4.84 | 4.129 ± 0.206 | 4.199 ± 0.076 | 4.102 ± 0.016 | 1,2,2,3,9,5,5,5 |
| HK Aqr | 0.53 | 3660 ± 20 | 0.05 | 13.85 | 12.85 | 10.71 | ⋅⋅⋅ | ⋅⋅⋅ | 7.979 ± 0.021 | 7.301 ± 0.029 | 7.114 ± 0.031 | 1,2,2,21,21,5,5,5 |
| 218738 | 0.92 | 5040 ± 20 | 0.48 | 9.41 | 8.84 | 7.91 | ⋅⋅⋅ | ⋅⋅⋅ | 6.225 ± 0.02 | 5.788 ± 0.026 | 5.659 ± 0.026 | 1,2,2,-,-,5,5,5 |
| Gl 907.1 | 0.81 | 4240 ± 20 | 0.19 | 12.04 | 10.91 | 9.55 | ⋅⋅⋅ | 8.00 | 7.045 ± 0.023 | 6.485 ± 0.024 | 6.294 ± 0.018 | 1,2,2,-,9,5,5,5 |
Notes.
aRadii are fitted to the nearest 0.5% and the uncertainty is dominated by the uncertainty in the trigonometric parallax. For unresolved binaries listed in Table 1, the derived radius, effective temperature, and luminosity listed correspond to the equivalent single star (e.g., L* = LA + LB;  RA if T* ∼ TA ∼ TB and RA ∼ RB). For sources with nontrigonometric distances in Table 1, the derived radius and luminosity are dependent on the distance assumed.
bNot included in χ2 fit to model photospheres.
References. (1) Mermilliod & Mermilliod (1994); (2) Tycho-2 using the color transformations of Mamajek et al. (2002, 2006); (3) Taylor (2005, 2003); (4) UCAC2 Bright Star Supplement (Urban et al. 2004); (5) 2MASS (Skrutskie et al. 2006); (6) Cutispoto et al. (1999); (7) Morel & Magnenat (1978); (8) Oja (1991); (9) the OSACA database Bobylev et al. (2006); (10) Ducati (2002); (11) Sky 2000 Catalog (Myers et al. 2002); (12) Reid & Cruz (2002); (13) Kotoneva et al. (2002); (14) Low et al. (2005); (15) Zuckerman et al. (2001b); (16) N-band in Guide Star Catalogue 2.3.2 StScI (2006); (17) Torres et al. (2006); (18) Mason et al. (1995); (19) Droege et al. (2006); (20) Cousins (1980); (21) Koen et al. (2002).
RA if T* ∼ TA ∼ TB and RA ∼ RB). For sources with nontrigonometric distances in Table 1, the derived radius and luminosity are dependent on the distance assumed.
bNot included in χ2 fit to model photospheres.
References. (1) Mermilliod & Mermilliod (1994); (2) Tycho-2 using the color transformations of Mamajek et al. (2002, 2006); (3) Taylor (2005, 2003); (4) UCAC2 Bright Star Supplement (Urban et al. 2004); (5) 2MASS (Skrutskie et al. 2006); (6) Cutispoto et al. (1999); (7) Morel & Magnenat (1978); (8) Oja (1991); (9) the OSACA database Bobylev et al. (2006); (10) Ducati (2002); (11) Sky 2000 Catalog (Myers et al. 2002); (12) Reid & Cruz (2002); (13) Kotoneva et al. (2002); (14) Low et al. (2005); (15) Zuckerman et al. (2001b); (16) N-band in Guide Star Catalogue 2.3.2 StScI (2006); (17) Torres et al. (2006); (18) Mason et al. (1995); (19) Droege et al. (2006); (20) Cousins (1980); (21) Koen et al. (2002).
PHOENIX NextGen models are used to fit the observed optical and near-IR photometry rather than a blackbody, since the stellar SEDs are very different from that of a blackbody at optical and near-IR wavelengths (Hauschildt et al. 1999a, 1999b; Gray 1992; Mullan et al. 1989). We assume solar metallicity as is typical for main-sequence stars in the solar neighborhood (e.g., Boone et al. 2006; Drilling & Landolt 2000). We assume log g = 4.5 as is typical for main-sequence stars, and AV = 0. Our sample includes some K and M dwarfs that have not yet reached the main sequence and will have lower surface gravities, but this has a negligible effect on our derived stellar radii and effective temperatures. To fit the NextGen spectra to the available photometry, we compute a χ2 minimization as a function of effective temperature and normalization. We integrate model photospheres as a function of wavelength across effective bandpasses to compare to observed photometry for a given band. We assign a weight of 1 to each band, and we normalize to Ks.
For effective temperatures (T*) greater than 3600 K, we interpolate (linearly in T4*) the NextGen model photospheres (provided in increments of 200 K) in increments of 20 K to improve the fits. We find excellent agreement with effective temperatures inferred from literature spectral types (Luhman 1999; Luhman & Rieke 1998; Hartigan et al. 1994). For T* less than 3600 K, NextGen photospheres lack near-infrared opacity sources (Hauschildt et al. 1999a). As a result, model photosphere fits for these M dwarfs tend toward lower effective temperatures (up to 200 K) than those implied from their previously identified spectral types. The resulting fits in turn overpredict the observed 24 μm photometry by as much as 20%. For these sources, we fix the effective temperature in increments of 100 K to the literature spectral type. This approach provided the most consistent results in predicted 24 μm photospheric flux density with the method in Section 4.2 (Gautier et al. 2008). We tabulate the derived stellar parameters from our model photosphere fits in Table 3.
4.2. Ks–[24] and [24]–[70] Colors
To identify excesses at 24 and 70 μm, we use the effective temperatures derived in Section 4.1 and the Ks–[24] color relation derived from nearby (<5 pc) disk less main-sequence G, K, and M dwarfs in Gautier et al. (2008) to predict the expected photospheric flux densities at 24 μm:
where [24] is the magnitude converted from the 24 μm photometry with a zero-point flux of 7.14 Jy, and T* is the effective stellar temperature in Kelvin. At 70 μm we use a Rayleigh–Jeans extrapolation from the expected stellar flux at 24 μm.
We calculate the significance of the deviation of the measured photometry from expected photospheric flux densities, χ ≡ (Fν(observed) − Fν(predicted))/σν at 24 and 70 μm, where σν includes the detection S/N and flux calibration uncertainties. We list these values in Table 2 and plot them in Figure 1. We identify sources with χ70 > 5 as 70 μm excesses, and with χ24 > 5 as 24 μm excesses. In Figure 2, we plot F70/F* as a function of effective temperature for our sample. Figure 2 includes several strong detections of 70 μm disks reported here for the first time. In Figure 3, we plot the observed Ks–[24] colors for our sample as a function of effective stellar temperature. Figure 3 includes 11 detections of 24 μm disks reported here for the first time. While some of the new 24 μm disks have been previously analyzed in Chen et al. (2005b), the improved calibration uncertainties at 24 μm with the DAT pipeline have improved the sensitivity to small levels (e.g., ∼10%–15%) of flux density excess.

Figure 1. Distribution of detected 24 and 70 μm photometry relative to the expected photospheric values for all objects reported in this paper. χ70 is skewed to positive values since we are not sensitive to detect the photospheres for our entire sample, and nondetections are not included in the distribution. As a result, detections are more likely to be in excess than not. The rightmost bin corresponds to the total number of sources with χ>10. The red vertical dashed line represents the threshold we set for the detection of excess.
Download figure:
Standard image High-resolution image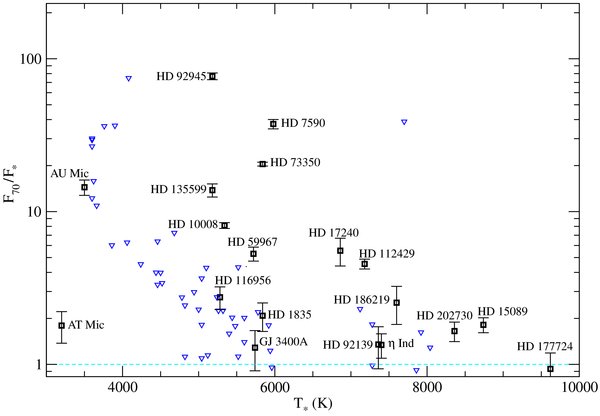
Figure 2. The observed 70 μm MIPS flux density (not color-corrected) divided by the expected photospheric flux density as a function of effective stellar temperature for our sample. 3σ upper limits from nondetections at 70 μm are plotted with blue triangles, and detections are plotted with black squares and name labels. The MIPS observations for some sources have been previously published (Table 2, Column 8). However, all photometry plotted are derived in this work and represent improved absolute flux calibration uncertainties and data reduction methods. We are less sensitive to 70 μm excess for cooler stars, introducing a bias in our sample.
Download figure:
Standard image High-resolution image
Figure 3. The observed Ks–[24] color as a function of stellar effective temperature for our sample. All colors plotted are rederived in this work as in Figure 2. The large (>0.2 mag) uncertainties for several sources are either due to the saturation of the Ks 2MASS images, or blending from companions at 24 μm. In green we plot the empirical model of the intrinsic stellar Ks–[24] colors for <5 pc main-sequence dwarfs derived in Gautier et al. (2008). Sources with χ24 > 5 are plotted in blue, indicating possible warm excesses.
Download figure:
Standard image High-resolution image4.3. Dust Disk Constraints
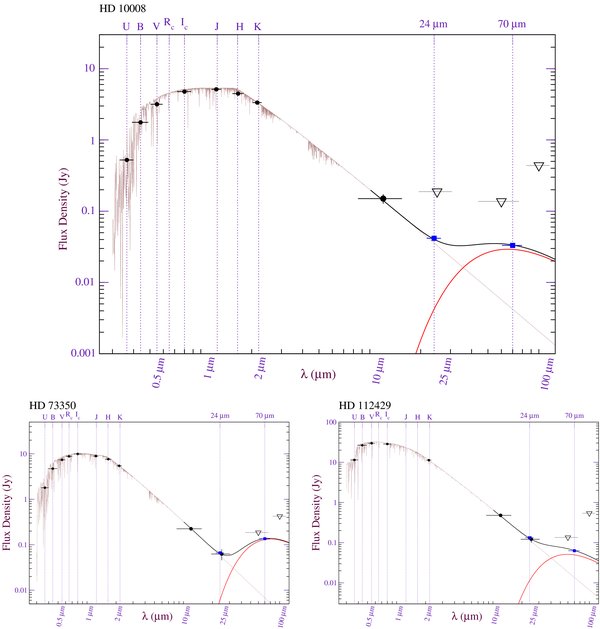
We list the derived dust disk parameters and 70 μm color corrected photometry in Table 4. To estimate the physical disk parameters—fractional infrared excess, dust temperature, dust mass, and orbital distance—for the stars with and without excesses in our sample, we assume that the debris disks are optically thin. After subtracting off the predicted photospheric flux density, we fit a single-temperature dust blackbody model to the 24 μm and 70 μm excess. The derived fractional infrared excesses are consistent with our model assumption of an optically thin disk. We estimate dust orbital radii assuming that the dust is in thermal equilibrium. We color correct the 70 μm photometry based on the dust temperature, using the color corrections outlined in the Spitzer Observer's Manual. The color corrections are <1% at 24 μm, and ∼10% at 70 μm. For the purposes of estimating upper limits to the observed fractional infrared excesses, we fit to 3σ upper limits for nondetections at 70 μm. In Figure 4, we plot the model photosphere and dust blackbody fits for stars with 70 μm detections. For the sources with 24 μm excesses and 70 μm nondetections, we estimate the fractional infrared excess at 24 μm with the assumption that LIR ∼ νFν(24 μm), after subtracting from Fν the expected stellar flux density contribution. We list this fractional infrared excess in Table 4 in addition to the upper limit derived from the 70 μm nondetection.
Download figure:
Standard image High-resolution image
Download figure:
Standard image High-resolution image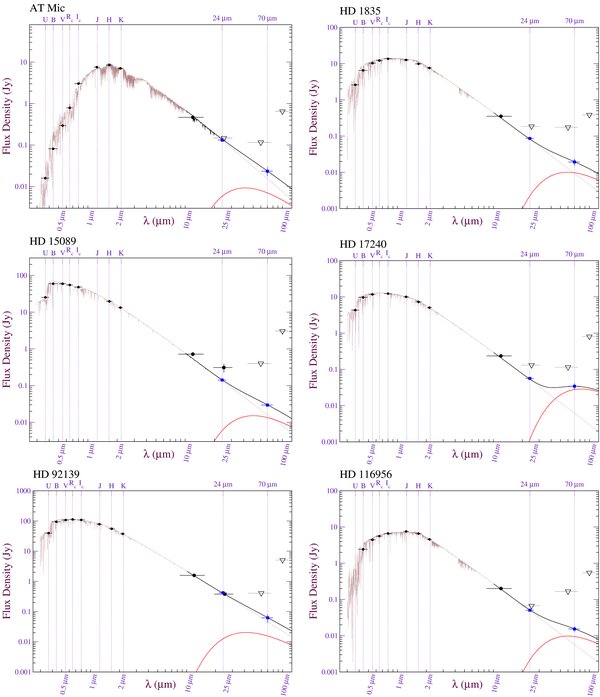
Download figure:
Standard image High-resolution image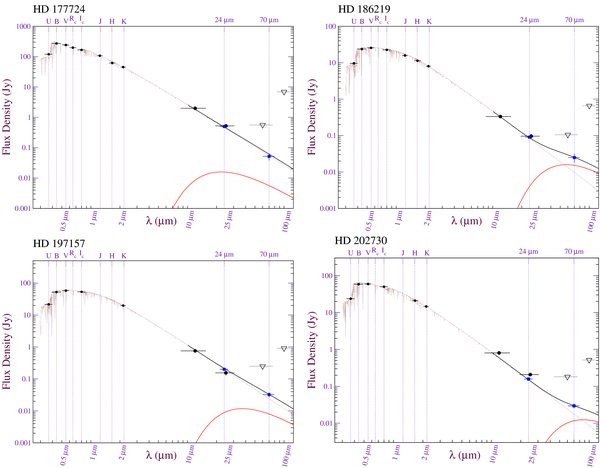
Figure 4. Spectral energy distributions (SEDs) for stars in our sample with 70 μm MIPS detections. Stars are ordered from top left to bottom right as they are in Table 2. First, four stars with 24 and 70 μm excesses are shown, followed by four stars with 70 μm excesses only, followed by two stars with 24 μm excesses only and 70 μm detections, and finally stars with photospheric 24 and 70 μm detections. Optical and near-infrared photometry are shown in black. MIPS color-corrected photometry are shown in blue, and IRAS color-corrected photometry are shown in black with 1σ uncertainties shown for detections. Open triangles are shown for 3σ upper limits. Horizontal error bars on photometry represent effective bandwidths. In light brown are the temperature-interpolated Phoenix NextGen synthetic spectra fit to the optical and near-IR photometry. In red is the dust component SED, and in black is the summation of the synthetic stellar SED and dust component SED depicting the total model flux at wavelengths longward of 10 μm.
Download figure:
Standard image High-resolution imageTable 4. Derived Stellar and Thin Dust Disk Model Dust Properties
| Name/HD | F70a (mJy) | Td (K) | Rd (AU) | log(LIR/L*)b | MD (Mmoon) | MPB (Mmoon) | log(LX/L*) |   c c |
Age (Myr) | Age Method | M* (M☉) |
|---|---|---|---|---|---|---|---|---|---|---|---|
| Stars with MIPS-24 and MIPS-70 excesses | |||||||||||
| 10008 | 33 ± 1 | <78 | >8.7 | −4.09 | 2.4E−05 | >0.11 | −4.44 | ⋅⋅⋅ | 275 ± 25 | 1,3 | 0.94 |
| 73350 | 136 ± 4 | <63 | >19 | −3.84 | 3.7E−04 | >0.6 | −4.80 | ⋅⋅⋅ | 513 ± 136 | 1,2,3 | 1.09 |
| 112429 | 63 ± 5 | <86 | >24 | −4.69 | 3.2E−04 | >0.2 | <−5.62 | ⋅⋅⋅ | 250 ± 200 | 5 | 1.56 |
| 135599 | 117 ± 12 | <62 | >12 | −3.88 | 6.6E−05 | >0.05 | −5.11 | 14 | 214 ± 17 | 3,4 | 0.92 |
| Stars with MIPS-70 excesses | |||||||||||
| 7590 | 259 ± 18 | <40 | >51 | −3.57 | 5.2E−03 | >1.1 | −4.69 | ⋅⋅⋅ | 462 ± 35 | 1,2,3 | 1.15 |
| 59967 | 39 ± 4 | <71 | >14 | −4.44 | 4.6E−05 | >0.12 | −4.46 | ⋅⋅⋅ | 353 ± 68 | 1,2 | 1.09 |
| 92945 | 341 ± 17 | <46 | >23 | −3.12 | 1.2E−03 | >1.0 | −4.47 | ⋅⋅⋅ | 294 ± 23 | 1,2 | 0.93 |
| AU Mic | 247 ± 28 | <59 | >6.8 | −3.36 | 2.0E−03 | >0.004 | −2.82 | ⋅⋅⋅ | 12 ± 2 | 4 | 0.31 |
| Stars with MIPS-24 excesses | |||||||||||
| GJ 3400A | 16 ± 5 | <200 | >2.2 | −4.86 | 7.6E−07 | >0.006 | −3.76 | ⋅⋅⋅ | 75 ± 25 | 4 | 1.03 |
| 123998 | ⋅⋅⋅ | <100 | >31 | −5.22 | 3.9E−04 | >0.35 | <−5.74 | ⋅⋅⋅ | 250 ± 200 | 5 | 1.77 |
| 175742 | ⋅⋅⋅ | <110 | >3.5 | −4.46,<−4.27d | 1.3E−06 | >0.002 | −3.18 | ⋅⋅⋅ | 51 ± 3 | 3 | 0.77 |
| AT Mic | 23 ± 5 | <120 | >1.0 | −4.24 | 3.0E−07 | >0.0003 | −2.82 | ⋅⋅⋅ | 12 ± 2 | 4 | 0.15 |
| BO Mic | ⋅⋅⋅ | <81 | >7.8 | −4.43,<−3.90d | 8.5E−06 | >0.003 | −2.16 | ⋅⋅⋅ | 25.5 ± 8.5 | 7 | 0.90 |
| 358623 | ⋅⋅⋅ | <88 | >2.7 | −4.32,<−3.70d | 2.8E−07 | >0.0003 | −3.36 | ⋅⋅⋅ | 12 ± 2 | 4 | 0.67 |
| Gl 907.1 | ⋅⋅⋅ | <93 | >3.9 | −4.48,<−3.91d | 1.3E−06 | >0.001 | −3.47 | ⋅⋅⋅ | 12.5 ± 5.5 | 7 | 0.60 |
| Stars with no MIPS excesses | |||||||||||
| 1835 | 19 ± 4 | <86 | >11 | <−4.97 | <8.5E−6 | ⋅⋅⋅ | −4.60 | ⋅⋅⋅ | 466 ± 55 | 1,2,3 | 1.09 |
| BB Scl | ⋅⋅⋅ | <260 | >1.1 | <−4.69 | <1.4E−7 | ⋅⋅⋅ | −3.45 | ⋅⋅⋅ | 180 ± 120 | 1,7 | 1.17 |
| 11131 | ⋅⋅⋅ | <91 | >9.2 | <−4.83 | <8.8E−6 | ⋅⋅⋅ | −4.39 | ⋅⋅⋅ | 506 ± 255 | 1,2,3 | 1.07 |
| 15089 | 30 ± 3 | <100 | >38 | <−5.47 | <5.1E−4 | ⋅⋅⋅ | −5.42 | ⋅⋅⋅ | 200 ± 150 | 5 | 1.87 |
| 16287 | ⋅⋅⋅ | <76 | >7.9 | <−4.41 | <7.5E−6 | ⋅⋅⋅ | −4.71 | 41 | 340 ± 252 | 2 | 0.88 |
| 16555 | ⋅⋅⋅ | <270 | >3.7 | <−5.21 | <5.3E−6 | ⋅⋅⋅ | −6.87 | ⋅⋅⋅ | 200 ± 150 | 5 | 1.56 |
| 17240 | 34 ± 7 | <62 | >48 | <−4.68 | <1.5E−3 | ⋅⋅⋅ | <−5.22 | ⋅⋅⋅ | 1100 ± 550 | 6 | 1.37 |
| DO Eri | ⋅⋅⋅ | <98 | >22 | <−5.21 | <1.1E−4 | ⋅⋅⋅ | <−5.31 | ⋅⋅⋅ | 160 ± 110 | 5 | 1.58 |
| v833 Tau | ⋅⋅⋅ | <73 | >7.4 | <−4.20 | <8.6E−6 | ⋅⋅⋅ | −3.09 | ⋅⋅⋅ | 15 ± 3 | 3 | 0.81 |
| 29697 | ⋅⋅⋅ | <77 | >5.1 | <−4.15 | <3.0E−6 | ⋅⋅⋅ | −3.21 | ⋅⋅⋅ | 49 ± 37 | 2,3 | 0.75 |
| Gl 182 | ⋅⋅⋅ | <69 | >6.5 | <−3.78 | <1.9E−5 | ⋅⋅⋅ | −3.18 | ⋅⋅⋅ | 9 ± 4 | 7 | 0.45 |
| 36435 | ⋅⋅⋅ | <100 | >5.6 | <−4.87 | <1.9E−6 | ⋅⋅⋅ | −4.79 | ⋅⋅⋅ | 504 ± 145 | 1,2 | 0.98 |
| AB Dor | ⋅⋅⋅ | <80 | >8.0 | <−4.31 | <1.2E−5 | ⋅⋅⋅ | −3.04 | ⋅⋅⋅ | 75 ± 25 | 4 | 0.91 |
| 41824 | ⋅⋅⋅ | <300 | >1.0 | <−4.71 | <2.0E−7 | ⋅⋅⋅ | −3.61 | ⋅⋅⋅ | 109 ± 9 | 3 | 1.38 |
| 41593 | ⋅⋅⋅ | <90 | >6.5 | <−4.72 | <3.1E−6 | ⋅⋅⋅ | −4.59 | ⋅⋅⋅ | 326 ± 93 | 1,2,3 | 0.93 |
| 51849 | ⋅⋅⋅ | <94 | >3.6 | <−4.16 | <1.6E−6 | ⋅⋅⋅ | −3.48 | ⋅⋅⋅ | 65 ± 25 | 7 | 0.71 |
| 52698 | ⋅⋅⋅ | <280 | >1.0 | <−4.74 | <3.1E−8 | ⋅⋅⋅ | −4.73 | 48 | 809 ± 379 | 1,2 | 0.89 |
| 63433 | ⋅⋅⋅ | <30 | >73 | <−4.75 | <5.1E−4 | ⋅⋅⋅ | −4.55 | ⋅⋅⋅ | 299 ± 96 | 1,2,3 | 1.03 |
| 72760 | ⋅⋅⋅ | <90 | >6.8 | <−4.70 | <3.9E−6 | ⋅⋅⋅ | −4.74 | 57 | 415 ± 194 | 1,2 | 0.94 |
| 74576 | ⋅⋅⋅ | <300 | >1.0 | <−3.75 | <9.6E−10 | ⋅⋅⋅ | −4.43 | ⋅⋅⋅ | 215 ± 94 | 1,3 | 0.84 |
| 92139 | 62 ± 19 | <120 | >21 | <−5.50 | <1.1E−4 | ⋅⋅⋅ | −5.76 | ⋅⋅⋅ | 100 ± 50 | 5 | 1.58 |
| 97334 | ⋅⋅⋅ | <100 | >8.0 | <−4.96 | <5.3E−6 | ⋅⋅⋅ | −4.53 | ⋅⋅⋅ | 451 ± 199 | 1,2,3 | 1.12 |
| TWA 14 | ⋅⋅⋅ | <50 | >8.7 | <−3.01 | <1.7E−4 | ⋅⋅⋅ | −3.00 | ⋅⋅⋅ | 8 ± 2 | 4 | 0.27 |
| TWA 12 | ⋅⋅⋅ | <60 | >7.5 | <−3.41 | <7.3E−5 | ⋅⋅⋅ | −2.57 | ⋅⋅⋅ | 8 ± 2 | 4 | 0.27 |
| TWA 13A | ⋅⋅⋅ | <50 | >14 | <−2.97 | <1.1E−3 | ⋅⋅⋅ | −3.26 | ⋅⋅⋅ | 8 ± 2 | 4 | 0.32 |
| TWA 13B | ⋅⋅⋅ | <50 | >15 | <−2.99 | <1.0E−3 | ⋅⋅⋅ | −3.29 | ⋅⋅⋅ | 8 ± 2 | 4 | 0.38 |
| 103928 | ⋅⋅⋅ | <67 | >38 | <−5.18 | <2.4E−4 | ⋅⋅⋅ | −6.23 | ⋅⋅⋅ | 440 ± 390 | 5 | 1.53 |
| 105963 | ⋅⋅⋅ | <90 | >6.7 | <−4.63 | <4.7E−6 | ⋅⋅⋅ | −4.39 | ⋅⋅⋅ | 266 ± 11 | 1,3 | 0.87 |
| 109011 | ⋅⋅⋅ | <87 | >6.4 | <−4.54 | <4.1E−6 | ⋅⋅⋅ | −4.65 | 50 | 348 ± 120 | 3 | 0.84 |
| TWA 15B | ⋅⋅⋅ | <37 | >9.7 | <−1.71 | <6.4E−4 | ⋅⋅⋅ | −2.41 | ⋅⋅⋅ | 8 ± 2 | 4 | 0.66 |
| TWA 15A | ⋅⋅⋅ | <35 | >10 | <−1.63 | <1.4E−3 | ⋅⋅⋅ | −2.37 | ⋅⋅⋅ | 8 ± 2 | 4 | 0.38 |
| TWA 16 | ⋅⋅⋅ | <53 | >9.4 | <−3.07 | <1.8E−4 | ⋅⋅⋅ | −3.17 | ⋅⋅⋅ | 8 ± 2 | 4 | 0.38 |
| 113449 | ⋅⋅⋅ | <76 | >8.6 | <−4.51 | <8.4E−6 | ⋅⋅⋅ | −4.26 | ⋅⋅⋅ | 212 ± 33 | 2,3 | 0.86 |
| TWA 17 | ⋅⋅⋅ | <51 | >7.1 | <−2.74 | <5.3E−5 | ⋅⋅⋅ | −3.02 | ⋅⋅⋅ | 8 ± 2 | 4 | 0.81 |
| TWA 18 | ⋅⋅⋅ | <52 | >6.8 | <−3.01 | <5.3E−5 | ⋅⋅⋅ | −2.98 | ⋅⋅⋅ | 8 ± 2 | 4 | 0.38 |
| 116956 | 15 ± 3 | <86 | >7.7 | <−4.64 | <5.6E−6 | ⋅⋅⋅ | −4.34 | ⋅⋅⋅ | 334 ± 96 | 1,2,3 | 0.98 |
| 125158 | ⋅⋅⋅ | <53 | >110 | <−3.87 | <1.0E−1 | ⋅⋅⋅ | <−5.61 | ⋅⋅⋅ | 125 ± 75 | 5 | 1.70 |
| 128987 | ⋅⋅⋅ | <73 | >11 | <−4.44 | <2.3E−5 | ⋅⋅⋅ | −4.85 | 54 | 623 ± 74 | 1,3 | 1.01 |
| 128400 | ⋅⋅⋅ | <130 | >4.1 | <−5.03 | <8.8E−7 | ⋅⋅⋅ | −4.86 | 62 | 795 ± 143 | 1,2 | 1.03 |
| 141272 | ⋅⋅⋅ | <83 | >7.5 | <−4.59 | <5.4E−6 | ⋅⋅⋅ | −4.40 | ⋅⋅⋅ | 567 ± 382 | 1,2,3 | 0.93 |
| 144197 | ⋅⋅⋅ | <110 | >26 | <−5.37 | <1.9E−4 | ⋅⋅⋅ | <−5.81 | ⋅⋅⋅ | 62.5 ± 12.5 | 5 | 1.75 |
| 148367 | ⋅⋅⋅ | <120 | >21 | <−5.58 | <8.2E−5 | ⋅⋅⋅ | −5.22 | ⋅⋅⋅ | 290 ± 240 | 5 | 1.77 |
| 165185 | ⋅⋅⋅ | <160 | >3.2 | <−5.14 | <5.6E−7 | ⋅⋅⋅ | −4.46 | ⋅⋅⋅ | 437 ± 186 | 1,2 | 1.13 |
| RE1816+541 | ⋅⋅⋅ | <57 | >5.1 | <−3.30 | <2.0E−5 | ⋅⋅⋅ | −2.86 | ⋅⋅⋅ | 115 ± 100 | 1,4 | 0.23 |
| 177724 | 52 ± 14 | <230 | >9.4 | <−5.75 | <2.1E−5 | ⋅⋅⋅ | −6.26 | ⋅⋅⋅ | 100 ± 50 | 5 | 2.30 |
| 180161 | ⋅⋅⋅ | <110 | >4.7 | <−4.92 | <1.2E−6 | ⋅⋅⋅ | −4.68 | ⋅⋅⋅ | 468 ± 61 | 1,2,3 | 0.96 |
| 186219 | 25 ± 7 | <89 | >30 | <−5.11 | <3.1E−4 | ⋅⋅⋅ | <−5.55 | ⋅⋅⋅ | 200 ± 150 | 5 | 1.68 |
| eta Ind | 32 ± 6 | <140 | >11 | <−5.41 | <1.6E−5 | ⋅⋅⋅ | <−5.91 | ⋅⋅⋅ | 250 ± 200 | 5 | 1.62 |
| SAO 145139 | ⋅⋅⋅ | <64 | >8.1 | <−3.98 | <1.3E−5 | ⋅⋅⋅ | −3.25 | ⋅⋅⋅ | 35 ± 7 | 7 | 0.79 |
| 202730 | 30 ± 4 | <59 | >76 | <−5.77 | <4.6E−4 | ⋅⋅⋅ | −5.11 | ⋅⋅⋅ | 150 ± 100 | 5 | 1.87 |
| 203244 | ⋅⋅⋅ | <53 | >21 | <−4.99 | <2.2E−5 | ⋅⋅⋅ | −4.58 | ⋅⋅⋅ | 334 ± 79 | 1,2 | 0.99 |
| LO Peg | ⋅⋅⋅ | <96 | >3.6 | <−4.15 | <1.8E−6 | ⋅⋅⋅ | −3.13 | ⋅⋅⋅ | 75 ± 25 | 4 | 0.71 |
| Gl 859A | ⋅⋅⋅ | <270 | >1.3 | <−4.96 | <2.0E−7 | ⋅⋅⋅ | −4.48 | ⋅⋅⋅ | 314 ± 63 | 1 | 0.99 |
| HK Aqr | ⋅⋅⋅ | <61 | >4.5 | <−3.48 | <8.2E−6 | ⋅⋅⋅ | −3.02 | ⋅⋅⋅ | 25.5 ± 12.5 | 7 | 0.29 |
| 218738 | ⋅⋅⋅ | <120 | >3.5 | <−4.61 | <1.3E−6 | ⋅⋅⋅ | −3.22 | ⋅⋅⋅ | 40 ± 8 | 7 | 0.85 |
Notes.
aColor-corrected to the dust temperature.
bUnless otherwise noted, the fractional infrared luminosity is determined from a single temperature blackbody fitted to the 24 and 70 μm photometry (or upper limit). 70 μm photometry are color-corrected to the maximum blackbody temperature as described in Section 4.4.
c yr−1.
dThe first fractional infrared excess uses the approximation LIR ∼ νFν at 24 μm after subtracting off the expected stellar flux density and ignoring the 70 μm flux density upper limit. The fractional infrared excess upper limit is derived from the 70 μm upper limit using the single-temperature blackbody fit as described in table note (b).
References. (1) X-ray–age correlation (Section 4.3; Mamajek & Hillenbrand 2008); (2) Calcium H&K emission–age correlation (Mamajek & Hillenbrand 2008, Section 4.3); (3) Rotation–age correlation (Mamajek & Hillenbrand 2008, Section 4.3,); (4) cluster/group membership; (5) Stromgren photometry (J. Stauffer 2000, private communication; Song et al. 2001; Song 2000); (6) Nordstrom (2004); (7) isochrone-fitting (Section 4.3; Seiss et al. 2000).
yr−1.
dThe first fractional infrared excess uses the approximation LIR ∼ νFν at 24 μm after subtracting off the expected stellar flux density and ignoring the 70 μm flux density upper limit. The fractional infrared excess upper limit is derived from the 70 μm upper limit using the single-temperature blackbody fit as described in table note (b).
References. (1) X-ray–age correlation (Section 4.3; Mamajek & Hillenbrand 2008); (2) Calcium H&K emission–age correlation (Mamajek & Hillenbrand 2008, Section 4.3); (3) Rotation–age correlation (Mamajek & Hillenbrand 2008, Section 4.3,); (4) cluster/group membership; (5) Stromgren photometry (J. Stauffer 2000, private communication; Song et al. 2001; Song 2000); (6) Nordstrom (2004); (7) isochrone-fitting (Section 4.3; Seiss et al. 2000).
We estimate dust masses as in Chen et al. (2005b), inferring the average grain size 〈a〉 using a collisional cascade grain size distribution power-law exponent of −3.5, with a minimum grain size set by the radiative blowout radius ab(〈a〉 = 1.32ab), and grain density of ρg = 2.5 g cm−3 (Equation (A22) in Section A.2.3). We assume that β = 1/2 is the threshold criterion for radiative blowout, where β is the ratio of radiation pressure to gravity for the purposes of calculating ab (Equation (A18), Section A.2.2). For the stars in our sample, only significant stellar winds of ∼  will affect the blowout radius (Sections A.1 and A.2.2). Such a large mass-loss rate is not supported by theoretical considerations and observations (Holzwarth & Jardine 2007), and hence only grain blowout by radiation pressure is relevant (Section A.1). We derive dust disk masses between 2.8 × 10⁻⁷ and 5.2 × 10⁻³ lunar masses for the disks in our sample. We estimate minimum parent body masses required to produce this dust between 3 × 10⁻⁴ and 1.1 lunar masses (Equation (A20)). The required minimum parent body masses are ∼103 times the derived dust disk mass. These results imply both a broad dynamic range in mass of debris disks, and a diverse variety of asteroid or Kuiper Belt extra-solar analogs.
4.4. X-Ray Luminosity, Age, Mass, and Stellar Wind Mass-Loss Rate Estimates
We estimate properties of the host stars in our sample that are relevant to the investigation of debris disk evolution and spectral-type dependence. In Table 4, we summarize the derived ages, age determination methods, masses, LX/L*, and stellar wind mass-loss rates.
4.4.1. X-Ray Luminosity
We derive X-ray apparent flux densities from ROSAT PSPC detected count rates using the conversion of Schmitt et al. (1995):
where no. of counts/s is the ROSAT count rate, and HR1 is the ROSAT hardness ratio no. 1. We require that optical source positions fall within the 1σ ROSAT position uncertainties to associate the ROSAT detections with our sample stars. We infer the fractional X-ray luminosity LX/L* and the X-ray flux density FX at the stellar photosphere using the derived stellar properties (radius, luminosity) from synthetic spectral fitting in Section 4.1.
4.4.2. Stellar Ages
We use five main methods to estimate ages for the stars in our sample—young moving group membership (<100 Myr), X-ray activity, Ca ii H&K activity, rotation periods, and fitting to theoretical isochrones. First, we assign ages based on cluster and association memberships to AU Mic, AT Mic, and HD 358623 (Beta Pic moving group; 12 Myr), to TWA association sources (8 Myr), and AB Dor moving group members AB Dor, GJ 3400A and LO Peg (75 ± 25 Myr). For sources with measured X-ray activity, rotation periods or Ca ii H&K activity, we estimate ages using activity–age correlation relations derived in Mamajek & Hillenbrand (2008). We use their Equations (A3), (12)–(14), and (3), respectively, with appropriate limits (e.g., B − V < 1.2, −5 < log(LX/L*) < −4.3). When two or three of these activity indices are measured, we adopt the mean and standard deviation as the final age estimate and uncertainty. When only a single indicator is available, we adopt an uncertainty of 20% for Ca ii H&K and X-ray activity. For rotation-based age estimates, we propagate the uncertainties in the coefficients of the fit in Mamajek & Hillenbrand (2008) to Equations (12)–(14), the relation first presented in Barnes (2007). We obtain age estimates for 46 of our 70 target stars using these first four age determination methods.
For eight of the remaining stars with T*< 6000 K and X-Ray activity implying ages <300 Myr, we fit the derived stellar radii and temperature in Section 4.1 to the Seiss et al. (2000) isochrones. We adopt average ages and uncertainties from the range of isochrone grid points that are consistent to within 5% of the derived stellar radius and temperature. The 5% criterion is chosen based on the estimated radius uncertainties in the fits in Section 4.1, the S/N of Hipparcos measured parallax, and to recover reasonable age uncertainties (∼50%). If a source is an unresolved binary, we adjust the derived radius appropriately before fitting to isochrones to avoid systematically underestimating the age. Three of the eight stars have measured lithium abundances that support the estimated ages. For stars that are implied to be young from measured activity indicators, the activity-based ages are consistent with isochrone fitting results. For 14 stars with T* > 6000 K, we use the average age estimates of Song (2000), Song et al. (2001), and J. Stauffer (2000, private communication) from fitting Stromgren photometry.
We are unable to estimate ages for two target stars using the above five methods. For the possible Pleiades moving group member RE 1816+541 lacking a trigonometric parallax, we assign an age of 115 Myr based upon the Pleiades age estimates from Messina et al. (2003) and Stauffer et al. (1998). Finally, we obtain an age estimate of 1.1 Gyr from Nordstrom (2004) for HD 17240 and adopt an age uncertainty of 50%.
In Figure 5, we plot the age distribution for our sample as a function of effective stellar temperature. The K and M stars in our sample are primarily selected from young moving groups whereas the A-G type stars are primarily selected from other indicators. As a result of these selection criteria, the stars in our sample cluster in age as a function of spectral type in Figure 5. The T* < 5000 K low-mass K and M dwarfs are younger than the 5000–6000 K G dwarfs and the T* > 6000 K stars, with median ages of 12.25 Myr, 340 Myr, and 200 Myr, respectively. This age bias limits comparisons across spectral types in our sample.

Figure 5. We plot the distribution of our sources as a function of stellar effective temperature and estimated age. Open black circles are stars without MIPS excess; open green squares with both 24 and 70 μm MIPS excesses; open red circles are stars with 70 μm MIPS excesses; open blue diamonds are stars with 24 μm excesses. Uncertainties in age and effective temperature are shown as lines centered on each symbol. See Section 4.3 for discussion.
Download figure:
Standard image High-resolution image4.4.3. Stellar Wind Mass-Loss Rates
We wish to consider stellar wind drag from stellar wind protons as a disk dissipation mechanism (Section A.1). In order to evaluate this mechanism, we estimate the stellar wind mass-loss rates for stars in our sample. If FX < 8 × 10⁵ erg s−1 cm−2 at the stellar surface (stars approximately older than 700 Myr), we can use the relation of Wood et al. (2002, 2005) to estimate stellar mass-loss rates,  :
:
where  yr−1. Seven stars with X-ray detections meet these criteria in our sample. We caution against estimating mass-loss rates from X-Ray activity for stars younger than ∼700 Myr or with FX > 8 × 10⁵ erg s−1 cm−2 (Wood et al. 2005). HD 135599 has an abnormally low X-ray luminosity given its estimated age of 214 ± 17 Myr, and also possesses a strong 70 μm excess.
4.4.4. Stellar Mass
We estimate stellar masses for our sample using the estimated stellar ages, effective temperatures, and the Seiss et al. (2000) isochrones. We use the estimated stellar mass in the calculations of dust disk properties and timescales. For a given age and the corresponding Seiss et al. (2000) isochrone, we linearly interpolate between the Seiss et al. (2000) stellar masses as a function of stellar effective temperature.
5. RESULTS
5.1. Stars with Excess
At 70 μm, we report the discovery of 70 μm excesses (χ70 > 5) for HD 7590, HD 10008, HD 59967, HD 73350, and HD 135599. We confirm the previously detected MIPS excesses for HD 92945, HD 112429, and AU Mic (Low et al. 2005; Chen et al. 2005b). We confirm that the Spitzer InfraRed Spectrograph (IRS) detected excess for HD 135599 extends to longer wavelengths (Lawler et al. 2009). The model photospheres and empirical colors from Sections 4.1 and 4.2 produce consistent values of χ70 at 70 μm. We do not confirm the previously published 70 μm excess for TWA 13A, and instead attribute the 70 μm emission to a nearby background galaxy (∼10''; Figure 6). Chen et al. (2005b) previously reported an excess for HD 177724 at 24 μm and 70 μm that was not easily described by a simple dust blackbody model for the excess. We instead attribute the previously reported excess to the large (0.28–0.36 mag) errors in the saturated J-, H- and Ks-band 2MASS photometry, and find that the MIPS photometry is consistent with the predicted photospheric flux density. For all stars with excesses at 70 μm, we PSF subtract the detected sources to look for extended residuals. AU Mic and HD 92945 show extended structures, and a detailed analysis will be presented in G. Bryden, et al. (2009, in preparation). The 70 μm residuals for AU Mic and HD 92945 appear aligned with the position angles of the disks resolved in scattered optical and near-infrared light (Kalas et al. 2004; Metchev et al. 2005; Krist et al. 2005a, 2005b), albeit at low S/N.

Figure 6. Left: 24 μm image of TWA 13, with the A and B components labeled in black and circled in white. A third background galaxy is also circled. The gray lines divide the image into quadrants, and the image is centered on TWA 13A. Right: 70 μm image at the expected position of TWA 13. The 70 μm emission is coincident with the background galaxy and not TWA 13A as previously published in Chen et al. (2005b) and Low et al. (2005). The same gray lines are used as in the 24 μm image, centered on the expected position of TWA 13A. Both the left and right images are to scale, with north up and east to the left (a 20'' line is shown in black).
Download figure:
Standard image High-resolution imageAt 24 μm, we report the discovery of 11 sources with 24 μm excesses (χ24 > 5). We identify flux density excesses for HD 10008 (16.6% ± 2.0%), GJ 3400A (13.9% ± 3.3%), HD 73350 (9.5% ± 1.9%), HD 112429 (11.1% ± 1.9%), HD 123998 (10.5% ± 2.7%), HD 135599 (10.7% ± 2.8%), HD 175742 (14.5% ± 2.2%), AT Mic (15.1% ± 4.2%), BO Mic (14.6% ± 3.3%), HD 358623 (11.4% ± 2.3%) and Gl 907.1 (9.1% ± 2.3%). We attribute these small excesses to warmer circumstellar material than responsible for a 70 μm only excess. The above uncertainties in the flux density excess are slightly larger than implied by the χ24 values in Table 2 because we include the uncertainties in the Ks-band flux density as an estimate of the model photosphere flux density uncertainty at 24 μm. Five of the 24 μm excess sources have effective temperatures between 3200 and 4800 K. Thus, this is one of the first reports of debris disks around cool, low-mass stars in addition to Forbrich et al. (2008).
5.1.1. Alternative Explanation for 24 μm Excess
We investigate the possibility that the small excesses we detect at 24 μm are not due to re-processed radiation from dusty debris disks. HD 10008, HD 73350, HD 112429, and HD 135599 also possess 70 μm excesses, supporting the assertion that our data and analysis are sensitive to ∼10% excesses at 24 μm. For the seven sources with 24 μm excesses and without 70 μm detections, the upper limits at 70 μm are consistent with a debris disk SED. Furthermore, excesses at 24 μm are more likely at younger ages. The stars with 24 μm excesses we identify are generally much younger than our overall sample age distribution.
However, an unknown low-mass spectroscopic companion—e.g., an M5 companion to a K0 star—could produce an apparent ∼10% flux excess at 24 μm. The occurrence of spectroscopic binaries in the field with the mass ratio required to reproduce the 24 μm excess is much less than the 10% (7/70) of stars for which we observe this excess (Hogeveen 1992). Nonetheless, we do not rule out low-mass companions for these sources. BO Mic and GJ 3400A possess published IRAC photometry, but the [8]–[24] colors are inconclusive as to which scenario is favored (Chen et al. 2005b). Positionally coincident background AGN and serendipitous asteroids could also account for the observed 70 and 24 μm excess, but are statistically unlikely for any given star (<1%). >0.1 mag stellar variability at the Ks-band could also produce an apparent 24 μm excess for noncontemporaneous observations.
We note that the distribution of Ks–[24] photospheric colors for low-mass stars is less constrained than it is for warmer stars. We compare the formal errors derived from the 24 μm S/N and Ks-band uncertainty, and compare it to the empirical Ks–[24] distribution after subtracting off the predicted photospheric color. We derive an empirical distribution uncertainty of 0.03 mag from a Gaussian fit, which is consistent with our formal propagated errors. Nine of the 11 24 μm excess sources lie >3σ in excess above the fit to the empirical distribution. The 10th, HD 112429, also possesses a 70 μm excess, and the 11th at 2.5σ, is 12.5 Myr 4240 K GJ 907.1. A 24 μm excess for GJ 907.1 is entirely plausible, but the excess for Gl 907.1 is the least robust detection of a 24 μm excess that we include in our results. For a sample size of 70 stars, we might expect ∼1 false-positive detection of excess from statistical fluctuations.
5.2. Disk Fraction
For our sample, we find an overall disk fraction of 21.4+5.6−4.1% (15/70). This disk fraction is smaller than the disk fraction for A stars (33% ± 5%; Su et al. 2006), slightly higher than for young G stars (14+11−7%; Carpenter et al. 2009; Hillenbrand et al. 2008; Meyer et al. 2005), and higher than the disk fraction for older, field G stars (12%–15%, Trilling et al. 2008; Bryden et al. 2006; Lagrange et al. 2000). We compute the 1σ uncertainties in the disk fraction using binomial statistics as in Burgasser et al. (2003). We list these values in Table 5 for a variety of subsamples.
Table 5. Sample Statistics
| 24 μm | 70 μm | 24 or 70 μm | |||||||
|---|---|---|---|---|---|---|---|---|---|
| Category | No. of Excesses | Disk Fraction | No. of Excesses | Disk Fraction | No. of Excesses | Disk Fraction | No. of Total | Median F70/F* Sensitivitya | Literature Comparison |
| ALL | 11 | 15.7+5.4−3.4% | 8 | 11.4+4.9−2.8% | 15 | 21.4+5.6−4.1% | 70 | 2.48 | 15%b |
| T* < 5000 K | 5 | 18.5+9.6−5.2% | 1 | 3.7+7.6−1.1% | 6 | 22.2+9.8−5.9% | 27 | 6.32 | ⋅⋅⋅ |
| 5000 K < T* < | 4 | 14.3+9.0−4.3% | 6 | 21.4+9.5−5.7% | 7 | 25.0+9.6−6.3% | 28 | 2.20 | 8.5%–19%, |
| 6000 K | 10%–20%c | ||||||||
| T* > 6000 K | 2 | 13.3+13.3−4.6% | 1 | 6.7+12.5−2.2% | 2 | 13.3+13.3−4.6% | 15 | 1.74 | 33%d |
| single stare | 7 | 15.9+7.0−4.0% | 6 | 13.6+6.8−3.6% | 10 | 22.7+3.0−5.0% | 44 | 2.64 | 15%a |
| all binaries | 4 | 15.4+9.6−4.6% | 2 | 7.7+8.6−2.5% | 5 | 19.2+9.8−5.4% | 26 | 2.29 | 23%f |
Notes. aThe median 24 μm S/N is 57 when including calibration uncertainties. The minimum excess reported is F24/F* = 1.09, and consequently the disk fractions listed are for F24/F* ≳ 1.1. At 70 μm, the median sensitivity is determined from the 3σ excess upper limit for detections and nondetections. bLagrange et al. (2000). cFractions are at 24 and 70 μm, respectively, from Meyer et al. (2008, 2007a). dSu et al. (2006). eBinarity as defined in Table 1; single star—no known companion; spectroscopic or unresolved binary, footnote (f) in Table 1, projected separations of 4–78 AU; wide or visual binary–footnotes (e), (g) in Table 1, projected separations of 137–4320 AU. fThe >3 AU binary separation 70 μm excess fraction (11/48) inferred from Table 4 in Trilling et al. (2007). The one 24 μm excess source identified in Trilling et al. (2007) at these separations is also in excess at 70 μm.
Download table as: ASCIITypeset image
5.2.1. Spectral Type
At 70 μm, we can detect debris disks that are generally >100% brighter than the expected photosphere (Figure 2). For the 15 stars in our sample with T* > 6000 K, we find a disk fraction of 13.3+13.3−4.6%. This is smaller than the disk fraction derived from analogous studies of A-type stars (33% ± 5%; Su et al. 2006), but the results are consistent to within 1σ given the small number statistics. In our sample 70 μm excesses are ∼6 times less common around stars with effective temperatures of less than 5000 K (3.7+7.6−1.1%) than around stars with effective temperatures between 5000 K and 6000 K (21.4+9.5−5.7%). These two disk fractions differ at the ∼2σ level. We observe this discrepancy even though the cooler stars have a younger median age in our sample (12.25 Myr versus 340 Myr). At younger ages, debris disks might be expected to be brighter by factors of a few. This paucity of late-type star debris disks at 70 μm has been found by, and is consistent with, several other more detailed studies (Hillenbrand et al. 2008; Gautier et al. 2008; Trilling et al. 2008; Beichman et al. 2006a, and references therein). The interpretation of our result is complicated and limited by several factors and selection effects in our sample that we consider in more detail in Section A.3.
At 24 μm, we can detect much smaller (∼10%–15%) excesses relative to the photosphere (Figure 3). When we include the detections of excesses at 24 μm, the disk fraction dependence on spectral type disappears. We find an overall disk excess fraction of 22.2+9.8−5.9% for stars with effective temperatures of less than 5000 K, and 25.0+9.6−6.3% for stars with effective temperatures between 5000 K and 6000 K. This result suggests that debris disks are just as common around cool stars as they are around hotter stars, but the dust disks around hotter stars may generally be more massive and brighter relative to the stellar photosphere. This result is consistent with the frequency of ∼40 Myr M dwarfs with 24 μm excesses identified in Forbrich et al. (2008).
5.2.2. Binarity
Our sample includes 24 known binary systems (Table 1), and constitutes a sample that has been fairly well studied for AO, wide separation, and spectroscopic companions. The binary completeness of our sample, however, is undoubtedly <100%. The incompleteness of the known binaries in our sample limits our interpretation, but we can make a tentative comparison. We do not identify a statistically significant difference between the disk fractions for binaries and single stars. We derive a single star disk fraction of 22.7+3.0−5.0% (10/44), and a binary disk fraction of 19.2+9.8−5.4% (5/26). Trilling et al. (2007) carried out an investigation of debris disks around A- and F-type binaries, and concluded that binaries have a higher disk fraction on average than single stars. We do not confirm this result when investigating lower mass stars, with the aforementioned caveats. Trilling et al. (2007) identified that tight (separations <3 AU) and wide separation (>50 AU) binaries have a higher disk fraction than intermediate separation binaries (3–50 AU). Our sample of binaries is evenly split between intermediate separation (12) and wide separation binaries (14), and we find 3 and 2 debris disks in each category, respectively.
5.3. Age
In Figure 7, we plot the fractional infrared excess as a function of stellar age in our sample. We overplot a t−1* power law consistent with collisional evolution of debris disks (Section A.2.1; e.g., Wyatt 2008, 2007; Rieke et al. 2005). The data are not consistent with this power-law evolution. However, the youngest stars in our sample (e.g., <100 Myr) are dominated by the coolest stars (T* < 5000 K) and vice versa. Consequently, this bias masks any true underlying trend in LIR/L* versus age. We caution against drawing any significant conclusions from this figure. The dependence of debris disk frequency and brightness at 24 and 70 μm has been investigated in other more detailed studies (e.g., Carpenter et al. 2009; Trilling et al. 2008; Su et al. 2006, and references therein). Carpenter et al. (2009) and Trilling et al. (2008) both note that the 70 μm age evolution for the disk frequency and disk brightness for solar-type stars does not decrease with age as strongly as is observed for A-type stars (Su et al. 2006; Rieke et al. 2005).

Figure 7. Fractional infrared excess as a function of estimated age for all stars in our sample. Open green squares are stars with both 24 and 70 μm MIPS excesses; open red circles are stars with 70 μm MIPS excesses; open blue diamonds are stars with 24 μm excesses; open downward triangles are upper limits for stars with no excess derived from the 70 μm flux upper limit. Uncertainties in age are shown as horizontal lines. A t−1* power-law decay consistent with collisional disk evolution is shown as a black dotted line. Due to 70 μm sensitivities, this plot is incomplete for log(LIR/L*) < −4.5 and ages less than ∼50–100 Myr.
Download figure:
Standard image High-resolution imageFive of the seven 24 μm excess sources without large 70 μm excesses are younger than ∼50 Myr. This age range is consistent with the epoch of terrestrial and icy planet formation (e.g., Kenyon & Bromley 2008; Currie et al. 2008b), and is much younger than the median age of our sample (200 Myr). The average age of stars with T* < 5000 K is 21 Myr and 60 Myr for stars with and without detected infrared excess, respectively (at either 24 or 70 μm). For comparison, the averages are 312 Myr and 395 Myr, respectively, for 5000 K < T* < 6000 K stars. The stars with excesses tend toward younger ages, and this is consistent with a collisional-cascade production of dust from parent bodies (Wyatt 2008, and references therein).
5.4. Stellar Rotation Period
In Figure 8, we plot the fractional infrared excess as a function of stellar rotation period for our sample for all stars with T* < 6000 K. We use measured stellar rotation periods when available in Table 1. If not, we estimate the rotation period from measured vsin i rotational velocities in Table 1, estimated radii in Table 3, and we assume an average rotation axis inclination with respect to our line of site of 30°. For HD 92945, we assume the star matches the inclination of the debris disk, estimated to be 25° from edge-on (Krist et al. 2005b).

Figure 8. Fractional infrared excess as a function of measured or estimated stellar rotation periods for stars in our sample with T* < 6000 K. We choose 6000 K to be consistent with our previous subgrouping of our sample and to select stars with only convective atmospheres (there are no stars in our sample between 6000 and 6800 K). Green squares are stars with 24 and 70 μm MIPS excesses; red circles are stars with 70 μm MIPS excesses; blue diamonds are stars with 24 μm excesses. Filled symbols indicate a measured period; open symbols indicate a period estimated from v sin i and the radius from the SED fit.
Download figure:
Standard image High-resolution imageWe identify a weak correlation between rotational periods and observed fractional infrared excesses for stars with excess. We derive a Spearman rank correlation coefficient ρs = 0.35. Our sample spans an age range older than the sample in Rebull et al. (2008), who report a similar weak correlation between rotation and excess for stars in the 12 Myr Beta Pic moving group. Our observations support the premise presented in Rebull et al. (2008) and Currie et al. (2008a) that massive primordial disks evolve into massive debris disks. Massive primordial disks regulate the initial angular momentum evolution of stars before the primordial disks dissipate, and the persisting excess–period correlation for debris disks is an echo of the primordial disk rotation correlation. A correlation between rotation and excess was also presented in Stauffer et al. (2007). Stauffer et al. (2005) identified three debris disks in the ∼100 Myr Pleiades, and did not identify any anticorrelation between excess and rotational velocity.
5.5. Activity Indicators
In our sample, stars with 24 μm excess appear well mixed with nonexcess stars for X-ray-saturated stars with log(LX/L*)> − 4. Rotation periods between ∼5.5–7 days are favored for the detection of 70 μm excess around stars with log(LX/L*) < −4. We do not identify any significant correlations of fractional infrared excess with either the lithium abundance or the activity index R'HK. We do however note in Section 6.1.3 and Figure 9 that the bright 70 μm excess stars are outliers when computing the ratio of the rotation period to both log (LX/L*) and R'HK. Given our small sample size and broad age and spectral-type ranges, this trend is intriguing but inconclusive and possibly spurious.

Figure 9. Fractional infrared excess plotted as a function of the negative ratio of the measured rotation period to the logarithm of the fractional X-ray luminosity. X-ray activity increases to the right, and period increases to the right. Red circles are stars with 70 μm MIPS excesses (HD 135599, HD 7590, and HD 73350); upper limits for stars without 24 or 70 μm excesses are shown with open black triangles. Only stars with measured rotation periods and X-ray fluxes with −5 < log(LX/L*) < −4.3 are included (t* > ∼ 300 Myr).
Download figure:
Standard image High-resolution image
For the seven stars with FX < 8 × 10⁵ erg s−1 cm−2, we can use the X-ray luminosity as a proxy for stellar wind mass loss rate (Section A.2, Plavchan et al. 2005; Wood et al. 2005). We find that the smallest mass-loss rate in this subsample is seen for the only star with an excess—HD 135599. The other six stars possess excess upper limits considerably smaller than the excess detected for HD 135599. At a fixed age, such an anticorrelation is expected from the steady-state model of Plavchan et al. (2005) and has been tentatively observed in the younger Sco–Cen association (Chen et al. 2005a). Since we only have seven stars in this subsample and only one detected excess, we cannot draw any conclusions except to note that these observations do not contradict the steady-state model of Plavchan et al. (2005).
6. DISCUSSION
In Section 6.1, we present notes about the stars in our sample with the brightest excesses. In Section 6.2, we discuss the impact of various grain removal mechanisms on debris disk evolution and for the debris disks in our sample. These mechanisms are presented in detail in the Appendix.
6.1. Individual Star Notes
6.1.1. AU Mic
Since the discovery of a resolved disk around AU Mic in Kalas et al. (2004), much work has been done to characterize and model AU Mic's debris disk (Fitzgerald et al. 2007; Strubbe & Chiang 2006; Quillen et al. 2007; Krist et al. 2005a, 2005b; Metchev et al. 2005). Our updated 70 μm flux density measurement should not significantly alter interpretations. We update the application of the stellar wind drag steady-state model to AU Mic in Plavchan et al. (2005). The discovery in Wood et al. (2005) that X-ray activity does not correlate with stellar wind mass-loss rates for FX > 8 × 10⁵ erg s−1 cm−2 invalidates the application in Plavchan et al. (2005) of a steady-state stellar wind drag model to AU Mic; AU Mic possesses an X-ray surface flux density of ∼1.8 × 10⁷ erg s−1 cm−2. We estimate the grain–grain collision timescale within the "birth ring" at 43 AU (the location of the dust-producing ring of parent bodies; Strubbe & Chiang 2006) to be ∼104 times shorter than the stellar wind drag timescale for  , a dust disk mass of 10−2 M⊕, and a disk width of 4.3 AU (Equation (A23), Section A.2; Fitzgerald et al. 2007; Metchev et al. 2005; Liu et al. 2004; Augereau & Beust 2006). The evolution of the AU Mic debris disk is currently dominated by grain–grain collisions and the presence of any approximately Jovian mass planets (Section A.2).
6.1.2. HD 135599
For this K0 star (∼1/3 L☉), the inferred mass-loss rate implies that the drag timescale from stellar wind is ∼10 times shorter than Poynting–Robertson (P–R) drag (Equations (A8)–(A10), Sections A.1 and A.2). The stellar wind drag timescale is ∼0.4 times the grain–grain collision timescale (Equations (A14) and (A23)) for the dust radius (12 AU) and dust mass (6.6 × 10⁻⁵ Mmoon) estimated in Table 4 (Section 4.3). This implies that stellar wind drag is dynamically important in the evolution of the dust in this disk, and makes HD 135599 a canonical example to study the transition between disk evolution dominated by grain–grain collisions and drag-force-dominated disk evolution (Sections 6.2 and A.2.3). The Spitzer IRS spectra of HD 135599 are consistent with the "power-law" excess predicted for a drag-force-dominated debris disk (e.g., Fν(dust)∝να, Sections 6.2 and A.2 in this paper; Lawler et al. 2009). A more accurate dust mass measurement from submillimeter observations and high-contrast imaging to obtain radial surface brightness profiles is warranted to clarify this interpretation further.
A power-law extrapolation of the IRS excess for HD 135599 predicts a flux at 70 μm that is smaller than what is observed (Lawler et al. 2009). This implies that the entire disk for HD 135599 is not described by a single dominant dust removal mechanism. Due to the different power-law dependences on orbital distance for drag forces and grain–grain collisions, and because the collisional timescale depends on the local dust disk density, the evolution of dust at different orbital radii can be dictated by different dust removal mechanisms (Section A.2). For HD 135599, it is plausible that there is a ring of parent bodies producing dust through mutual collisions where the dust collision timescales are short relative to the stellar wind drag timescale, but not significantly shorter. This would produce the "excess excess" seen at 70 μm. Then, a fraction of the dust produced in the ring spirals inward under the action of stellar wind drag into smaller orbital radii where the collisional timescales become longer than the drag force timescales. This would then explain the observed IRS power-law excess.
6.1.3. HD 7590, HD 73350, HD 92945, and HD 135599: An Activity–Excess Anticorrelation?
We consider the large fractional infrared excesses (F70/F* > 10) observed for HD 7590, HD 73350, HD 92945, and HD 135599 (the "bright disk stars"). For HD 7590, HD 73350 and HD 135599, the stellar ages inferred from X-ray activity and R'HK tend toward older ages, whereas ages inferred from rotation periods tend toward younger ages.7 This trend is not present for stars with no excess, and follows directly by comparing the ratio of the three activity indices. Within our sample, HD 7590, HD 73350, and HD 135599 are outliers when computing the ratio of the rotation period to both log(R'HK) and log(LX/L*) (Figure 9). Given the small size of our sample, this result is inconclusive and may be spurious. A more rigorous treatment with a larger debris disk sample of solar-type stars with measured rotation periods and activity indices is warranted.
If HD 7590, HD 73350, and HD 135599 are younger than we estimate from X-ray and R'HK activity, then the activity for these stars are abnormally low. This presents the possibility that stars with large excesses are more likely to be less active at a given age. This anticorrelation between activity and excess is consistent with the possibility that stellar wind drag is the dominant grain removal mechanism (Section A.1). At a fixed age, stellar wind drag predicts that less active stars will have brighter disks due to the longer wind drag timescales (Section A.2; Chen et al. 2005a). However, at these ages of <700 Myr, X-ray activity is not a reliable proxy for stellar wind mass-loss rate as discovered in Wood et al. (2005). Alternatively, this anti-correlation is also consistent with massive debris disks evolving from massive primordial disks, which in turn regulated the host star angular momentum (Currie et al. 2008a).
A second hypothesis is that the "bright disk stars" are undergoing an epoch of enhanced planetesimal collisions akin to the Late Heavy Bombardment within our own solar system when it was ∼700 Myr old (Kleine et al. 2002; Chambers 2004; Gomes et al. 2005; Strom et al. 2005). HD 10008, HD 59967, and HD 123998 also fall within the estimated age range of 200–500 Myr.
6.2. The Transition Between Grain–Grain Collisions and Drag Forces in Disk Dynamical Evolution—Observational Predictions
Dust is produced in debris disks via a collisional cascade of dust grains that result from the collision of parent bodies. The collisions of parent bodies decay with time (e.g., Wyatt 2008; Kenyon & Bromley 2005, and references therein). The evolution of the observable debris disk depends on the how the dust is removed from the system, primarily thought to occur through drag forces causing dust to spiral into the star (drag force dominated), radiative blowout as the end stage of a collisional cascade of dust grains (collision dominated), and/or planet–dust interactions (Section A.2). Drag-force-dominated disk evolution predicts a constant vertical optical depth as a function of orbital radius. This produces a power-law infrared spectrum, where Fν(dust) ∝να over a wavelength regime consistent with the orbital distances of the in-spiraling dust in thermal equilibrium, and α varies from ∼ −1 to 3 depending on the wavelength dependence of the grain emissivity (Section A.2.2). This is in contrast to a dust excess consistent with a single-temperature blackbody, such as produced by a single ring of dust (Section A.2.1). Collision-dominated disks are necessarily relatively bright (log(LIR/L*) ∼ −3 to 4). Resolved collision-dominated debris disks are typically consistent with the ring geometry (e.g., Kalas et al. 2008; Fitzgerald et al. 2007; Telesco et al. 2005; Krist et al. 2005a, 2005b; Kalas et al. 2004; Stapelfeldt et al. 2004), and the IRS excess spectra consistent with a single-temperature blackbody (e.g., Morales et al. 2009; Chen et al. 2006).
To evaluate the importance of different grain removal mechanisms in our observed debris disks, we calculate the ratio of the drag timescales to the grain–grain collision timescales using Equation (A23) (Section A.2.3). This ratio is approximately equal to or less than 1 at the minimum dust orbital radii and dust disk masses inferred for HD 10008, GJ 3400A, HD 59967, HD 123998, HD 175742, AT Mic, BO Mic, HD 358623, and Gl 907.1 (hereafter the "faint disk stars"). This ratio suggests that dust could be removed under that action of drag forces before they are blown out from radiation pressure and collisional grinding. The fractional infrared excesses range from (6–80) × 10−6 for the "faint disk stars." These "faint disk stars" possess flux excesses that are smaller than have been typically investigated previously with Spitzer at 70 μm (e.g., log(LIR/L*) ≳ −4; Carpenter et al. 2009; Hillenbrand et al. 2008; Trilling et al. 2008; Bryden et al. 2006; Beichman et al. 2006a). Consequently, with this sample we are probing a dust dynamics regime previously unexplored. From the ratio of collision and P–R/wind drag timescales, we infer that the transition between collisional-cascade disk evolution to P–R drag disk evolution could occur at a fractional infrared luminosity as high as LIR/L* ∼ 8 × 10⁻⁵ (Section A.2.3). This result is in disagreement with the conclusions of Wyatt (2005) and Dominik & Decin (2003) which predict a transition at LIR/L* ∼ 4 × 10⁻⁷, more than two orders of magnitude fainter.
The Spitzer IRS power-law spectrum for HD 135599 is a canonical example for the transition of the dominant dust dynamical mechanisms in a debris disk, with LIR/L* = 1.0 × 10⁻⁴ (Section 6.1.2). A detailed IRS study of debris disks with a range of fractional infrared excess would further test this hypothesis, and this has been carried out in Lawler et al. (2009) and Morales et al. (2009). Lawler et al. (2009) and Morales et al. (2009) find IRS excesses that are consistent with a power law for excesses between LIR/L* ∼ 3 × 10⁻⁶ and LIR/L* ∼ 3 × 10⁻⁵. This fractional infrared excess range is coincident with the fractional infrared excesses of the "faint disk stars." As noted for HD 135599 in Section 6.1.2, the transition from grain collision-dominated disk evolution to drag-force-dominated disk evolution is not a sharp transition. Most disks in transition between collision timescales and drag timescales for dust removal will have different evolutionary dynamics at different orbital radii. Rings of parent bodies will produce dust locally that will initially be subject to grain–grain collisions, but drag forces can act to fill in the interior parts of the disk (e.g., Strubbe & Chiang 2006).
For HD 7590, HD 73350, HD 92945, HD 112429, HD 135599, and AU Mic, stellar winds of ∼3–600 times solar are necessary for drag force timescales to overcome grain–grain collisions in dictating the disk evolution. While this is feasible for the ages of these stars, an important observational test is infrared spectra. Spitzer IRS observations of AU Mic and HD 92945 do not show the power-law behavior expected if drag forces are the dominant grain removal mechanism (C. Chen 2006, private communication). This implies that the stellar wind mass-loss rates are less than ∼50  , and the evolution of these disks are dictated by the grain–grain collision timescales.
Finally, we note that planets of sufficient mass can truncate the inward spiral of dust grains under the action of drag forces before the dust reaches the sublimation radius (Equation (A30) and Section A.2.4). The presence of a power-law excess can be used to place an upper limit to the mass of any planet orbiting within the orbital radii of observed dust.
7. CONCLUSIONS
Infrared photometry provides basic constraints on fractional flux excess, dust temperature, and dust orbital radii in debris disks associated with young planetary systems. We identify new 70 μm excesses for HD 7590, HD 10008, HD 59967, HD 73350, and HD 135599, and constrain their dust disk properties. We confirm the excesses at 70 μm previously identified for HD 92945, HD 112429, and AU Mic. We present the discovery of 24 μm excesses for HD 10008, GJ 3400A, HD 73350, HD 112429, HD 123998, HD 175742, AT Mic, BO Mic, HD 358623, and Gl 907.1, and confirm the 24 μm excess for HD 135599.
Within our 70 star sample selected for youth indicators, we find that large 70 μm excesses (Ld/L* > 10−4) associated with debris disks are more common around ∼200–500 Myr solar-type stars with T* > 5000 K than for ∼8–50 Myr stars with T* < 5000 K. We find that small 24 μm excesses (Ld/L* < 10−4) associated with debris disks are equally common among young stars of all spectral types. The tentative correlations we present with activity indicators are speculative given the small and nonuniform sample, but suggest a more detailed investigation is warranted.
From arguments presented in the Appendix and in Section 6.2, we predict that drag forces are relevant compared to grain–grain collisions for the dynamical evolution of disks around G-M dwarfs with LIR/L* < 10−4. We find that stellar wind drag is more important than P–R drag for removing dust around K and M dwarfs with these fractional infrared excesses, and possibly for G dwarfs as well.
This work is based [in part] on observations made with the Spitzer Space Telescope, which is operated by the Jet Propulsion Laboratory, California Institute of Technology under a contract with NASA. Support for this work was provided by NASA. This publication makes use of data products from the Two Micron All Sky Survey, which is a joint project of the University of Massachusetts and the Infrared Processing and Analysis Center/California Institute of Technology, funded by the National Aeronautics and Space Administration and the National Science Foundation. This research has made use of the NASA/IPAC Infrared Science Archive, which is operated by the Jet Propulsion Laboratory, California Institute of Technology, under contract with the National Aeronautics and Space Administration. This research has made use of the SIMBAD database, operated at CDS, Strasbourg, France. This research has made use of the NASA Star and Exoplanet Database (NStED), operated by the Infrared Processing and Analysis Center, California Institute of Technology, under a contract with NASA.
Thanks to Geoff Bryden, Farisa Morales, and Thayne Currie for their conversations and comments. We thank the anonymous referee for a thorough referee report.
APPENDIX
In Section A.1, we present a brief overview of stellar wind drag. In Section A.2 we summarize and update equations for the grain lifetimes due to grain–grain collisions, stellar wind forces, radiative forces, and the presence of planets. This section can serve as a reference to quickly evaluate the relative importance of these processes in debris disk evolution and dynamics. These processes are discussed in more detail in Hillenbrand et al. (2008), Krivov (2007), Krivov et al. (2007), Krivov et al. (2006), Quillen (2006), Strubbe & Chiang (2006), Minato et al. (2006), Najita & Williams (2005), Plavchan et al. (2005), Chen et al. (2005b), Wyatt (2003, 2005), Dominik & Decin (2003), Jura et al. (1995), Gustafson (1994), and Backman & Paresce (1993). In Section A.3, we present five factors that affect the interpretation of the debris disk fraction as a function of spectral type in Section 5.2.1.
A.1. Stellar Wind Drag Primer
Plavchan et al. (2005) and Minato et al. (2006) propose that stellar wind drag acting on dust grains in a debris disk could account for the relative paucity of late-type stars older than ∼50 Myr with detectable infrared excess. For our Sun, protons from the solar wind produce a radial outward pressure, ∼3 × 10³ times smaller in magnitude than the analogous radiation pressure (Gustafson 1994). Radiation pressure also gives rise to the P–R drag force that is reduced in magnitude from the radial component by a factor of vorb/c, the ratio of the dust grain orbital velocity to the speed of light. Stellar wind pressure also has an analogous drag term, reduced in magnitude from the radial component by a factor of vorb/vsw, where vsw is the stellar wind velocity. This factor is the aberration angle of the protons seen by a dust grain as it orbits a star. A dust grain preferentially forward scatters stellar wind protons in the direction it is traveling, causing it to lose angular momentum and slowly spiral inward toward the star. Since stellar wind velocities are on the order of a few hundreds of km s−1, it follows that vorb/vsw ∼ 103 vorb/c. While stellar wind radial pressure is effectively negligible compared to radiation pressure for dust dynamics around solar-type stars, the drag terms are instead comparable in magnitude.
For the Sun, the strength of stellar wind drag is ∼1/3rd the strength of P–R drag (Gustafson 1994). From Section A.2, we find that stellar wind drag will be more important than P–R drag for stars with mass-loss rates comparable to the Sun and stellar luminosities less than 1/3 L☉—e.g., K and M dwarfs—and for stars with enhanced mass-loss rates—e.g., young stars. As an example, for an ∼1/3 L☉ K dwarf, a mass-loss rate of 5 time solar would lead to a stellar wind drag force that is 5 times stronger than P–R drag. This in turn shortens dust lifetimes by a factor of 5, and lowers the observable fractional infrared excess compared to a disk with only P–R drag considered. This follows directly from Equation (A10) and Plavchan et al. (2005).
Quantitatively evaluating the relevance of stellar wind drag in low-mass star debris disk evolution is complicated by the uncertainty in the strength and evolution of stellar winds from low-mass stars. Recent observations confirm that stellar winds from M dwarfs in M dwarf—white dwarf binaries are ∼5 × 10⁻³ to 10 times the mass-loss rate from the Sun at ages of several Gyr (Schmidt et al. 2007; Debes 2006). Additionally, Wood et al. (2005) observe that stellar wind mass-loss rates correlate with X-ray activity, implying that young stars also have higher mass-loss rates and hence shorter dust grain lifetimes under the action of stellar wind drag. However, for stars younger than ∼500–700 Myr, the correlation in Wood et al. (2005) breaks down, and the X-ray luminosity cannot be used as a direct proxy for measuring the stellar wind mass-loss rate. Young late-type stars exhibit enhanced X-ray activity, but this is not a direct indication of a correspondingly large radial stellar wind mass-loss rate. Measuring stellar wind mass-loss rates and their evolution from young (∼5–500 Myr), low-mass stars remains an open problem.
We can use the relation of Wood et al. (2005) to infer that M dwarfs older than ∼700 Myr, such as the M dwarfs observed in Gautier et al. (2008), possess mass-loss rates per units surface area that are comparable to solar-type stars. For a dust disk comparable in mass to the zodiacal dust cloud in our solar system, the stellar wind drag timescale will be shorter than both the P–R drag and grain–grain collision timescales, and the disk evolution will be dominated by stellar wind drag. This can account for the lack of older M dwarfs with observed debris disks (Gautier et al. 2008; Minato et al. 2006; Plavchan et al. 2005). We explore the role of stellar wind drag relative to other grain removal processes in more detail Section A.2.
A.2. Dust Grain Removal timescales
A.2.1. Grain–Grain Collisions
The average time for a grain to collide with another grain is estimated with the expression in Minato et al. (2006); Najita & Williams (2005) as
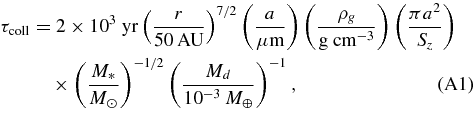
where a is the grain radius, r is the dust orbital distance, ρg is the dust grain density, M* is the stellar mass, Md is the dust mass, M☉ is the solar mass, M⊕ is the Earth's mass, and (πa2/Sz) = 1/Qcoll, the ratio of the effective grain–grain collision cross section to the geometric cross section (Qcoll ∼ 1).
Equation (A1) relies on two important assumptions. First, the grains are assumed to be sufficiently inclined in their orbits to see the full vertical optical depth of the disk at the orbital radius of the grain (the grain traverses the full optical depth of the disk twice as it orbits the parent star). For optically thin debris disks, the average grain inclination should approximate the ratio of the scale height of the dust disk to the orbital distance, h/r.
For the second assumption, the dust is assumed to be evenly distributed over a disk surface area πD2OUT. This second assumption is only valid when the entire dust mass Md is interior to the orbital distance under consideration, i.e., r = DOUT. In this sense, τcoll in Equation (A1) represents the timescale for all grains at the disk outer radius DOUT of size a and density ρg in an entire disk of mass Md to undergo a collision.
With approximately a dozen bright, spatially resolved disks, the observed dust geometries are primarily narrow rings (Kalas et al. 2008; Fitzgerald et al. 2007; Krist et al. 2005a, 2005b; Telesco et al. 2005; Marsh et al. 2005; Stapelfeldt et al. 2004; Kalas et al. 2004; Holland et al. 2003; Wahhaj et al. 2003; Heap et al. 2000; Schneider et al. 1999; Jayawardhana et al. 1998). Here, we update Equation (A1) and do away with the second assumption to avoid misapplication of collisional timescales as a function of orbital radius, and to make more realistic estimates.
We define the radial surface density profile Σr(r) such that
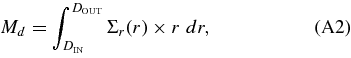
where DIN and DOUT are the inner and outer disk radii, respectively, and we have assumed azimuthal symmetry. Note we have incorporated the constant from the azimuthal integration into Σr(r). Then the general form for Equation (A1) becomes
From Equation (A2), if we set DIN = 0, and Σr(r) = Σ'0, we get that Σr(r) = Σ'0 = 2MD/D2OUT, and we recover Equation (A1).
We consider a generic radial surface density profile of

with inner and outer disk radii DIN and DOUT, which can be set appropriately depending on α. From Equation (A2), we find
and Equation (A3) becomes
where
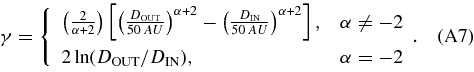
The gamma factor in Equations (A6) and (A7), encapsulating the disk geometry, is important for estimating grain lifetimes. For example, consider a ring of dust at radius Dring and width ΔDring = 0.1Dring. The collision timescale estimate in Equation (A1) will differ from the actual collision timescale by a factor of γ ∼ 2ΔDring = 0.2 for α = −2 or 0, and overestimate the collision frequency for any of the dust that is scattered or dragged out of the ring. As a second example, we consider α = −1.5 with DIN = 0 AU and DOUT = 200 AU. The collision time as a function of orbital distance will scale as r3, and the collision timescales will be γ = 8 times longer.
A.2.2. Radiative and Stellar Wind Drag
A drag force removes angular momentum from an orbiting dust grain, causing it to spiral into the star. The time for a dust grain to spiral into a star under the action of P–R drag is estimated in Minato et al. (2006) as
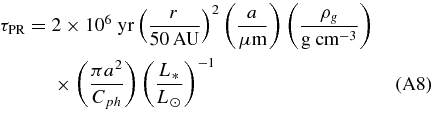
where (πa2/Cph) = 1/Qrad, where Qrad is the radiative coupling coefficient, the ratio of the effective to geometric cross sections. Similarly, the time for a dust grain to spiral into a star under the action of stellar wind drag is estimated in Minato et al. (2006) as
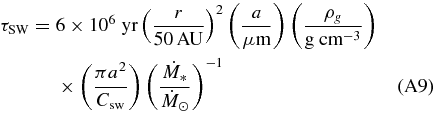
where (πa2/Csw) = 1/QSW, where QSW is the stellar wind coupling coefficient, the ratio of the effective to geometric cross sections. While Plavchan et al. (2005) assumed QSW = 1, this assumption is confirmed with modeling of dust grains in Minato et al. (2006).
From Equations (A8) and (A9) it follows
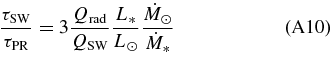
as in Plavchan et al. (2005) with Qrad/QSW = 1 assumed. We note that Equation (3) in Plavchan et al. (2005) is more fundamental than Equation (A10) since the solar wind mass-loss rate is variable, but this is a good approximation. Using the X-ray mass-loss rate relation in Wood et al. (2005), we can re-express (A10) as
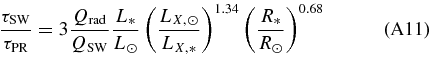
For the Sun, LX/L☉ ∼ 5 × 10⁻⁷. When τSW/τPR < 1, P–R drag timescales are longer than stellar wind drag timescales, and stellar wind drag is relevant. Using A11 and the approximation that 1.34 = 4/3, stellar wind drag dominates P–R drag when
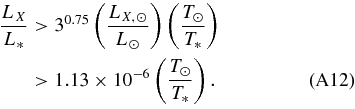
Equations (A11) and (A12) are subject to the condition that FX < 8 × 10⁵ erg s−1 cm−2, which can be rewritten as
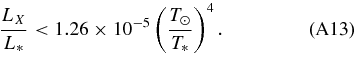
For "saturated" stars with FX > 8 × 10⁵ erg s−1 cm−2, stellar wind mass loss can still dominate the P–R drag, but the mass-loss rates cannot be estimated accurately from the X-ray activity.
Stellar wind drag and P–R drag are additive, and can be combined as done in Strubbe & Chiang (2006) and Fitzgerald et al. (2007):
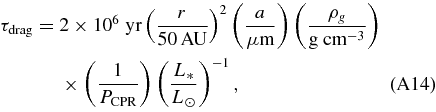
where PCPR is defined in Strubbe & Chiang (2006):
which we can re-express as
Drag forces predict a disk with constant vertical optical depth (≡surface density). In a steady state, the mass must cross an annulus which is constant,

The average radial inward drift velocity of a grain goes as vr = r/τdrag ∝ r−1. Hence, Σr(r) must also be constant as a function of orbital radius. An infrared spectra consistent with a power-law follows directly from this.
While stellar wind drag and P–R drag forces can have similar magnitudes, the same is not true for the strength of the radial or "blowout" force unless  (Plavchan et al. 2005; Gustafson 1994). Such high mass-loss rates are not supported by recent theoretical arguments (Holzwarth & Jardine 2007). The additional factor of ∼1000 arises since the ratio of drag forces compared to the ratio of radial forces for P–R and stellar wind is enhanced by a factor of (c/vsw), where vsw is the stellar wind velocity. Strubbe & Chiang (2006) writes the grain blowout radius from the combined effects of radiation and stellar wind as
where
We estimate the minimum mass of the parent bodies—asteroid and comet proto-planetary analogs—by considering how quickly the dust mass must be replenished to maintain a steady state as in Chen et al. (2005b). Grain–grain collision timescales can be shorter than both P–R and stellar wind drag timescales. The shortest timescale dictates which mechanism is responsible for removing dust, but that shortest timescale will never be longer than the P–R drag timescale for the orbital dust distances typically under consideration. Hence, we use the P–R drag timescale to estimate minimum total parent body mass, but note that the total parent body mass can be substantially larger if the grain–grain collision timescale or the stellar wind drag timescale are significantly shorter (Chen et al. 2005b; Plavchan et al. 2005; Minato et al. 2006). The minimum total parent body mass is given by

as in Chen & Jura (2001), where t* is the age of the star.
Finally, throughout our analysis, we assume  to be the average mass-loss rate. As noted in Augereau & Beust (2006), flaring activity can substantially enhance the stellar wind drag force relative to a quiescent state. For a star that flares ∼10% of the time with mass-loss rated enhanced by a factor of ∼100 during flared states with respect to quiescent activity, the average mass-loss rate can be ∼10 times greater than the quiescent mass-loss rate, and hence grain removal timescales can be ∼10 times shorter. The stellar activity cycle can be assumed to be much shorter than the ∼Myr drag-force removal timescale, and hence individual grain lifetimes will be insensitive, on average, to the flared state of a star. However, the methods in Wood et al. (2005) and Schmidt et al. (2007) to estimate mass-loss rates are sensitive to the flared state of a star, and a correction factor based on the activity level of the star should be applied to estimate the average mass-loss rate.
A.2.3. The Transition Between Grain–Grain Collisions and Drag Forces in Disk Dynamical Evolution Theory
From Equations (A14) and (A6), we derive
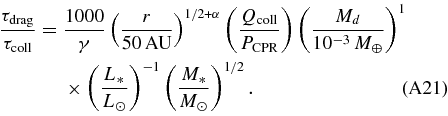
We consider the dust mass estimate from the fractional infrared excess (Section 4.4; Chen et al. 2005b; Jura et al. 1995):
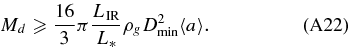
If we set r = Dmin = Dring, and if we assume that the dust is originating in a ring with relative width of 0.1, then Equation (A21) approximates the local dust mass in the ring. Furthermore, Equation (A14) represents the total time for a dust grain to spiral into the star. The average time for a dust grain to escape the ring by being dragged inward before colliding with another grain is further reduced by a factor of ∼ΔDring/(2Dring) = 0.05. If we assume 〈a〉 = 1 μm, ρg = 2.5 g cm−3, and α = 0, we get
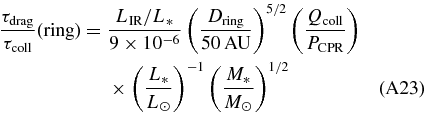
For a solar-type star with a young Kuiper–Belt analog at 50 AU and  such that Qcoll/PCPR = 0.75, Equation (A22) predicts that debris disks are drag-force dominated (and collision-force dominated otherwise) when
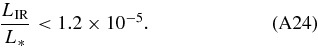
Increased stellar winds increase the fractional infrared excess luminosity transition in Equation (A23) by a factor of ∼ for a solar-type star. If
  as might be reasonable for young, low-mass stars, the transition fractional infrared excess luminosity is 4 × 10⁻⁵.
A.2.4. Planet–Dust Interaction
When discussing the role of different grain removal mechanisms in debris disks, the effect of planets on the dynamics cannot be neglected. Dust trapped in orbital resonances with planets are invoked to explain clumps and nonazimuthally symmetric disk structures seen in resolved disks such as Vega and Eps Eri (Wyatt 2003; Greaves et al. 2005; Krivov 2007; Krivov et al. 2007). Herein, we consider the dynamically cold model of Wyatt (2003), with planetesimal (and dust) eccentricities of <1%, to approximate when the presence of a planet is important for disk dynamical evolution relative to the processes already discussed.
Wyatt (2003) considers a migrating planet with migration rate  encountering planetesimals to estimate resonance capture probabilities. Planetesimals will be captured in resonances with a probability Pr given by the functional form from Wyatt (2003):
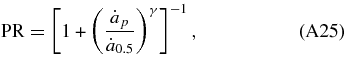
where  is the 50% capture probability migration rate and γ dictates how fast the probability turns over as a function of
  . Wyatt (2003) determined that
  takes the form
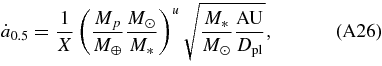
depending on the orbital resonance ( in units of AU Myr−1; Dpl is the planet orbital radius). For the 2:1 orbital resonance, Wyatt (2003) finds through computer simulations X = 5.8 and u = 1.4; for the 3:2 resonance, X = 0.37 and u = 1.4; for the 4:3 resonance X = 0.23 and u = 1.42; and higher order resonances have weaker capture probabilities (bigger X). If
  , planetesimals will have a >50% of being caught in an orbital resonance and vice versa.
We relate the planet–planetesimal interaction analysis of Wyatt (2003) to planet–dust interaction as in Krivov et al. (2007). First, we replace the planetesimals with dust grains. Dust grains will orbit on slightly larger orbits than the Keplerian orbits of the planetesimals due to the effect of radiation pressure. As a result, resonant orbital semimajor axes will be slightly larger and grain-size dependent. The correction factor to a resonant semimajor axis is (1 − β)1/3, where β is the ratio of the radiation pressure force to gravity and is dependent on grain properties.
Second, inward migrating dust under the action of a drag force is equivalent to an outward migrating planet. We can replace  with the dust inward drift velocity vr when
  . In the example of Vega in Wyatt (2003), a planet migration rate of
  AU Myr−1 is derived to model the resolved Vega submillimeter excess. For comparison, from Section A.1.2, the dust migration rate in units of AU Myr−1 from the combined effects of P–R and stellar wind drag goes as
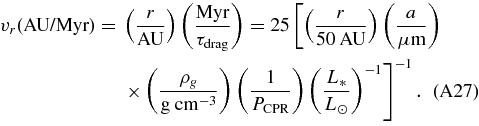
This is a factor of ∼50 larger than the inferred planet migration rate for Vega for the default values of grain size, density, orbital distance, etc. Hence, replacing the planet migration rate with the dust inward drift velocity is appropriate.
With  (and consequently τcoll/τdrag > 1), the disk would be drag-force dominated excepting for the presence of a planet. We expect the dust to spiral inward toward the sublimation radius unless it is trapped in an orbital resonance, or scattered from the system in the "resonance overlap region."
Dust will be trapped into an orbital resonance with >50% probability if
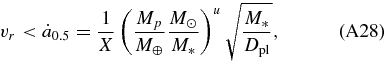
which we can re-express as
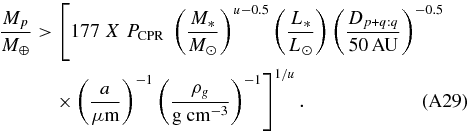
If we set u = 1.4, we can rewrite this in terms of Jovian masses (MJ):
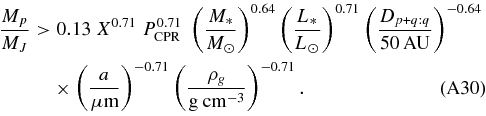
In Equations (A28) and (A29), Dp + q:q corresponds to the semimajor axis of the orbital resonance p+q:p, which can be related to the planet semimajor axis as in Krivov et al. (2007):
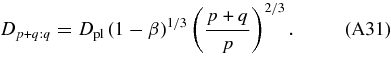
From Equation (A29), we conclude that a proto-planet >0.05 MJ at 50 AU will trap a majority of 1 μm dust (2.5 g cm−3) around a solar-type star in the 3:2 orbital resonance ( assumed). At 10 AU, the minimum planet mass is 0.14 MJ, and at 5 AU the minimum planet mass is 0.22 MJ. Since these planet masses are comparable to known extrasolar planet masses, we conclude that dust trapped in orbital resonances with Jovian planets should be a common phenomenon. In our own solar system, resonant trapping of a small fraction of inward migrating dust has been observed for the Earth (Dermott et al. 1994; Reach et al. 1995), and would be observable for the Jovian planets if we were not embedded in our own zodiacal cloud.
Krivov et al. (2007) goes into more detail about what happens to the dust once it is trapped into resonance. The resulting observability is determined by the survival time of grains in resonance relative to the collision and drag timescales. While in resonance, the dust eccentricities will be pumped up until the dust escapes resonance or collides with other dust. If the dust escapes resonance, it can be scattered inward and continue spiraling into the star, or be scattered out of the system, and this is again dependent on the planet mass. Additionally, the orbits of dust quickly become chaotic for planets of a few Jovian masses, providing an upper limit to the planet mass for observable resonant trapping in addition to the lower limit in Equation (A29) (Kuchner & Holman 2003). We note that the minimum planet mass required to capture dust is proportional to P0.7CPR. If the stellar wind mass-loss rate is substantially larger than solar, it affects the planet–dust interaction and disk dynamics overall. Stars with high mass-loss rates are less likely to have observable dust in resonance with planets of a similar mass compared to stars with small mass-loss rates.
Dust in nonresonant orbits can enter the "resonance overlap region" and be scattered out of the system on short timescales

where r and Dpl are the dust and planet semimajor axes, respectively, and Mp and M* are the planet and stellar masses in the same units (see also Quillen 2006). Again, if the planet is massive enough, the planet can effectively scatter a majority of the inspiraling dust out of the system, creating a disk with an inner hole. This is the "disk with inner hole" model is widely used to explain infrared spectra with no short-wavelength "hot excess," but longer wavelength "cold excess." Such a disk would have a constant surface density truncated at RIN = Dpl and ROUT equal to the orbital radius of the colliding parent bodies producing the dust. Conversely, the presence of a warm excess where collisional timescales are long relative to drag timescales implies the lack of a planet of sufficient mass interior to where dust is being produced to halt the inward migration.
In summary, if τcoll/τdrag < 1, then the radial inward drift velocity of dust is effectively zero. Since dust grains undergo destructive collisions before they can drift into a planet, dust will be confined to where the parent bodies are located, such as in a ring or in resonance with a planet (if the planet is migrating). The presence of a planet can likely be inferred from the presence of clumpy disk structure. If τcoll/τdrag > 1, the presence of Jovian planets halts or substantially arrests the inward migration of dust under drag forces. If the planet is on the order of a Jovian mass, the dust will also likely be trapped in clumpy resonances that could dominate the fractional infrared excess. The presence of nonazimuthal disk structures for disks with LIR/L* < 10−4 can be used to infer the presence of Jovian planets without directly detecting the planets themselves. Conversely, a power-law infrared excess can be used to exclude the presence of Jovian planets at the orbital radii of the emitting dust.
A.3. Spectral-Type Disk Fraction Dependence
Herein, we present six factors that complicate the interpretation of the dependence of the 70 μm disk fraction on spectral type. Three of these factors apply particularly to our sample, and three are intrinsic to differences between spectral types. We consider each in turn and its impact on the apparent discrepancy between the 70 μm disk fractions as a function of spectral type. We conclude from these six factors that the paucity of bright 70 μm excesses (F70/F* ≳ 5–10) around late-K and M dwarfs is likely a real phenomenon rather than due to sensitivity or systematic bias.
First, the average age of the T* < 5000 K subsample is 51 Myr (median 12.25 Myr), compared to the average age of 380 Myr (median 340 Myr) for the 5000 K < T* < 6000 K subsample. Second, the average flux ratio upper limit of the T* < 5000 K subsample is F70/F* = 18.5 (median 6.1), and is F70/F* = 2.1 (median 1.8) for the 5000 K < T* < 6000 K subsample. The first two factors cancel to first order, when accounting for the third factor—the assumed age evolution of the fractional infrared excess. We assume that LIR/L* ∝ t−1* (e.g., Rieke et al. 2005). While we are ∼3–9 times less sensitive on average to 70 μm excesses around the cooler stars, a steady-state collisional evolution model predicts that they should be ∼10 times brighter at younger ages.
Note that the first two factors do not cancel if we assume a different time dependence for the evolution of LIR/L*. Currie et al. (2008b) posit that debris disks around solar-type stars undergo a "rise and fall" of debris disk brightness, peaking at ages of ∼10–15 Myr. Low-mass K and M dwarfs could undergo a similar but delayed "rise and fall" of debris disk brightness, peaking at ages of 30–50 Myr (e.g., NGC 2547, Forbrich et al. 2008; Kenyon & Bromley 2008). Under such an alternate scenario, for the median age of the T* < 5000 K subsample, we would be catching the stars during the rise and before the peak in emission from debris disks.
Fourth, we have a slightly higher fraction of excesses at 24 μm for stars with T* < 5000 K (18.59.65.2%) than for stars with 5000 K < T* < 6000 K (14.39.04.3%). This result implies that small 24 μm excesses (e.g., ∼10%–15% flux density excess) for young T* < 5000 K stars are as common as they are around hotter stars, whereas larger fractional infrared excesses—e.g., >100% as probed with our 70 μm observations—remain rare around K and M dwarfs relative to higher mass stars. The lack of large fractional infrared excesses around K and M dwarfs still necessitates an explanation.
Fifth, at 70 μm the emitting dust orbits at smaller radii for cooler stars. At small orbital radii (∼3–10 AU; Table 4), we are equally sensitive to dust for all stars in our sample. However, the hotter stars with strong 70 μm excesses have dust at orbital radii that we cannot probe with the 70 μm observations of the cooler stars. The fifth factor implies that the lack of low-mass debris disks we observe at 70 μm could depend on disk geometry. If young Kuiper–Belt analogs (that produce the dust we are observing) form at radii that scale with the stellar luminosity, then we are indeed observing fewer massive, bright debris disks around the cooler K and M dwarfs compared to G dwarfs at comparable fractional infrared excess (e.g., F70/F* > 5–10). Theoretical modeling indicates that the orbital distance for the formation of Jovian planets at the "snow line" has a weak dependence on stellar mass (Kennedy & Kenyon 2008; Kennedy et al. 2007, 2006). This implies that young Kuiper Belt analogs may form at smaller radii for lower mass stars, but this is not conclusive.
If instead the young Kuiper Belt analogs form at comparable orbital radii independent of spectral type, our observations are not sensitive to detect these cold debris disks around late-K and M dwarfs. Submillimeter observations by Lestrade et al. (2006) and Liu et al. (2004) have revealed three cold debris disks around M dwarfs, albeit at low S/N for GJ 842.2. The second submillimeter excess source, GJ 182, is not detected in excess in our sample, although an excess 5 times the photosphere at 70 μm would not have been detected. The third source, AU Mic, is detected in excess of ∼9 times the photosphere at 70 μm in our sample. These initial submillimeter observations of low-mass stars imply cold submillimeter disks around late-K and M dwarfs could be as common as 70 μm excesses around older G dwarfs (∼15%; Bryden et al. 2006). Observing more M dwarfs at submillimeter wavelengths will further address this possibility.
The dust removal mechanisms and timescales are the sixth factor. The dust lifetimes around K- and M-type stars due to P–R drag and collision timescales are (sometimes significantly) longer and the dust blowout radii are smaller, scaling with either the stellar luminosity or the stellar mass. For example, an M0 dwarf has a P–R drag timescale ∼10 times longer than for a G2 star, a collision timescale 40% longer (for the same disk mass), and a blowout radius for dust grains ∼10 times smaller (these follow from Section A.1). A collisional-cascade steady-state predicts the number density of grains scales as a−3.5 where a is the grain size and the minimum grain size is set by the blowout radius. The smaller blowout radius and longer grain lifetimes for K and M dwarfs imply larger dust abundances and more smaller grains relative to G-type stars for a similar amount of colliding parent bodies. Such an excess of dust should be more easily detectable, and this is not observed at 70 μm. A mechanism like stellar wind drag is necessary to account for this paucity of bright 70 μm debris disks around M dwarfs.
Footnotes
- 7
For HD 7590, we estimate ages of 496, 427, and 463 Myr from X-ray, rotation period and R'HK indicators, respectively; for HD 73350 we estimate ages of 613, 358, and 569 Myr from X-ray, rotation period, and R'HK indicators, respectively; for HD 92945, we estimate ages of 311 and 278 Myr from X-ray and R'HK activity, respectively; for HD 135599, we estimate an age of 214 Myr from its rotation period and association membership, while we ignore the X-ray estimated age of 1.1 Gyr.