


ABSTRACT
We report the discovery of energetic neutral hydrogen atoms (ENAs) emitted during the X9 solar event of 2006 December 5. Beginning ∼1 hr following the onset of this E79 flare, the Low Energy Telescopes (LETs) on both the STEREO A and B spacecraft observed a sudden burst of 1.6–15 MeV protons beginning hours before the onset of the main solar energetic particle event at Earth. More than 70% of these particles arrived from a longitude within ±10° of the Sun, consistent with the measurement resolution. The derived emission profile at the Sun had onset and peak times remarkably similar to the GOES soft X-ray profile and continued for more than an hour. The observed arrival directions and energy spectrum argue strongly that the particle events < 5 MeV were due to ENAs. To our knowledge, this is the first reported observation of ENA emission from a solar flare/coronal mass ejection. Possible origins for the production of ENAs in a large solar event are considered. We conclude that the observed ENAs were most likely produced in the high corona and that charge-transfer reactions between accelerated protons and partially stripped coronal ions are an important source of ENAs in solar events.
Export citation and abstract BibTeX RIS
1. INTRODUCTION
In December 2006, shortly after the launch of NASA's twin STEREO spacecraft, there was a series of four X-class flares, each with an associated solar energetic particle (SEP) event. At this time, the two STEREO spacecraft were located close together near Earth, and the Low Energy Telescopes (LETs) and High Energy Telescopes (HETs) were already operational. Measured SEP time–intensity profiles are shown in Figure 1. Since the December 5 event originated near the east limb, with no direct connection along the spiral interplanetary magnetic field, most energetic particles from this event arrived >4 hr after the X-ray flare. Also seen between ∼1130 and 1300 UT in Figure 1 is a small precursor to the main SEP event. This Letter investigates the origin of this precursor.
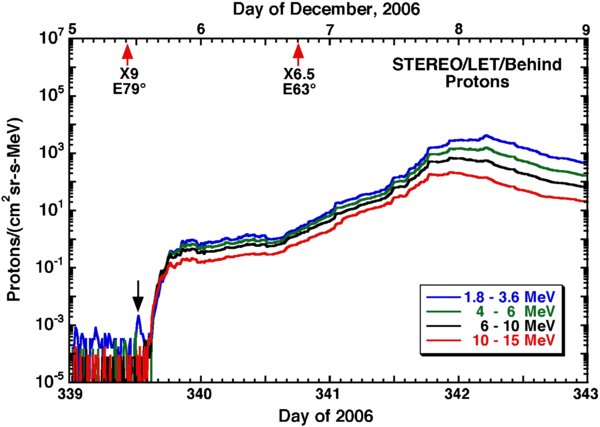
Figure 1. Time history of low-energy protons measured by LET-B during 2006 December 5–8. The onset time and location of two X-class flares are indicated. The arrow points to a burst of particles preceding the main SEP event.
Download figure:
Standard image High-resolution imageThe December 5 event occurred with little warning and was not as well observed as most X-class events. There are no coronal mass ejection (CME) images, because Solar and Heliospheric Observatory (SOHO) was undergoing routine maintenance and the STEREO/SECCHI instruments were not yet operational. However, as RHESSI emerged from Earth shadow at ∼1030 UT, it observed hard X-ray and γ-ray emission near the peak in the GOES soft X-ray emission (see http://sprg.ssl.berkeley.edu/~tohban/browser/). In addition, at 1027 UT both STEREO WAVES instruments observed Type-II and Type-III radio bursts (showing that a shock had formed in the corona and that electrons were escaping into interplanetary space; see http://swaves.gsfc.nasa.gov).
2. OBSERVATIONS
Together, LET and HET measure the nuclear charge (Z) and kinetic energy of H, He, and heavier nuclei up through Ni from ∼2 to ∼100 MeV nucleon−1. The LET detector system is composed of a double-ended array of 14 position-sensitive silicon solid-state detectors, including 10 thin (∼25 micron thickness) detectors arranged in two fan-shaped arrays centered on a four-detector double-ended stack. The various detector combinations measure particle arrival directions over a 130° × 29° fan in both the front and back directions (Mewaldt et al. 2008). The HET sensor consists of a stack of 10 circular silicon solid-state detectors (each 1 mm thick) with a cone-shaped single-ended field of view with a 55° full angle (von Rosenvinge et al. 2008).
The LET sensors on both spacecraft are normally oriented such that the Sunward fan is parallel to the ecliptic and centered 45° west of the Sun along the nominal (Parker spiral) interplanetary magnetic field. However, during 2006 December, the STEREO-B spacecraft was flying upside down such that the LET-B Sunward fan and HET-B were centered 45° east of the Sun. As a result, the two LETs combined could measure particle arrival directions over 360° of the ecliptic plane.
The 2006 December 5 solar flare (located at E79 S06) was an X9 event, the sixth largest X-ray flare of solar cycle 23. The X-ray onset measured by NOAA's GOES-12 satellite occurred at 1019 UT with the maximum at ∼1030 UT. The arrival directions of 1.6–15 MeV protons detected by the LETs during a 12 hr period on December 5 are shown in Figure 2. At ∼1445 UT, protons, He, and heavier ions began arriving from a broad range of directions in the forward hemisphere.
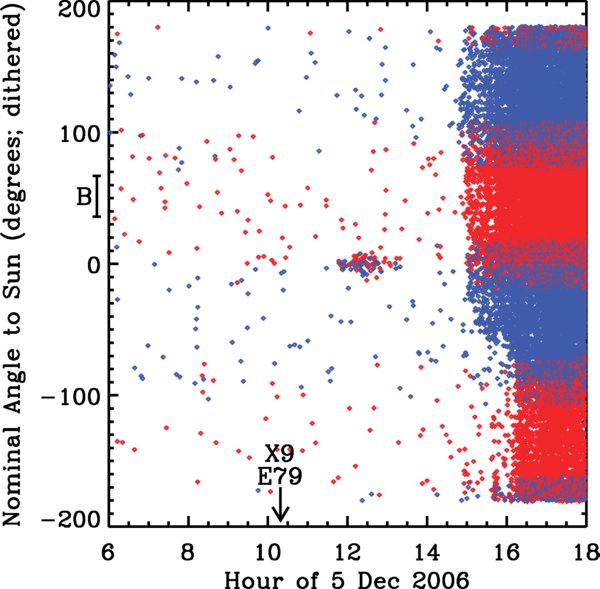
Figure 2. Plot of the measured angle to the Sun for individual 1.6–12 MeV proton events on 2006 December 5 (red = LET-A; blue = LET-B). Note the group of events within ±10° of the Sun from ∼1130 UT to ∼1350 UT, well before the SEP onset at ∼1445 UT. The X9 flare onset is indicated. The range of magnetic field orientations connecting to the Sun between 1130 and 1350 UT is shown as a bar.
Download figure:
Standard image High-resolution imageAlso seen in Figure 2 at 1130–1300 UT is a tight group of protons arriving over a very narrow angular range within ±10° of the Sun (no increase was seen in He or heavier ion rates). The narrow width of the angular distribution and arrival times imply that these particles were not influenced by the magnetic field (oriented 36°–67° from the Earth–Sun line during this interval), and we conclude that these protons must have been neutral particles (either neutrons or H atoms) while en route to 1 AU that were converted to protons shortly before or as they were detected.
Protons in this precursor exhibited velocity dispersion with the highest energy particles arriving first. Assuming these particles originated at the Sun and have not lost energy en route, we derive the emission profile at the Sun using the measured kinetic energy (E) to determine the particle velocity, v = (2E/m)1/2 (using m for the proton mass). To compare to the X-ray time profile, we plot the quantity Tobs–(RSt/v) + 492 s. Here RSt is the heliocentric distance of the STEREO spacecraft (0.983 AU). The added 492 s correspond to the light travel time from the Sun to the STEREOs (for X-rays, v is the speed of light, and we plot the time profile reported by GOES). The resulting emission profile (Figure 3) is remarkably similar to the GOES X-ray profile, confirming that the neutral particles originated in this solar event.
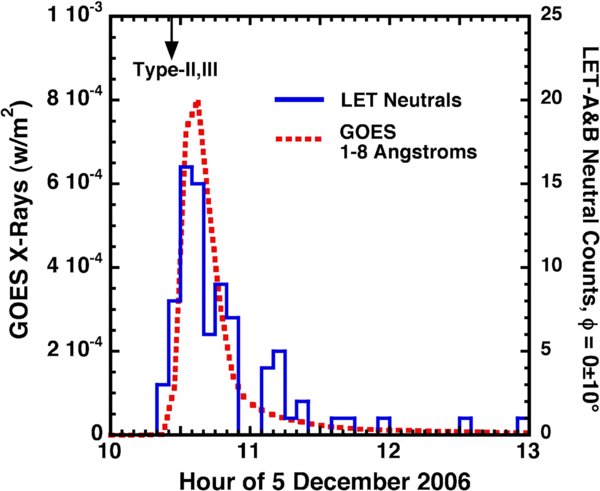
Figure 3. Derived emission profile of the 1.6–15 MeV neutral particle burst (in counts per 5 minutes) is compared with the GOES X-ray profile and with the onset of STEREO type-II and type-III radio bursts. The neutral-particle and X-ray emission peaks agree within 5 minutes. Both traces have 5 minute resolution.
Download figure:
Standard image High-resolution imageThe distribution of the arrival directions is better illustrated in Figure 4, which includes 1.6–15 MeV protons with derived solar emission times between 1015 and 1145 UT. Note the very narrow peak in the arrival distribution within ±10° of the Sun. The typical maximum uncertainty in these directions is ±6°, and most detector combinations that view the Sun were triggered during this burst.
Figure 4. Histogram of arrival directions for LET proton events with derived solar emission times between 1015–1145 UT on December 5. The angular coverage of LET-A (solid) and LET-B (dashed) is indicated along the top.
Download figure:
Standard image High-resolution image3. DISCUSSION
We first consider whether the LET observations could result from the decay of neutrons created when high-energy (>30 MeV) flare-accelerated protons and He underwent nuclear interactions with ambient H and He. This process has been modeled by Lingenfelter, Ramaty, and co-workers (Lingenfelter & Ramaty 1967; Hua & Lingenfelter 1987; Ramaty & Murphy 1987; Murphy et al. 2007). High-energy neutrons from a solar flare were first detected by Chupp et al. (1982, 1987).
In addition, Evenson et al. (1983; hereafter EMP) and Evenson et al. (1990) measured interplanetary protons from the beta decay of neutrons from three eastern hemisphere events. Since the neutron mean life is only 885 s, most neutrons emitted from the Sun decay well inside 1 AU. However, EMP showed that for east-limb events like this one neutrons that decay on field lines connected to Earth must have decayed relatively near Earth because of shadowing by the solar surface.
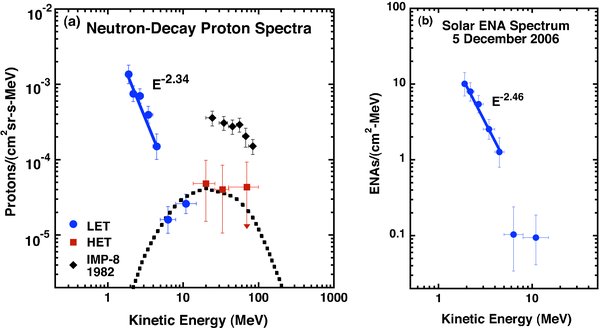
In Figure 5(a), we compare the neutron-decay proton spectrum measured by EMP with energy spectra measured by LET and HET that include protons with derived solar emission times between 1015 and 1145 UT. All arrival directions are included and pre-event background proton rates were subtracted. Although neither HET viewed the Sun, there was a 2σ excess of 13–40 MeV protons during this time interval, and possibly a small excess of 40–100 MeV protons (shown as an upper limit).
Figure 5. (a) Proton spectra measured by LET and HET (including protons from all arrival directions if the derived solar emission times are between 1015 and 1145 UT on December 5) are compared to neutron-decay proton spectra from IMP-8 for the 1982 June 3 event (Evenson et al. 1983). Also shown (dotted line) is a 1 AU neutron spectrum based on calculations by Hua & Lingenfelter (1987; see text). Five LET events with 1.6–1.8 MeV were excluded because of detection-efficiency uncertainties. (b) Spectrum of energetic neutral hydrogen measured by LET-A and LET-B during the 2006 December 5 solar event, based on detected protons with arrival directions within ±10° of the Sun and derived solar emission times between 1015 and 1145 UT. The >5 MeV points may also include a contribution from neutron-decay protons (see text). Note the different units in Figure 5(a) and Figure 5(b).
Download figure:
Standard image High-resolution image
Also shown in Figure 5(a) is a theoretical neutron spectrum based on calculations by Hua & Lingenfelter (1987). Using their neutron spectrum emitted at 75° to the zenith, we calculated the relative number of neutrons of each energy that would decay between 0.8 and 1 AU and normalized the resulting decay spectrum to the LET and HET > 5 MeV intensities. Although this estimate is approximate, it is clear that at 1 AU neutron-decay proton spectra of solar-flare origin should show a significant intensity decrease below ∼10 MeV due to the decay of low-energy neutrons before reaching field lines connected to STEREO. The LET spectrum below 5 MeV is inconsistent with an origin as neutron-decay protons. However, the excess 5–40 MeV protons following this flare may include a contribution from neutron-decay protons.
While the initial direction of a neutron-decay proton will be aligned with the neutron trajectory from the Sun, the decay proton will immediately begin to spiral around the magnetic field. In addition, pitch-angle scattering will gradually isotropize the proton pitch-angle distribution (PAD; see Ruffolo 1991), as observed by EMP. As a result, we would expect to detect decay protons from many directions. However, >70% of the <5 MeV protons with emission times between 1015 and 1145 UT arrived from within 10° of the solar longitude, while at >5 MeV this fraction was ∼23%. We conclude that neutrons were not responsible for the <5 MeV neutral emission, but could contribute at higher energy.
ENAs are a second possible source of proton events in LET. Unlike neutron-decay protons, which originate at various points in the interplanetary medium both ahead and behind the spacecraft, ENAs originate at the Sun and travel in straight lines. After leaving the solar vicinity most will remain neutral en route to 1 AU. In LET, they are stripped of their electrons upon striking the thin front Kapton windows. Solar ENAs thereby preserve their original directions until detection.
ENAs have been observed from Earth's magnetosphere and other planetary magnetospheres (Hovestadt & Scholer 1976; Burch et al. 2001; Mitchell et al. 2005) and also from the heliosphere (Hilchenbach et al. 1998). They are usually attributed to processes in which energetic protons (or heavier ions) suddenly become neutral through charge exchange and then fly off in the same direction as that of the original charged particle. Most ENA observations have been made between ∼1 and a few hundred keV.
In Figure 5(b), we plot the fluence spectrum of the neutral burst, including only particles with arrival directions within ±10° of the Sun. Correcting the observed 1.8–5 MeV ENA fluence back to the Sun, neglecting any losses, and assuming isotropic emission, we estimate that 1.8 × 1028 ENAs escaped from the Sun in the upward hemisphere.
The timing of the neutral-particle emission in Figure 3 is in excellent agreement with the X-ray flare, suggesting that the ENAs are produced by flare-accelerated particles. With ambient temperatures of 3–30 MK at the flare site (Feldman 1996) and 1–2 MK elsewhere in the corona, there should be no neutral H or He, and no He+, on which accelerated protons can charge exchange. However, neutral H atoms will also be produced by radiative recombination with ambient electrons (H+ + e → H + γ) and by charge exchange with heavier species such as O, Si, and Fe that retain some electrons at coronal temperatures.
In the absence of measured or theoretical cross sections for charge-exchange reactions of protons with partially stripped heavy ions at MeV energies, we have estimated the charge-transfer cross section for H+ + O6+ → H + O+7 from its inverse reaction, H + O+7 → H+ + O6+, using the classical trajectory Monte Carlo (CTMC) method with detailed balancing (Olson & Salop 1977). There are some data for this inverse reaction <0.8 MeV (Phaneuf et al. 1987). While the simulation neglected corrections for K-shell capture by oxygen, which should enhance the high-energy yield (e.g., Stancil et al. 1999), we consider this a reasonable first-order estimate for ENA production by proton collisions with O, the most abundant coronal species heavier than He. The CTMC result can be represented as σ = 1.2 × 10⁻²⁰ E−2.0 cm2 from 0.1 to 5 MeV, with E being the proton energy in MeV. We assume that cross sections for charge exchange with other coronal species scale from our oxygen estimate as (Z/8)2 (Olson & Salop 1977). For radiative recombination, we use σrr = 1.28 × 10⁻²⁵ E−2.0 cm2 (with E being in MeV) based on a fit to theoretical cross sections >1 MeV (Andersen & Bolko 1990), neglecting effects of electron heating in the flare region.
Once produced, ENAs will be subject to ionization by electron and proton impact ionization and by UV. At MeV energies, the electron and proton ionization cross sections are equal and can be represented as σi = 2.3 × 10⁻¹⁷ × E−0.895 cm2, with E being the ENA energy in MeV (Barghouty 2000).
In solar γ-ray and neutron events ∼1031 to a few times 1033 protons with >30 MeV are required to reproduce observations of γ-rays and neutrons produced by interactions of flare-accelerated particles in the solar atmosphere (Ramaty & Murphy 1987). From Figure 5(a), we estimate that the December 5 flare may have produced ∼10% as many neutrons as the 1982 June 5 event, for which Hua & Lingenfelter (1987) estimated that 3.1 × 1033 protons > 30 MeV were required.
Recent solar γ-ray and neutron studies favor power-law spectra for flare-accelerated H and He with spectral indices ranging from −3.5 to −4.5 (Share & Murphy 1998; Lin et al. 2003; Murphy et al. 2007). For the 2002 July 23 event, Lin et al. (2003) derived proton spectral indices of −3.4 ± 0.1, −3.8 ± 0.1, and −4.0 ± 0.5 from three γ-ray line ratios assuming a single power law extending down to 2.5 MeV (the threshold for the Ne line). For a spectral index of −3.5, we estimate that ∼3.3 × 1035 protons in the range 1.8–5 MeV were accelerated in the 2006 December 5 flare event.
We now estimate the ENA yield from this accelerated proton spectrum by assuming protons with <10 MeV slow down and stop somewhere in the solar atmosphere. Following Allison (1958), who analyzed the evolution of two-component charge-exchange systems like H+ and H, we calculate the mean number of >1.8 MeV ENAs created by a proton with energy E as it slows using
Here σC = σ01σ10/(σ01 + σ10), where σ10 is the abundance-weighted cross section for H+ → H (including radiative recombination and charge exchange), σ01 is the abundance-weighted cross section for the inverse reaction (electron and proton impact ionization), dE/dx(E) is the rate of energy loss in MeV cm−1 in an ionized plasma, and NT is the number of target atoms per cm3 assuming coronal abundances (Feldman & Widing 2003). Note that since σ10 ≪ σ01, σC reduces to σ10. For a proton starting with 5 MeV, we find an average yield of ∼0.01 ENAs before it slows to 1.8 MeV. In addition, >5 MeV protons can produce 1.8–5 MeV ENAs after slowing down to <5 MeV. Integrating over the adopted solar-flare spectrum from 1.8 to 10 MeV, we get ∼1033 ENAs produced with 1.8–5 MeV. Assuming isotropic emission, this is ∼30,000 times the number needed to explain our observations if all upward-moving ENAs escape the Sun (attenuation in the solar atmosphere is considered below).
In the standard picture of a solar flare, a great deal of energy is suddenly released in the corona through magnetic reconnection, and energetic particles are quickly accelerated by one or more processes (e.g., Miller 1998; Aschwanden 2002). Based on studies of X-ray flares, Aschwanden (2002) concluded that the mean height of the acceleration region varies from ∼5000 to 50,000 km, with an extreme maximum of ∼200,000 km, corresponding to a heliocentric radius of ∼1.3 RS. The acceleration region produces both upward- and downward-directed beams of energetic electrons and protons. Downward-directed electrons produce bremsstrahlung emission from the chromospheric footpoints of the flare, while nuclear interactions of downward-directed ions are responsible for solar γ-ray and neutron events (e.g., Lin et al. 2003).
Acceleration sites ≤1.3 RS will be copious sources of ENA production, but when the overlying solar atmosphere in the direction of Earth is considered, the estimated attenuation factor for a typical 3 MeV ENA produced at 1.15–1.3 RS ranges from ∼10−24 to 10−13. The attenuation factor is given by F(R) = exp(−σiNR), where NR (in cm−2) is the overlying column density of protons and electrons integrated from the heliocentric distance R (at E79) to the STEREOs, using nominal coronal densities (Sittler & Guhathakurta 1999). This indicates that ENAs from the acceleration site or the chromospheric footpoints should not be detectable at Earth for east-limb flares. Indeed, for production sites ≤1.6 RS, we find that not enough ENAs escape toward Earth in this event, even if all 1033 ENAs were produced there. Higher in the corona, the estimated 3 MeV ENA attenuation toward Earth ranges from ∼10−4 at 1.7 RS to ∼10−2 at 2.0 RS. We suggest that ENA emission in the December 5 event resulted mostly from ENAs produced beyond ∼1.6 RS.
ENA production will also occur by particles accelerated at the CME-driven shock. Using the same cross sections, coronal densities, an E−1 spectrum as observed at 1 AU (Mewaldt et al. 2005), and assuming all accelerated particles are concentrated near the shock, we estimate that ∼1035 protons with 1.8–5 MeV are needed to account for our measured ENA fluence (Figures 3 and 5(b)) as the shock moves from 3 RS to 9 RS in 35 minutes (assuming a 2000 km s−1 shock). This number of protons is comparable to the estimated source strength of 1.8–5 MeV protons from the large 2003 October 28 event (Mewaldt et al. 2005), indicating that the ENA yield from CME shock-accelerated particles alone may be inadequate. However, more realistic estimates would include the lateral spread of the shock and ENA production in higher density material behind the shock.
These ENA yields depend on our estimated cross sections for charge exchange with partially stripped heavy ions, which are only first-order estimates. There are also uncertainties in the assumed solar-flare proton spectrum and in coronal densities.
4. SUMMARY AND CONCLUSIONS
This Letter reports measurements of an energetic neutral-hydrogen burst from longitudes within ±10° of the Sun during the large 2006 December 5 solar flare. The derived solar emission profile is in excellent agreement with the soft X-ray profile if the particles traveled in a straight line from the Sun. The arrival directions, energy spectra, and timing of this neutral burst argue strongly that most of the particles (especially those <5 MeV) were energetic neutral hydrogen rather than neutrons. To our knowledge this is the first reported observation of ENAs >10 keV/nucleon from a solar source.
In a flare or coronal environment, energetic protons produce ENAs by radiative recombination. In addition, our rough estimates suggest that charge-exchange reactions with partially stripped heavy ions may produce ∼100 times as many ENAs as radiative recombination. We estimate an upper limit to 1.8–5 MeV ENA production in this event of ∼1033 ENAs by assuming that flare-accelerated protons <10 MeV slow down and stop in the solar atmosphere. By comparison, our observations indicate that ∼1.8 × 1028 ENAs escaped the Sun (assuming isotropic emission). Taking into account ENA losses, we conclude that ENAs from the reconnection site or flare footpoints would not be observable at Earth. Rather, observations of east-limb events heavily favor ENA production beyond ∼1.6 RS, including flare-accelerated protons that reach the high corona and particles accelerated at the CME-driven shock. More detailed models of ENA production and loss in a solar-flare/CME environment will be required to assess these and other possible ENA production sites.
In the approaching solar maximum, STEREO ENA observations from multiple points of view, coupled with models and other imaging data, can provide a new window for studying particle acceleration and transport on the Sun by revealing where and when low-energy ions interact with solar material. In particular, solar ENA observations may provide a means of investigating the poorly known low-energy spectra of ions accelerated in solar flares.
This work was supported by NASA at Caltech and JPL under subcontract SA2715-26309 from the University of California, Berkeley, under NASA contract NAS5-03131. The work at Marshall Space Flight Center was supported by the TEI Program of NASA's Office of Chief Engineer. We thank NOAA for GOES X-ray data, Mike Kaiser for STEREO/WAVES data, Chris Russell for STEREO magnetic field data, and the RHESSI team for γ-ray data. We also appreciate discussions with Eric Christian, Sam Krucker, Bob Lin, Ron Murphy, and Gerry Share.
Note Added in Proof. After this Letter was accepted for publication we learned that the RHESSI instrument did resolve the 2.2 MeV neutron-capture line in the 2006 December 5 flare, confirming that there was extensive acceleration of high-energy protons by this flare event. Based on the measured 2.2 MeV γ-ray fluence and assuming an E−3.5 proton energy spectrum, Albert Shih (2009, personal communication) estimates that >1.2 × 1031 protons with >30 MeV interacted with the solar atmosphere. This would place a lower bound on the estimated number of ENAs produced that is a factor of ∼25 lower than our upper bound, but still more than two orders of magnitude greater than needed to explain our observation.