


ABSTRACT
We report Galaxy Evolution Explorer NUV and optical follow-up observations of the cataclysmic variable V455 And at 3 years past its large amplitude dwarf nova outburst. Orbital and superhump variations are evident in the NUV and optical light curves. We clearly detect the spin along with a photometric variation that we tentatively attribute to non-radial pulsations in the Discrete Fourier Transforms at both wavelengths. The increased amplitude of the spin and pulsation in the NUV versus the optical implies an origin near the white dwarf. The shorter pulsation period after outburst is indicative of a white dwarf that remains hotter than at quiescence.
Export citation and abstract BibTeX RIS
1. INTRODUCTION
The cataclysmic variable V455 And was discovered in the Hamburg Quasar Survey as HS 2331+3905 (Hagen et al. 1995) and follow-up observations were accomplished by Araujo-Betancor et al. (2005). The detailed study, which included Hubble Space Telescope (HST) spectra as well as ground-based photometry and spectroscopy, identified several interesting periodicities from the data. An orbital period of 81.08 minutes was determined from partial eclipses in the optical light curves. Surprisingly, this period did not show up in the optical spectra; instead, a period of 3.5 hr, which drifted between days, was apparent. A photometric period of 83.38 minutes, thought to be a superhump period from a precessing, elliptical disk, was also evident. A periodogram of these data combined with further data by Gänsicke (2007) and S. Pyrzas et al. (2012, in preparation) revealed a stable period at 67.62 s (and its harmonic at 33.8 s), interpreted as the spin period of the white dwarf, as well as a beat period between the white dwarf spin and the spectroscopic period at 67.25 s (and its harmonic at 33.6 s). Finally, a broadband set of frequencies in the range of 300–360 s was seen and postulated to be non-radial pulsations of the white dwarf. A recent detailed study of the optical periodicities over a 10 year period appears in S. Pyrzas et al. (2012, in preparation). Table 1 summarizes the quiescent periods for V455 And.
Table 1. Pre-outburst Periodsa
| Name | Period | Period |
|---|---|---|
| (s) | (minutes) | |
| Orbital | 4804.8 | 81.08 |
| Harmonic (orb) | 2432.4 | 40.54 |
| Photometric (SH) | 5002.8 | 83.38 |
| Harmonic (SH) | 2501.4 | 41.49 |
| White dwarf Pulsation | 300–360 | 5–6 |
| White dwarf Spin | 67.62 | 1.13 |
| Harmonic Spin | 33.81 | 0.56 |
| Spectroscopic | 12,600 | 210 |
| Beat | 67.25 | 1.12 |
| Harmonic beat | 33.63 | 0.56 |
Note. aAll quoted periods are from Araujo-Betancor et al. (2005).
Download table as: ASCIITypeset image
The optical and UV spectra shown in Araujo-Betancor et al. (2005) revealed strong, broad emission lines from the accretion disk, consistent with viewing an accretion disk at high inclination. Fitting the HST spectrum with white dwarf models resulted in a distance of 90 ± 15 pc and a best-fit temperature of 10,500 ± 500 K. This temperature places the white dwarf in V455 And within the same instability strip (consistent to within the quoted uncertainties) that is known for pulsating DA stars (Koester & Holberg 2001; Gianninas et al. 2006) and at the low end of the temperatures for the rest of the accreting pulsating white dwarfs that are known to extend to 16,000 K (Szkody et al. 2010, 2012).
In 2007 September, V455 And underwent a large amplitude (8 mag) dwarf nova outburst. These types of outbursts are known to heat the white dwarf, which then cools to its pre-outburst temperature over timescales of 3–4 years, e.g., WZ Sge (Godon et al. 2006). This presents a unique opportunity for pulsating white dwarfs, i.e., to follow a white dwarf as it moves out of the instability strip due to the outburst heating and then comes back in during the cooling episode. This type of change happens on timescales of years, rather than on evolution timescales for non-interacting white dwarfs. As the UV offers the best opportunity to view the white dwarf and inner disk, the Galaxy Evolution Explorer (GALEX) provided a means to use the near-UV (NUV) wavelength region to explore these areas. GALEX observations of the accreting pulsator GW Lib (Bullock et al. 2011) showed only a long-period (4 hr) variation in the UV at 2–4 years post-outburst. This paper presents our insights gleaned from our GALEX photometric observations of V455 And obtained three years after its outburst combined with optical photometry in that same time frame.
2. OBSERVATIONS AND DATA REDUCTION
We obtained optical photometry for V455 And on eight nights from three locations and two runs (nine orbits) of NUV observations with GALEX in 2010. A description of the data from these observations is given below and a summary appears in Tables 2 and 3.
Table 2. GALEX Observations
| Datea | Orbit | UT time |
|---|---|---|
| Aug 26 | 1 | 10:44:20–11:12:28 |
| Aug 26 | 2 | 12:22:54–12:50:58 |
| Aug 26 | 3 | 14:01:28–14:29:33 |
| Aug 26 | 4 | 15:40:28–16:08:04 |
| Sep 21 | 1 | 14:23:53–14:50:58 |
| Sep 21 | 2 | 16:02:04–16:29:37 |
| Sep 21 | 3 | 17:40:47–18:08:30 |
| Sep 21 | 4 | 19:21:12–19:46:50 |
| Sep 21 | 5 | 21:02:40–21:25:28 |
Note. aAll dates are year 2010.
Download table as: ASCIITypeset image
Table 3. Log of Optical Observations
| Datea | Obs | Filter | Length | Exp | No. of Images | UT Start |
|---|---|---|---|---|---|---|
| (hr) | (s) | |||||
| Jul 27 | MRO | BG40 | 5.35 | 20 | 903 | 05:22:51 |
| Jul 28 | MRO | BG40 | 4.85 | 20 | 559 | 05:47:50 |
| Sep 7 | APO | BG40 | 9.88 | 5 | 7117 | 02:07:55 |
| Sep 9 | McD | BG40 | 1.72 | 5 | 1238 | 06:58:53 |
| Sep 11 | McD | BG40 | 2.09 | 7 | 1078 | 09:43:50 |
| Sep 12 | McD | BG40 | 4.09 | 5 | 2945 | 07:57:13 |
| Sep 25 | APO | BG40 | 10.90 | 5 | 7554 | 01:48:31 |
| Sep 26 | APO | BG40 | 5.23 | 5 | 3769 | 01:50:48 |
Note. aAll dates are year 2010.
Download table as: ASCIITypeset image
2.1. GALEX NUV
The GALEX data were obtained on 2010 August 26 and 2010 September 21. Four orbits were used in August and five orbits in September (Table 2). The FUV detector was not operational so only data in the NUV (1750–2800 Å) were obtained (Martin et al. 2005). The observations, which took place in time-tag mode, were binned into 29 s exposures and calibrated. The AB magnitudes and mid-exposure times were then obtained directly from the resulting SExtractor catalog files. The zero point of the AB magnitudes is from the GALEX online documentation,7 where m0 = 20.08 = 2.06 × 10⁻¹⁶ erg cm−2 s−1 Å−1. The individual files were checked for outliers and several comparison stars were used as a check on the errors of the light curves. The resulting light curves of V455 And for the two runs are shown in Figures 1 and 2.
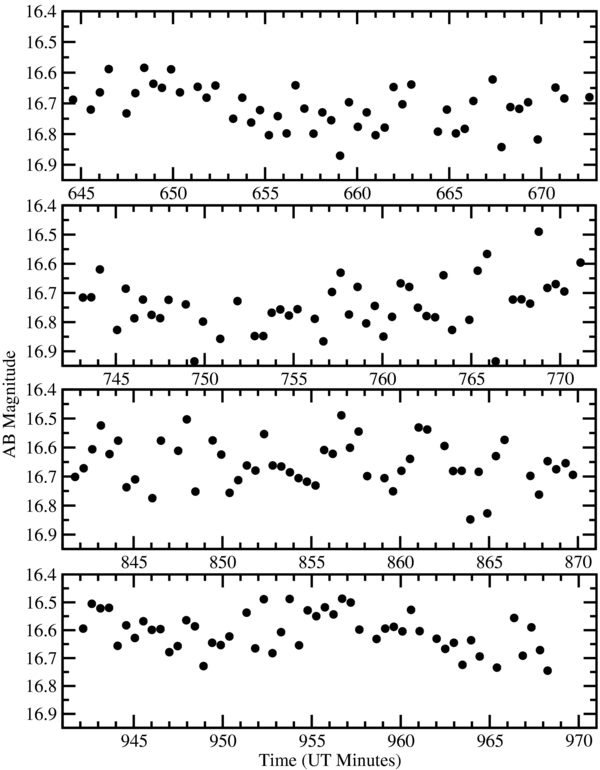
Figure 1. GALEX NUV light curve in AB magnitudes on UT 2010 August 26 during four orbits with 29 s exposures. Error bars are 0.05 mag.
Download figure:
Standard image High-resolution image
Figure 2. GALEX NUV light curve in AB magnitudes on UT 2010 September 21 during five orbits with 29 s exposures. Error bars are 0.05 mag.
Download figure:
Standard image High-resolution image2.2. Optical Data
Two nights of optical data were obtained on 2010 July 27 and 28 using the University of Washington Manastash Ridge Observatory (MRO) 0.76 m telescope, with a BG40 filter on a 1024 × 1024 CCD camera and 20 s integration times. Three nights on the Apache Point Observatory (APO) 3.5 m telescope provided higher time-resolution data on September 7, 25, and 26. The frame transfer CCD camera called Agile (Mukadam et al. 2011a) was used with a BG40 filter and a short integration time of 5 s. A similar time-series CCD called Argos (Nather & Mukadam 2004) and filter was also used on the 2.1 m telescope at McDonald Observatory (McD) on September 9, 11, and 12. Short integration times of 5 s were used except for the night of September 11 when weather conditions required slightly longer times (Table 3).
The data from all observatories were treated in a similar fashion. IRAF8 routines were used to obtain sky-subtracted photometric count rates from the CCD frames, using several comparison stars on each frame. The mid-exposure times of the CCD images were converted to Barycentric Coordinated Time (Standish 1998) and the times and intensities were used to create light curves for each night.
2.3. Discrete Fourier Transforms
To facilitate the period analysis, all of the light curves were converted to a fractional intensity by dividing the count rates by the average intensity and subtracting one. A Discrete Fourier Transform (DFT) was calculated for each light curve up to the Nyquist frequency and the best-fit periods were found by least-squares fitting. The 3σ white noise limits were then found by shuffling the intensities (with all of the periods subtracted) with constant times to provide a pure white-noise light curve (Kepler 1993). The DFT of this light curve was then used to provide an average amplitude, which yielded a 1σ measure. By repeating this 10 times, an empirical 3σ limit was derived. Significant periods were determined to be those above this limit.
Figures 3–10 display the light curves for the optical data (top panel), original DFTs (middle panel), and the pre-whitened (taking out the significant periods) DFT (bottom panel). The significant periods are listed in the middle panel, while the window function (same x-axis scale as DFT) and the 3σ detection limit (dotted line) is shown in the bottom panel. Similar results for the NUV data are shown in Figures 11 and 12. Table 4 gives the significant periods detected on each night.

Figure 3. Light curve and DFT from MRO (UT 2010 July 27) with 20 s exposures. Fractional intensity (top), DFT (middle with orbital (∼81 minutes), possible non-radial pulsation (∼270 s) and spin/beat periods labeled) and pre-whitened DFT and window function (bottom). Dashed line is 3σ noise limit and y-axes in units of millimodulation amplitude (mma).
Download figure:
Standard image High-resolution image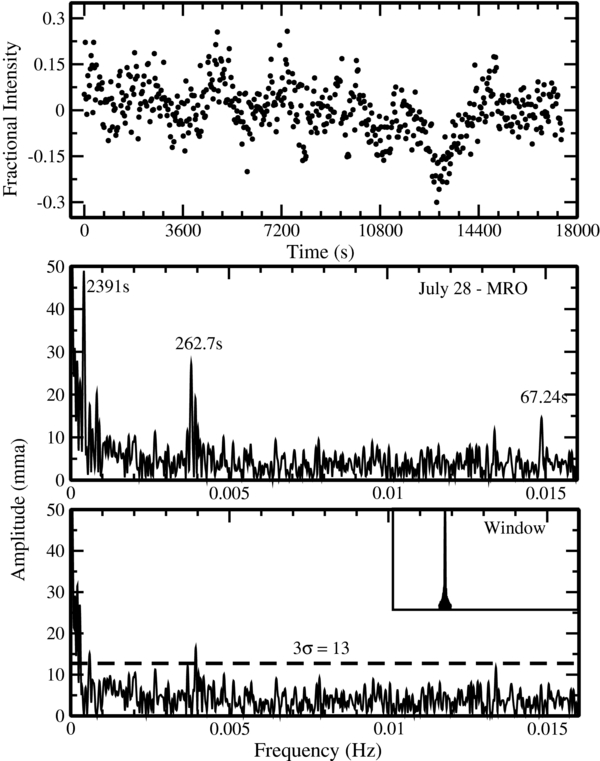
Figure 4. Light curve and DFT from MRO (UT 2010 July 28) with 20 s exposures.
Download figure:
Standard image High-resolution image
Figure 5. Light curve and DFT from APO (UT 2010 September 7) with 5 s exposures.
Download figure:
Standard image High-resolution image
Figure 6. Light curve and DFT from McDonald (UT 2010 September 9) night with 5 s exposures.
Download figure:
Standard image High-resolution image
Figure 7. Light Curve and DFT from McDonald (UT 2010 September 11) with 5 s exposures.
Download figure:
Standard image High-resolution image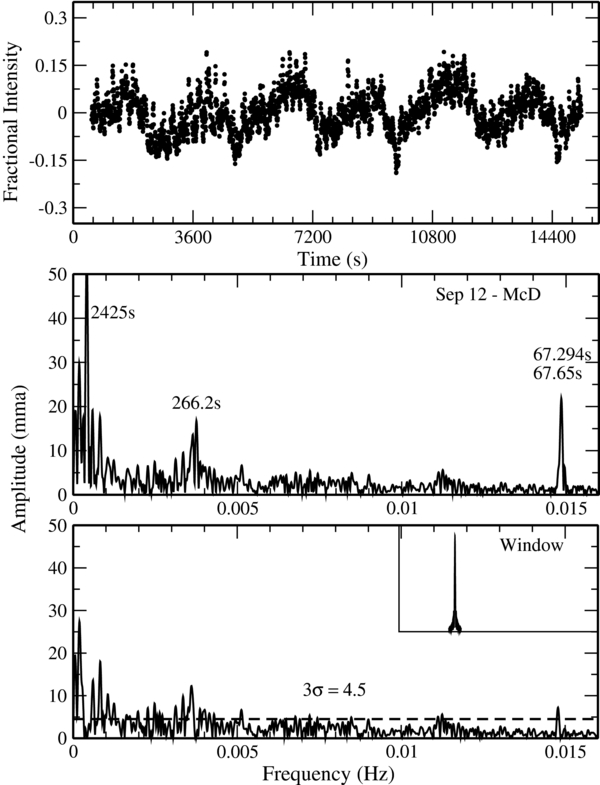
Figure 8. Light curve and DFT from McDonald (UT 2010 September 12) with 5 s exposures.
Download figure:
Standard image High-resolution image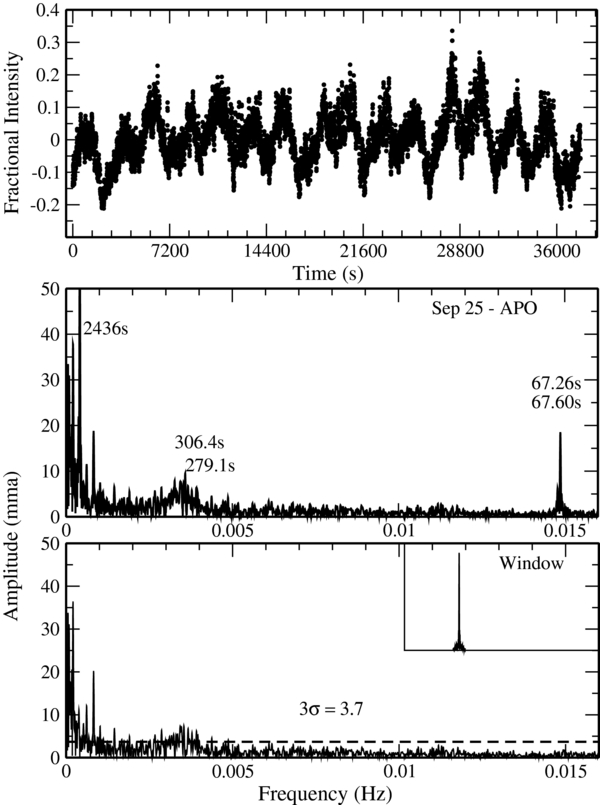
Figure 9. Light curve and DFT from APO night (UT 2010 September 25) with 5 s exposures.
Download figure:
Standard image High-resolution image
Figure 10. Light curve and DFT from APO (UT 2010 September 26) with 5 s exposures.
Download figure:
Standard image High-resolution image
Figure 11. Intensity light curve and DFT from GALEX UT 2010 August 26 with four orbits and 29 s exposures.
Download figure:
Standard image High-resolution image
Figure 12. Intensity light curve and DFT from GALEX UT 2010 September 21 with five orbits and 29 s exposures.
Download figure:
Standard image High-resolution imageTable 4. Optical and NUV Frequencies for V455 And
| Datea | Porb | Amporb | Ppulse | Amppulse | Pspin | Ampspin | 3σ |
|---|---|---|---|---|---|---|---|
| (s) | (mma) | (s) | (mma) | (s) | (mma) | (mma) | |
| Jul 27 | 2393 ± 14 | 33 ± 3 | 266.7 ± 0.4 | 13 ± 3 | 67.26 ± 0.02 | 18 ± 3 | 6 |
| Jul 28 | 2391 ± 17 | 49 ± 4 | 262.7 ± 0.4 | 27 ± 4 | 67.24 ± 0.04 | 14 ± 4 | 13 |
| Aug 26 | 271.7 ± 0.3 | 34 ± 5 | 67.64 ± 0.03 | 24 ± 5 | 10.6 | ||
| Sep 7 | 2428 ± 1 | 70 ± 1 | 282.1 ± 0.1 | 10 ± 1 | 67.289 ± 0.003 | 20 ± 1 | 3.6 |
| 33.811 ± 0.002 | 10 ± 1 | ||||||
| Sep 9 | 2620 ± 15 | 83 ± 2 | 277.6 ± 0.8 | 17 ± 2 | 67.32 ± 0.04 | 22 ± 2 | 9.4 |
| 267.6 ± 0.9 | 15 ± 2 | 33.80 ± 0.02 | 11 ± 2 | ||||
| 33.63 ± 0.02 | 10 ± 2 | ||||||
| Sep 11 | 2484 ± 25 | 37 ± 2 | 271.0 ± 0.4 | 25 ± 2 | 67.18 ± 0.04 | 19 ± 2 | 7.5 |
| 257.0 ± 0.6 | 15 ± 2 | 33.64 ± 0.02 | 9 ± 2 | ||||
| 33.82 ± 0.02 | 9 ± 2 | ||||||
| Sep 12 | 2425 ± 5 | 54 ± 1 | 266.2 ± 0.2 | 18 ± 1 | 67.294 ± 0.009 | 22 ± 1 | 4.5 |
| 277.2 ± 0.3 | 13 ± 1 | 67.65 ± 0.03 | 8 ± 1 | ||||
| 33.645 ± 0.005 | 10 ± 1 | ||||||
| 33.815 ± 0.005 | 10 ± 1 | ||||||
| Sep 21 | 1726 ± 6 | 49 ± 5 | 277.6 ± 0.3 | 24 ± 5 | 67.61 ± 0.01 | 33 ± 5 | 9.2 |
| 2252 ± 16 | 31 ± 5 | 67.25 ± 0.02 | 24 ± 5 | ||||
| Sep 25 | 2436 ± 1 | 64 ± 1 | 306.4 ± 0.2 | 8 ± 1 | 67.60 ± 0.01 | 6 ± 1 | 3.7 |
| 279.1 ± 0.1 | 9 ± 1 | 67.260 ± 0.003 | 19 ± 1 | ||||
| 33.808 ± 0.002 | 9 ± 1 | ||||||
| 33.629 ± 0.002 | 8 ± 1 | ||||||
| Sep 26 | 2423 ± 4 | 48 ± 1 | 286.2 ± 0.2 | 14 ± 1 | 67.238 ± 0.008 | 19 ± 1 | 4.3 |
| 305.7 ± 0.2 | 13 ± 1 | 33.809 ± 0.004 | 9 ± 1 | ||||
| 33.617 ± 0.005 | 7 ± 1 |
Note. aAll dates are year 2010.
Download table as: ASCIITypeset image
3. ORBITAL LIGHT CURVES AND PERIODS
At quiescence, V455 And displays a double-humped orbital modulation in the optical (peak-to-peak amplitude of 0.1 mag) and a shallow (0.1 mag) eclipse (see Figure 7 of Araujo-Betancor et al. 2005) due to the eclipse of the hot spot. The hump morphology is clearly evident in the optical on most nights, although the eclipse is more difficult to detect. The light curves in July, especially July 27, are noticeably flat compared to the later data in September and October. As V455 And was still about 0.5 mag above its quiescent visual magnitude in 2010, it is likely the disk had not yet regained its quiescent properties. The double-hump structure, with peaks at 0.75 and 0.25 orbital phase, is typical of low-mass transfer rate dwarf novae such as WZ Sge (Patterson et al. 1998) and thought to be due to the disk structure caused by the impact of the mass transfer stream and overflow to the opposite side of the disk. The double-hump structure is also apparent when looking at the periods found in the DFT, where the 81 minute period is not typically seen but rather the power present at half this period (∼40.5 minutes; see Table 4). The quiescent superhump signal of 83.38 minutes or its harmonic power is not detected in any of the DFTs with the one exception of the night of 11 September, where the half-period of 41.40 minutes is strongly evident in the DFT (Figure 7).
The GALEX NUV data from the two runs were phased from the ephemeris of Araujo-Betancor et al. (2005), and averaged within 0.05 phase bins to search for any orbital variation. The results are shown in Figure 13. The August data show a single-humped 0.2 mag variation peaking near phase 0.1 with a slight dip at phase 0. On the other hand, the September data do reveal a double-humped variation of slightly lower amplitude (0.15 mag). Neither the unbinned nor the binned data show convincing evidence of an eclipse in the NUV. While the 29 s time resolution of the NUV data makes an eclipse harder to detect, the eclipse lasts about 0.1 phase in the optical (Araujo-Betancor et al. 2005) and this would have been visible in the unbinned data. This implies that the source of the NUV light does not have a significant component from the spot. Time-resolved UV data on eclipsing systems have shown spot temperatures from 11,000 K–20,000 K (Szkody 1987) for systems with orbital periods above 3 hr. Since the orbital period of V455 And is much shorter, its mass transfer rate is much less, and its white dwarf is much cooler (10,500 K versus 15,000–20,000 K), the NUV may well be dominated by the white dwarf and the spot may be a minor contribution to the light.

Figure 13. NUV light curve from GALEX UT 2010 August 26 and September 21 runs folded on the 81.08 minute orbital period. Each cycle is repeated twice for ease of viewing and binned to 0.05 phase.
Download figure:
Standard image High-resolution imageTo look for the superhump period, we also binned the NUV data on the photometric period of 83.38 minutes, using the same start time as for the orbital phase. Figure 14 shows the superhump variability on the two dates. The variations are similar to the orbital phasing. Due to the relatively short length of the GALEX data strings (5–7 hr or 4–5 binary orbits of V455 And), the offset between the orbital and superhump phase is only about 0.1 phase, and so the resulting variability is likely a combination of the orbital and superhump effects.

Figure 14. NUV light curve from GALEX UT August 26 and September 21 runs folded on the 83.38 minute photometric (superhump) period. Each cycle is repeated twice for ease of viewing and binned to 0.05 phase.
Download figure:
Standard image High-resolution imageThe shortness of the NUV data sets also precludes a meaningful search for any variation on the 3.5 hr spectroscopic period as less than half of the phases within a cycle at this period is covered during August and September. Within the available coverage, there is no significant variation found.
A comparison of the NUV light curves of V455 And to those of GW Lib at the same time post-outburst (Bullock et al. 2011) shows noticeable differences. GW Lib showed large amplitude (0.4 mag) variations on a timescale of 210–230 minutes while V455 And shows variability only on the shorter orbital and superhump timescales. While GW Lib and V455 And have very similar orbital periods, the inclinations are very different (11 deg versus 75 deg) such that there is a better view of the inner disk regions in GW Lib. In addition, the white dwarf was much hotter in GW Lib during 2010 (19,000 K; Szkody et al. 2012) and its outburst was 1 mag larger in amplitude so these differences would affect the inner disk structure and the NUV light.
4. WHITE DWARF SPIN
In the high frequency range the signals identified as the white dwarf spin period at 67.62 s and the beat with the spectroscopic period at 67.25 s are consistently detected in the optical data (Table 4). As in Araujo-Betancor et al. (2005), the amplitude of the beat frequency is larger than the spin, but the amplitudes in the first harmonics are reversed so that the spin is larger. From a long campaign, S. Pyrzas et al. (2012, in preparation) identified the 67.62 s period as the correct spin period due to its stability and presence in the X-ray regime. There appears to be no significant change in the white dwarf spin period from pre- to post-outburst. Surprisingly, the spin period in the two NUV data sets is the prominent frequency that emerges with higher amplitude than the beat (Figures 11 and 12). If the ∼3.5 hr spectroscopic period is from the outer disk area, this may influence the NUV to a lesser extent than the optical, and like the X-ray, the UV is more influenced by the plasma closest to the white dwarf.
Since the NUV time resolution is worse than the optical, and large gaps are created by the satellite orbit, and the signal-to-noise ratio is lower than the optical, the amplitudes of the spin and beat periods are adversely affected in a comparison of the NUV and optical wavelengths. We did a test of these effects on the observed amplitude by rebinning the September 25 optical data to 30 s, putting in similar orbit gaps to the GALEX September 21 data, and shortening the total time span of coverage to match the NUV data span. The result of this DFT is shown in Figure 15. It is apparent that the primary effect is to broaden the detected frequency, while reducing the amplitude by about 20%. Comparing the 30 s binned and truncated September 25 data (Figure 15) to the NUV September 21 data (Figure 12), the amplitudes are about 2.3 times larger in the NUV than the optical. This is consistent with an origin of the spin on or close to the white dwarf, areas which contribute a larger fraction of the NUV light than the optical.
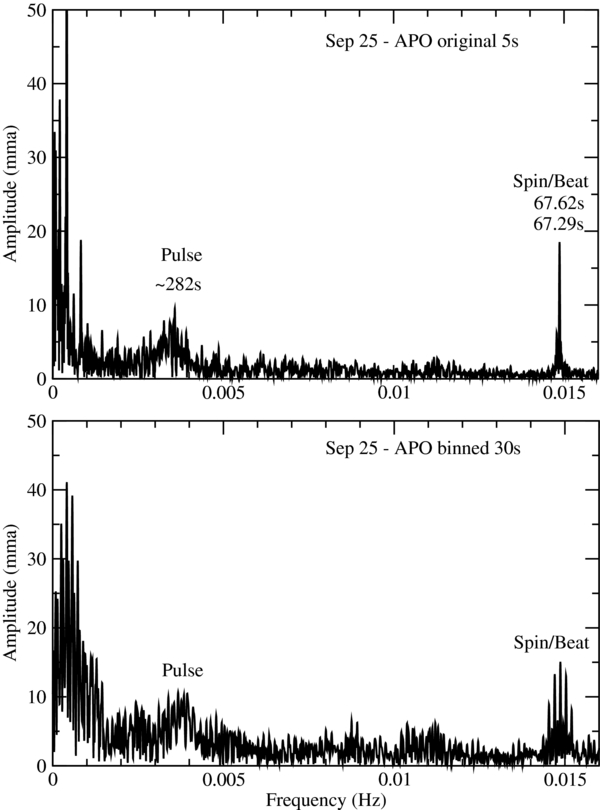
Figure 15. DFTs for UT 2010 September 25 with original 5 s exposures (top) and 30 s binned exposures with gaps and length comparable to the UT 2010 September 21 GALEX time sequence (bottom). Comparison in amplitudes can be found in Table 4.
Download figure:
Standard image High-resolution image5. POSSIBLE NON-RADIAL PULSATION
In order to test the stability of the potential non-radial pulsation and other periods, we took the longest data set (September 25) and divided the night in half and computed the periods from each half. The result is shown in Figure 16. Changes in the amplitudes of the orbital, beat of the spin, and spectroscopic period and its harmonics are evident on timescales of a few hours. The broad power in the ∼282 s (4–5 minute) periodicity also shows large variability, similar to the cataclysmic variables discussed in Uthas et al. (2012). At quiescence, the excess power seen at 5–6 minutes (Araujo-Betancor et al. 2005; Pyrzas et al. 2012, in preparation) is tentatively attributed to non-radial pulsations of the white dwarf, although we are unable to prove conclusively that these are indeed non-radial pulsations given their broad and incoherent structure. Many similarities exist between the non-radial pulsations observed in ZZ Ceti stars and the features seen in the power spectra for all of the 16 GW Lib class members (see Section 4 discussion in Uthas et al. 2012) suggesting that the most likely source of these signals is non-radial pulsations in the white dwarf primary. This appears to be true for V455 And as well. Excess power is visible in the optical DFTs (Figures 3–10, Table 4) and also in the GALEX data (Figures 11 and 12). Figure 15 shows that this broad excess is relatively unaffected by the different sampling times of the NUV data.

Figure 16. DFT for APO Night 2 (UT 2010 September 25) isolating the four periods evident in the data (top four panels) for the first half-night run (top), the second half-night run (middle), and the combined run (bottom), respectively. The periods represented are the system's orbital period (4860 s; 81 minutes), the main non-radial pulsation mode (∼282 s; 4–5 minutes), the white dwarf spin and beat (67.62 s and 67.25 s), and the first harmonics of the white dwarf spin and beat (33.81 s and 33.64 s). The bottom panel is the combined light curve's DFT.
Download figure:
Standard image High-resolution image
The observed periods at three years post-outburst are in the range of 257–306 s (4.3–5.1 minutes), significantly shorter than the pre-outburst data. There is power detected close to 5 minutes in the July 27 MRO DFT (291 s) and in both the August and September GALEX DFTs (306.4 s and 305.7 s, respectively) which are likely part of this broad pulse. The thermal timescale at the base of the convection zone dictates the driving frequency in ZZ Ceti pulsators (Brickhill 1992; Goldreich & Wu 1999; Wu 2001; Montgomery 2005). As the base of the convection zone moves deeper into the star with cooling, and the thermal timescale increases, we expect pulsators closer to the red edge of the instability strip to show longer periods compared to the relatively hotter variables closer to the blue edge. This correlation between the mean pulsation period and spectroscopic temperature is well established for the ZZ Ceti class of pulsators (Clemens 1993; Kanaan et al. 2002; Mukadam et al. 2006). The resultant heating from the increased accretion onto the white dwarf during the 2007 outburst event is likely to have resulted in these shorter periods. The shorter periods can be caused by higher surface temperatures which excite modes with shorter periods or the higher temperature of the surface layer could increase the local buoyancy (Arras et al. 2006; Townsley et al. 2004). However, the behavior of accreting pulsators, with different compositions, spins, and masses than ZZ Ceti stars, is not known.
Comparison of the NUV to optical amplitudes (September 21 and 25) of the pulsation results in a ratio similar to that for the spin (factor of 2.3 higher in the NUV). While this would indicate that the origin of the spin and the potential pulsation is the same (the white dwarf), the larger amplitude of the pulsation combined with the reduced amplitude of the spin in the August NUV data (Figure 11) is puzzling. The differences in the orbital NUV light curves (Figure 13) between the two months may indicate that the disk is not a constant entity and due to the high inclination of V455 And may interfere with the view of the white dwarf. The ratios of the NUV/optical amplitudes are much lower than the values of 6–17 seen in the FUV/optical ratios at quiescence (Szkody et al. 2002, 2007) for several other accreting pulsators. The observed ratio depends on the increased limb darkening in the UV compared to the optical regime and so the mode of pulsation (Robinson et al. 1995) will be dependent on the UV wavelength observed. The ratio of two is consistent with low order modes (Kepler et al. 2000) for the NUV wavelength. However, GW Lib at three years post-outburst also shows a UV/optical amplitude ratio of two for the single pulse apparent after outburst (Szkody et al. 2012), where the UV coverage was 1130–2000 Å. By year 4, this ratio had increased to a factor of five. However, a comparison of mode behavior in the changing conditions of accreting pulsators with models for simple hydrogen DAV white dwarfs is likely not appropriate.
We considered the possibility that the broad spread in power around 282 s could be associated with the long-period dwarf nova oscillations (lpDNOs) found by Warner (2004) where the lpDNOs have periods ∼4 × longer than DNO's. While the 282 s pulse is roughly 4 × the 67.6 s spin, the spin is coherent, not a DNO, and there is no plausible mechanism to produce any factor of four coupling to the spin. Thus, we ruled this out as a viable possibility for the 282 s period.
6. CONCLUSIONS
Optical and NUV light curves during 2010, three years after the large amplitude dwarf nova outburst of V455 And, show similarities and differences with the pre-outburst optical light curves.
- 1.The double-humped orbital and superhump variations evident in the optical pre-outburst light curves are sometimes but not always present at three years post-outburst. The disk has not yet appeared to settle into its quiescent state.
- 2.There is no convincing evidence for an eclipse in the NUV, indicating that the hot spot may not be a major contributor at short wavelengths.
- 3.The spin/beat period of the white dwarf appears to have about a factor of two larger amplitude in the NUV than the optical, pointing to an origin close to the white dwarf.
- 4.A broad photometric variation (non-radial pulsation) similar in shape to the quiescent pulsation is apparent in the NUV and optical post-outburst DFT, but it exists at a shorter period of 4.7 minutes at three years post-outburst compared to the 5–6 minute period evident at quiescence. The NUV/optical amplitude ratio is about two, consistent with limb-darkening models with low ℓ modes, yet the increased amplitude in August versus September indicates that changes are occurring on relatively short timescales.
Continued observations in optical and UV wavelengths until V455 And reaches its quiescent state for both its disk and white dwarf will hopefully reveal both the nature of the photometric variation that we believe may be the non-radial pulsation and its progression to its pre-outburst value. The length of time for this to happen will provide insight into the effect of a dwarf nova outburst on the interior of a white dwarf. The accreting pulsator SDSSJ0745+45 revealed the same pulsation spectrum as at quiescence within 3.3 years of its outburst (Mukadam et al. 2011b), indicating that the interior of the white dwarf was not affected by the dwarf nova outburst. SDSSJ0804+51 has twice shown pulsations about a year after outburst, but not at quiescence (Pavenko 2009; Pavenko et al. 2011), possibly indicating an outburst can cause a brief excursion into instability. GW Lib had a completely different pulsation spectrum at three years post-outburst than at quiescence (Szkody et al. 2012), during a time when its white dwarf remained several thousand degrees hotter than quiescence. At this point, there does not appear to be a consistent pattern of cause and effect.
This work was supported by NASA GALEX grants NNX10AM63G and NNX09AF887G and NSF grant AST−1008734. E.J.H. acknowledges support by the M. J. Murdock Charitable Trust. J.J.H. acknowledges the support of the NSF under grant AST-0909107 and the Norman Hackerman Advanced Research Program under grant 003658-0252-2009.
Footnotes
- *
Based on observations obtained with the Apache Point Observatory (APO) 3.5 m telescope, which is owned and operated by the Astrophysical Research Consortium (ARC), the McDonald Observatory 2.1 m telescope which is owned and operated by the University of Texas at Austin, the Manastash Ridge Observatory 0.76 m telescope which is operated by the University of Washington, and observations made with the NASA Galaxy Evolution Explorer. GALEX is operated for NASA by the California Institute of Technology under NASA contract NAS5-98034.
- 7
- 8
IRAF is distributed by the National Optical Astronomy Observatory, which is operated by the Association of Universities for Research in Astronomy, Inc., under cooperative agreement with the National Science Foundation.