


ABSTRACT
We determined the present-day mass functions (PDMFs) of the five intermediate-age star clusters Lindsay 1, Kron 3, NGC 339, NGC 416, and Lindsay 38 and the old star cluster NGC 121 in the Small Magellanic Cloud (SMC) based on observations with the Hubble Space Telescope Advanced Camera for Surveys. The global PDMFs are well matched by Salpeter-like power laws from their main-sequence turnoffs to ∼0.6 M☉ with a power-law exponent α ranging from 1.51 ± 0.11 (Lindsay 1) to 2.29 ± 0.15 (NGC 339). We derive total stellar masses of ∼105 M☉, except for Lindsay 38, whose mass is of the order of ∼104 M☉. Differences between the PDMFs most likely reflect the varying stages of dynamical evolution of the clusters. These SMC clusters do not follow the α versus concentration parameter c correlation as found for Galactic globular clusters of similar mass. This might be an age effect or due to their location in a galaxy where bulge and disk crossings do not play a role. No correlation is found between α and the cluster core and tidal radii (rc and rt, respectively), the half-light radii rh, age, central surface brightness, metallicity, and galactocentric radius rgc. All six clusters mass-segregated to different degrees. The two clusters Lindsay 1 and Kron 3 barely show signs for mass segregation, but have low-mass star deficient global PDMFs and might be the remnants of star clusters whose outer parts were stripped. A trend exists between the degree of mass segregation and the ratio age/relaxation time tr, h, which indicates the stage of dynamical evolution for a cluster. Our data thus suggest that the SMC clusters in the present sample had a range of initial densities and presumably different amounts of mass loss that led to different rates of dynamical evolution. The clusters' positions in the rh, m/rt versus r0/rh, m plane imply that all of the clusters are tidally filled. Our SMC clusters with projected distances larger than 3 kpc from the SMC center should have Jacobi radii significantly larger than their observed King tidal radii. The clusters also have higher mean densities than the estimated central density of the SMC. It is possible that these clusters formed in a denser overall environment of the younger SMC, or that the cluster structures were unusually strongly influenced by encounters with giant molecular clouds.
Export citation and abstract BibTeX RIS
1. INTRODUCTION
The Small Magellanic Cloud (SMC) is the only dwarf galaxy in the Local Group containing populous intermediate-age star clusters of all ages. As one of the closest star-forming galaxies, the SMC is also a preferred location for detailed studies of star clusters. A key question concerns the evolution of star clusters, specifically, the number distribution of stars as a function of mass, the present-day mass function (PDMF). Determining the global PDMF of a star cluster is a complex task that requires deep photometry of the usually crowded cluster central regions, careful completeness corrections, and corrections of field star contamination.
A star cluster composed of single stars tends to evolve toward equipartition of kinetic energy among stars of different mass (Spitzer 1987). During the dynamical evolution of a star cluster, high-mass stars concentrate in the center of the cluster, while the low-mass stars move toward its periphery, as described by King (1958). An increasing number of mass-segregated young star clusters has been discovered indicating that mass segregation already occurs in the earliest stage of life. Mass segregation has been detected in young open Galactic clusters (e.g., Jones & Stauffer 1991; Pandey et al. 1992; Shu et al. 1997; Raboud & Mermilliod 1998; Hillenbrand & Hartmann 1998), the young Galactic cluster NGC 3603 (Harayama et al. 2008; Pang et al. 2010), old Galactic globular clusters (GGCs; e.g., Cote et al. 1991; Pandey et al. 1992; Paresce et al. 1995; King et al. 1995; Ferraro et al. 1997; Andreuzzi et al. 2000; Howell et al. 2000; Koch et al. 2004), as well as young star clusters in the Large Magellanic Cloud (LMC; e.g., de Grijs et al. 2002a, 2002b; Gouliermis et al. 2004). We define star clusters as being young when they have ages smaller than 1 Gyr and as being of intermediate age when they have ages between 1 and 10 Gyr. We consider star clusters with ages larger than 10 Gyr as being old. The SMC is an ideal laboratory in which to analyze PDMFs of populous intermediate-age star clusters, because the SMC is sufficiently close to resolve individual stars well below the main-sequence turnoffs thanks to the Hubble Space Telescope (HST). Moreover, due to its low stellar mass density, the large number of clusters contained by the SMC are minimally affected by external tidal effects. Their dynamical evolution is therefore dominated by internal effects. In the Milky Way, no populous intermediate-age star clusters have been found.
Dynamical mass segregation (Spitzer 1969, see also, e.g., Lightman & Shapiro 1978; Meylan & Heggie 1997) combined with stellar evaporation may lead to the preferential loss of lower-mass stars. Since these stars are more likely to populate the outermost regions of a cluster, they are most prone to becoming unbound due to their lower binding energy. Therefore, it is expected that the average PDMF of a star cluster gets flatter as the cluster becomes dynamically older. Until now PDMFs have been determined for only three young SMC star clusters (with exponents in the range of 2.20 ± 0.30 < α < 2.43 ± 0.18; Sirianni et al. 2002; Gouliermis et al. 2004; Sabbi et al. 2008; Schmalzl et al. 2008; Cignoni et al. 2009), where α is 2.3 for the Kroupa initial mass function (IMF; see also Salpeter 1955), while for intermediate-age and old SMC star clusters, PDMFs have not been calculated before.
This paper presents global PDMFs of the six rich SMC star clusters NGC 121, Lindsay 1, Kron 3, NGC 339, NGC 416, and Lindsay 38. The observations were obtained with the Advanced Camera for Surveys (ACS) aboard HST.
In Section 2, we give an overview of the data and the reduction process, which has been described in detail in Glatt et al. (2008a, Paper I) and Glatt et al. (2008b, Paper II). In Section 2, we also describe the corrections we applied to the photometry. In Section 3, the methodology used to determine the global PDMF for each cluster in the present sample is described and the spatial variations of the PDMF are discussed. An estimate of the clusters' total masses and relaxation times is given in Section 4. Section 5 discusses possible correlations between the slope α of the PDMF and the clusters' structural parameters and their astrophysical implications. Section 6 presents our conclusions.
2. OBSERVATION AND DATA REDUCTION
2.1. Photometry
The SMC star clusters NGC 121, Lindsay 1, Kron 3, NGC 339, NGC 416, and Lindsay 38 were observed with the HST/ACS (GO-10396; principal investigator: J. S. Gallagher III) between 2005 August and 2006 March (Table 1 in Paper I). The images were taken in the F555W and F814W filters, which closely resemble the Johnson V and I filters in their photometric properties (Sirianni et al. 2005). All clusters were observed with the Wide Field Channel (WFC) of ACS. For the dense central regions of NGC 121 and NGC 416 also images from the High Resolution Camera (HRC) are available. Each WFC image covers an area of 200'' × 200'' at each pointing with a pixel scale of ∼0.05 arcsec. The HRC images cover an area of 29'' × 26'' each with a pixel scale of ∼0.025 arcsec.
The data sets were processed adopting the standard Space Telescope Science Institute ACS calibration pipeline (CALACS) to subtract the bias level and to apply the flat field correction. For each filter, the short and long exposures were co-added independently using the MULTIDRIZZLE package (Koekemoer et al. 2002). Cosmic rays and hot pixels were removed with this package and a correction for geometrical distortion was provided. The resulting data consist of one 40 s and one 1984 s exposure (1940 s for Lindsay 38) in F555W and one 20 s as well as one 1896 s exposure (1852 s for Lindsay 38) in F814W.
The detection thresholds were set at 3σ above the local background level for Lindsay 1; 1σ for Kron 3 and NGC 121; and 4σ for NGC 339, NGC 416, and Lindsay 38 in order to detect even the faintest sources. These detection thresholds were chosen based on the different crowding levels of the individual clusters. The photometric reduction was carried out using the DAOPHOT package in the IRAF6 environment on DRIZZLEd images. The exposure times, the selection cuts, and the photometry are described in Papers I and II and we refer to these two papers for detailed information. Our approach is to derive luminosity functions (LF) from completeness-corrected data. We then convert the LFs to PDMFs fitting isochrones to the main sequence.
2.2. Corrections
2.2.1. Field Star Contamination
The SMC field star contamination can have a severe effect on the clusters' PDMFs. NGC 416 is located in the wing of the SMC and therefore its color–magnitude diagram (CMD) shows strong SMC field star features such as, e.g., a broad red giant branch, a luminous blue main sequence, and blue loop stars that belong to SMC field populations younger than the cluster (see Figure 30 in Paper II). NGC 121, Lindsay 1, Kron 3, NGC 339, and Lindsay 38 are located in the outer regions of the SMC and therefore the SMC field is sparse. Nevertheless, the field star population in the SMC's outskirts has to be accounted for when computing the PDMFs. Sabbi et al. (2009) analyzed and discussed six SMC fields observed in the same program as the SMC star clusters discussed here. The field SFH-107 (17,120 stars) is located in the wing of the SMC and is closest to NGC 416 (d ∼ 37.5 arcsec). Therefore, it was used to subtract the SMC field star population from the cluster's CMD. For the four clusters NGC 121, Lindsay 1, Kron 3, and NGC 339 the SMC field SFH-8 (2,528 stars) located in the SMC halo was used for the field star subtraction.
The PDMF of Lindsay 38 was not corrected for contamination. Although the cluster is sparse (only 3716 stars), it is located in the outermost regions of the halo (see Figure 44 in Paper II) where the SMC field star contamination is negligible. For both clusters and fields the same quality cuts were applied and the luminosities were corrected for reddening. Saturated foreground stars and background galaxies were discarded by using Source Extractor (Bertin & Arnouts 1996).
We perform a statistical field star subtraction over the entire CMD. First, we corrected the SMC field stars for completeness (only as a function of magnitude, see Section 2.2.2). The errors in both magnitude and color of each cluster and field star were assigned by DAOPHOT. To subtract the field stars from the cluster sample, the field CMD was plotted on top of the cluster CMD. Because the field CMD is so rich, one field star could not be clearly "assigned" to one cluster star. Therefore, we defined an area around each field star spanned through its errors in both color and magnitude. From those cluster stars lying inside this area, one randomly chosen observed cluster star was then subtracted from the cluster sample. This procedure was repeated 100 times in a Monte Carlo fashioned to check if the random choice of the subtracted stars changes the overall shape of the LF (which it does not), and to obtain the final number of cluster stars in each magnitude and color bin.
In dealing with the Galactic stellar foreground contamination, we obtained estimates using the TRILEGAL models (Girardi et al. 2005). In the direction of the SMC, Galactic stars do not play a major role as contaminants. Within our field of view only 1–10 foreground stars on the main sequence in each CMD are expected, with negligible effects on the computation of the clusters' PDMFs (see, e.g., Kron 3 in Figure 1).

Figure 1. CMD of Kron 3 with the overplotted SMC field SFH-8 (red crosses), located in the SMC halo. Also shown is the expected location of Galactic foreground stars (blue squares), estimated from the TRILEGAL models (Girardi et al. 2005). The black dash-dotted line indicates the luminosity of the main-sequence turnoff point of Kron 3 (Paper II). Representative error bars (based on the errors assigned by DAOPHOT) are shown on the left for the m555–m814 color.
Download figure:
Standard image High-resolution image2.2.2. Completeness
The photometric completeness is defined as the percentage of the artificial stars successfully recovered compared with the total number of stars added to the data. The completeness corrections on the WFC images were determined for each cluster separately. The completeness factors were determined using the subroutine addstar in DAOPHOT to simulate 1,000,000 artificial stars (in steps of ≈2500 stars) in each long exposure frame. For a detailed description of the procedure we refer the reader to Sabbi et al. (2007). Because most of our clusters have very dense central regions, the completeness varies with radial distance from the cluster center and at all magnitudes. There is an obvious anticorrelation between crowding and completeness: in the central regions the completeness is significantly smaller than in the outer regions. Therefore, the completeness was corrected in magnitude and radius bins. The magnitude bins have a width of 0.5 mag. For the determination of the radial completeness dependence concentric annuli around the cluster center with a width of 200 pixels (10 arcsec) were created. Within each annulus, the completeness factors in each magnitude bin were calculated and statistical corrections where made for the number of missing stars. In Figure 2, the completeness for all six SMC star clusters as functions of magnitude and radius from the cluster center are shown (the lowest curve belonging to the innermost radius).
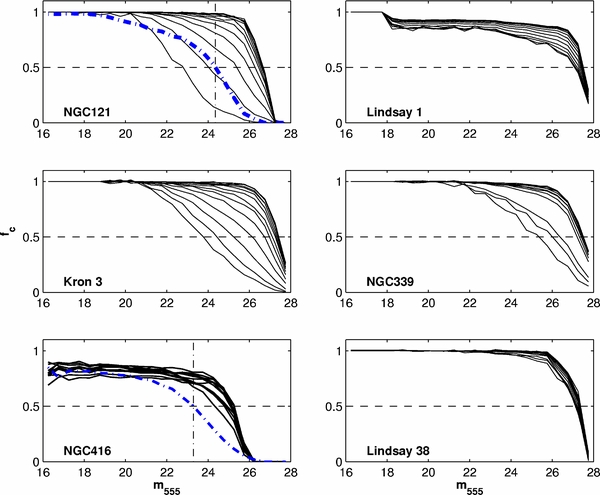
Figure 2. Completeness for the F555W photometry as a function of magnitude and radius. From bottom to top, the completeness curves are shown measured in magnitude bins of 0.5 mag and within 200 pixels wide annuli starting at the clusters center moving outward. The dash-dotted lines indicate the completeness of the HRC data (NGC 121 and NGC 416). The vertical black dashed line shows the 50% completeness level for the HRC data lying at 24.35 mag (NGC 121) and at 23.28 mag (NGC 416).
Download figure:
Standard image High-resolution imageNGC 121 and NGC 416 have very crowded core regions. Hence the completeness drops below 10% within the central regions for stars fainter than m555 = 24.36 mag (NGC 121) and m555 = 23.02 mag (NGC 416) in the WFC data. The central regions are highly affected by crowding and individual faint stars are not resolved. Therefore, these central areas could not be used for the determination of the PDMFs. In our analysis, we determined the PDMFs of these two clusters based on the WFC and the HRC data sets. For the transformation between the HRC and the WFC photometric system the relations given by Sirianni et al. (2005) were used. For the WFC set, we excluded the crowded central regions (∼25 arcsec) from the WFC data. The crowded central area of the WFC data was replaced with the available HRC data. The completeness of the HRC data drops below 50% at a magnitude of 24.35 mag for NGC 121 and of 23.28 mag for NGC 416 (Figure 2). As a consequence the combined WFC+HRC data set contains only stars brighter than these limiting magnitudes.
2.2.3. Area Correction
Because the centers of the observed star clusters are not located in the center of the WFC images, parts of the outer annuli within which we determined the MFs lie outside the cluster images. The correction for the missing coverage within the annuli was done as follows. After the field star subtraction and the completeness corrections, we counted the number of stars in each mass bin within each annulus. For those annuli not covering the entire image, we corrected each mass bin proportionally to the distribution of stars within the covered annulus:

where Acovered is the area of the annulus covered by the ACS/WFC image and Aout is the missing area part.
3. PRESENT-DAY MASS FUNCTION
The PDMF is defined as the fractional number of stars per mass interval. The PDMF of a stellar population is obtained by counting the number of stars in mass intervals. The PDMF is usually approximated by a power law
where ξ0 is a normalization constant and α is the PDMF slope. The function describes the number of stars in the mass interval [m,m+dm]. The canonical Kroupa IMF (Kroupa 2001, see also Salpeter 1955) in the notation used here is 2.3 for the given mass range (0.5 M☉ < m < 1 M☉). Even though the PDMFs are corrected for incompleteness we could not use the entire mass range for the measurements of the slopes due to weak statistical sampling toward the lower mass end. For all clusters one or even two mass bins had to be excluded. We assumed that all stars in a cluster have the same age and the same metallicity. We also cannot reliably take into account the uncertainties due to binary or multiple stars, because these objects are not resolved in our data. We thus make the simplified assumption that all the detected stars are single stars. Binaries are usually not considered in these kinds of studies, but the MF slope becomes steeper if they are included (Kroupa 2002). Therefore, all PDMF slopes derived in this study are lower limits.
3.1. Global PDMF
We obtained the PDMFs for the six old and intermediate-age SMC star clusters NGC 121, Lindsay 1, Kron 3, NGC 339, NGC 416, and Lindsay 38. Table 1 summarizes the properties of these six clusters. The upper mass boundary of the PDMFs is given by the cluster main-sequence turnoffs (Table 2). We derive the global PDMFs on the main sequence, where the relationship between the luminosity of a star and its mass is reasonably well known. In Papers I and II, we used spectroscopic metallicities in order to eliminate metallicity as a free parameter when fitting isochrone models. Mass–luminosity relationships derived from the best-fitting Dotter et al. (2007) isochrones were used to determine stellar masses along the main sequence of each cluster. The determination of the PDMF slopes was not dependent on the particular choice of isochrone set.
Table 1. Cluster Parameters
| Cluster | Age | [Fe/H]ZW84 | m555, TO | Distance | c |
|---|---|---|---|---|---|
| (Gyr) | (mag) | (kpc) | |||
| NGC 121 | 10.5 ± 0.5 | −1.46 ± 0.10 | 22.98 ± 0.05 | 64.9 ± 1.2 | 1.034 ± 0.12 |
| Lindsay 1 | 7.5 ± 0.5 | −1.14 ± 0.10 | 22.36 ± 0.05 | 56.9 ± 1.0 | 0.573 ± 0.10 |
| Kron 3 | 6.5 ± 0.5 | −1.08 ± 0.12 | 22.40 ± 0.05 | 60.6 ± 1.1 | 0.575 ± 0.02 |
| NGC 339 | 6 ± 0.5 | −1.12 ± 0.10 | 22.30 ± 0.05 | 57.6 ± 4.1 | 0.755 ± 0.06 |
| NGC 416 | 6 ± 0.8 | −1.00 ± 0.13 | 22.44 ± 0.05 | 60.4 ± 1.9 | 0.859 ± 0.16 |
| Lindsay 38 | 6.5 ± 0.5 | −1.59 ± 0.10 | 22.36 ± 0.05 | 66.7 ± 1.6 | 0.745 ± 0.04 |
Note. Parameters were adopted from Papers I, II, and III.
Download table as: ASCIITypeset image
Table 2. Global PDMF
| Cluster | Mass Range | α | rh | αrh |
|---|---|---|---|---|
| (M☉) | (arcsec) | |||
| NGC 121 | 0.58–0.82 | 2.28 ± 0.55a | 27.01 ± 2.21 | 1.93 ± 0.27 |
| 0.65–0.82 | 1.43 ± 0.49b | ... | ... | |
| Lindsay 1 | 0.63–0.93 | 1.51 ± 0.11 | 62.45 ± 5.84 | 1.54 ± 0.21 |
| Kron 3 | 0.59–0.92 | 1.59 ± 0.07 | 35.38 ± 1.50 | 1.82 ± 0.13 |
| NGC 339 | 0.56–0.97 | 2.29 ± 0.15 | 41.85 ± 2.37 | 1.95 ± 0.28 |
| NGC 416 | 0.61–0.96 | 1.40 ± 0.25a | 16.96 ± 2.63 | ... |
| 0.67–0.96 | 2.17 ± 0.36b | ... | ... | |
| Lindsay 38 | 0.57–0.94 | 1.74 ± 0.17 | 39.40 ± 1.65 | 2.08 ± 0.51 |
Notes. aThe central parts were excluded from the WFC data due to heavy crowding effects. The data reach down to ∼26.5 mag. bThe central parts were replaced with HRC data and the limiting magnitudes are ∼24.35 mag (NGC 121) and 23.28 mag (NGC 416) due to the photometric depth of the HRC data.
Download table as: ASCIITypeset image
We binned the cluster stars linearly into 8 (NGC 121), 10 (Lindsay 1), 11 (Kron 3), 14 (NGC 339), 13 (NGC 416), and 10 (Lindsay 38) mass bins of equal width of 0.03 M☉. Since our data for the different clusters are of similar depth, the age of the clusters determines the number of possible mass bins. The PDMF slopes were derived from our data points in the log(number) versus log(mass) space. In Figure 3, the resulting PDMFs and the fitted slopes α are plotted. The error bars represent the formal uncertainty (N1/2) in the fits, where N is the number of stars in each mass bin. The systematic uncertainties are clearly larger since, e.g., unresolved binaries cause some flattening of the observed PDMF or there may be offsets between the measured metallicities and the available isochrone models. The measured values are summarized in Table 2.
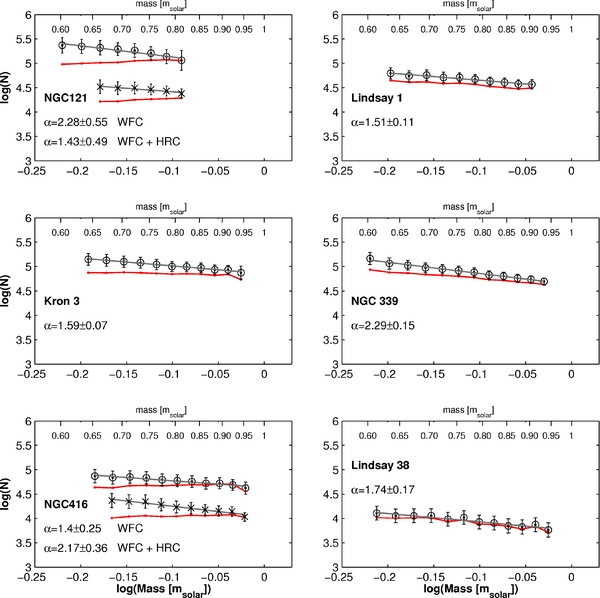
Figure 3. Mass functions of NGC 121, Lindsay 1, Kron 3, NGC 339, NGC 416, and Lindsay 38. The red lines show the mass functions before the incompleteness correction. The open circles include the corrections for the photometric incompleteness. In gray the fitted slopes α are shown. The PDMFs of NGC 121 and NGC 416 measured on the WFC data set are shown as open circles, the PDMFs measured on the WFC+HRC data set as crosses. To put both PDMFs in the same plot, the second one was shifted by log(N) = −1. The error bars are the N1/2 errors.
Download figure:
Standard image High-resolution imageThe PDMF slopes of NGC 121 (WFC data set), NGC 339, and NGC 416 (WFC+HRC data set) are consistent with the Salpeter/Kroupa value. The slopes of the other clusters are flatter. The stated errors are the standard errors of the best-fit slope. The slope for NGC 121 measured on the WFC data set is steeper than the one measured on the WFC+HRC data set. The reason for this result is that in the WFC data set the most massive stars are missing, because they are located in the cluster center due to dynamical mass segregation (see Section 3.2). The low-mass stars, on the other hand, are well represented due to the photometric depth of the WFC data set. The HRC+WFC data set covers the central region of the cluster, but the data do not reach as deep as the WFC data (see Section 2.2.2). Because we miss a large fraction of the low-mass stars but include the high-mass stars from the cluster center, the observed PDMF slope is flatter than the one measured on the WFC data set.
For NGC 416 we find an opposite effect, which we believe is due to uncertainties in the subtraction of the SMC field for this cluster. NGC 416 is located at the base of the wing of the SMC. This part of the SMC is characterized by an increased stellar density that may represent a tidal extension toward the LMC. The CMD is accordingly very rich with strong SMC field star features (see Figure 9, Paper II). Because no adjacent SMC field to NGC 416 is available, we chose SFH-10 for the field subtraction, since it is located in the SMC wing (Sabbi et al. 2009). Because there may be local differences in stellar density within the SMC wing, subtracting SFH-10 may artificially alter the shape of NGC 416's PDMF.
Baumgardt & Makino (2003) performed a large set of N-body calculations to study the influence of mass segregation on the global mass function during a cluster's dynamical evolution. When the high-mass stars sink toward the center and the low-mass stars move outward, the local PDMF changes relative to the global one. The authors found that the differences are smallest at the radii containing between 50% and 80% of the cluster light. Therefore, we adopted the half-light radii rh found in Paper III (Glatt et al. 2009) and measured the PDMF slopes in 200 pixels wide annuli at rh. The slopes αrh and their uncertainties are shown in Table 2. Within the errors the slopes of the overall PDMF and the PDMF measured at the half-light radius are in good agreement.
The half-light radius of NGC 416 lies close to the dense central area in which crowding already severely affects the measurements of the MF. Therefore, no value of αrh could be measured on the WFC data set for this cluster. For both NGC 121 and NGC 416, we also measured αrh on the WFC+HRC data set. In so doing we found that the PDMF slopes are highly uncertain probably due to the small number of remaining stars after discarding all stars below the 50% completeness levels. Therefore, for NGC 416 no value of αrh is given in Table 2, while for NGC 121 only the value measured from the WFC data set is listed.
3.2. The Spatial Variation of the PDMF
In the mass range of 0.5 M☉ < m < 1 M☉, the slope of the canonical Kroupa IMF is 2.3 (see also Salpeter 1955). The slopes of NGC 121 (WFC+HRC data set), Lindsay 1, Kron 3, NGC 416 (WFC data set), and Lindsay 38 are smaller than this value. The noted differences among the observed PDMFs show that the ratio of high- to low-mass stars differs from cluster to cluster. Mass segregation can produce differences in cluster PDMFs since it changes the radial distributions of stellar masses and can lead to loss rates depending on stellar mass (see Section 4).
A strong external gravitational potential can additionally influence the dynamical evolution of a star cluster. For example, when GGCs cross the Galactic plane or venture close to the bulge, the resulting compressive heating can have a stronger effect than evaporation. The strength of the effect depends on the cluster's orbit (see, e.g., Dinescu et al. 1999) and may contribute to the cluster's dissolution (see Odenkirchen et al. 2003; Dehnen et al. 2004). The SMC has a totally different structure and no bulge or disk has to be crossed (Hunter et al. 2003; Lamers et al. 2005; Gieles et al. 2007). We do not know how the clusters' orbit in the SMC. Nevertheless tidal shocking is probably not a significant tidal effect for these clusters.
In Paper III, King profiles and Elson, Fall, and Freeman (EFF; Elson et al. 1987) profiles were fitted to both surface-brightness and star count data of the six SMC clusters discussed in the present study. The surface brightness is dominated by the brighter stars around the main-sequence turnoff and brighter, while the surface density distribution comes from the numerous stars on the lower main sequence. We fitted two sets of King and EFF profiles. The first set was fitted to all observed cluster stars, but for the second set only stars fainter than the main-sequence turnoff and brighter than the magnitude for which the completeness is 50% in the cluster central regions were fitted. A significant difference between the two profiles was found only in NGC 121 which indicates this cluster is significantly mass-segregated.
To further investigate the spatial variations of the PDMF, as an indication of mass segregation, we divided the clusters into four concentric annuli, at radial distances from the cluster centers R ⩽ 10, 30, 50, and 70 arcsec (∼3, 8.5, 14.5, and 20 pc). All annuli lie within the field of view of HST/WFC. Stars brighter than the main-sequence turnoffs were included for this measurement using the same method as before. The best-fitting isochrones from Dotter et al. (2007) for each cluster were used to determine the stellar masses from their mass–luminosity relation. The slope of the radial PDMFs was then determined for each annulus. Each of these MFs was corrected for incompleteness in the corresponding annulus and corrected for SMC field star contamination. For NGC 121 and NGC 416 the WFC+HRC data set was used, because also the center regions are included.
In Figure 4, we show the resulting slopes of the PDMF at the given radii. All star clusters in our sample show mass segregation, but in differing degrees and out to different radial distances. There is a definite trend of the PDMF slope to steeper values with increasing radii for the clusters NGC 121, NGC 416, and Lindsay 38 well outside their scale radii. The half-light scale radius rh in King (1962) analytic profiles exceeds the core radius such that it is larger for lower central concentration. The derived slopes, as a function of the distance from the center, are listed in Table 3. Less pronounced trends of mass segregation appear to exist for the clusters Lindsay 1, Kron 3, and NGC 339.
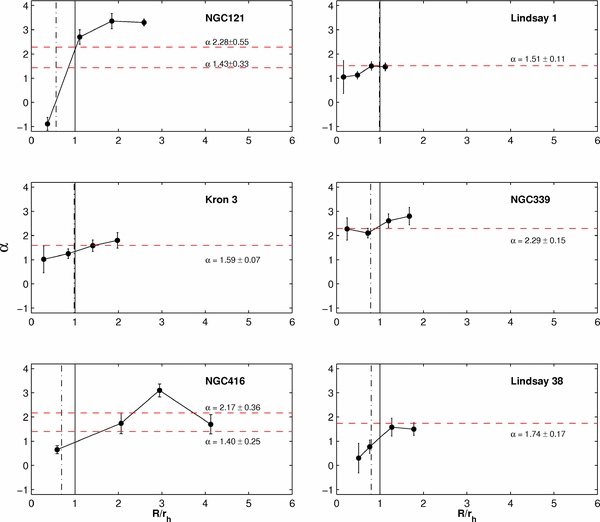
Figure 4. Variations of the PDMF slopes α as a function of R/rh of the star clusters NGC 121, Lindsay 1, Kron 3, NGC 339, NGC 416, and Lindsay 38, where R is the radial distance from the cluster center and rh is the half-light radius. The vertical dash-dotted line represents the ratio between the scale radius r0 and rh and the solid line represents the half-light radius rh adopted from Paper III. For both NGC 121 and NGC 416, the combined WFC+HRC data sample was used (the central region of WFC data was replaced with HRC data, and the limiting magnitude is the 50% completeness limit of the HRC data). The horizontal red dashed line indicates the slope of the global PDMF.
Download figure:
Standard image High-resolution imageTable 3. Mass Segregation
| Cluster | α (r< 10 arcsec) | α (10 arcsec < r < 30 arcsec) | α (30 arcsec < r < 50 arcsec) | α (50 arcsec < r < 70 arcsec) |
|---|---|---|---|---|
| (∼3 pc) | (∼3 pc < r < 8.5 pc) | (∼8.5 pc < r < 14.5 pc) | (∼14.5 pc < r < 20 pc) | |
| NGC 121 | −0.89 ± 0.27 | 2.70 ± 0.30 | 3.36 ± 0.32 | 3.30 ± 0.14 |
| Lindsay 1 | 1.05 ± 0.68 | 1.13 ± 0.16 | 1.50 ± 0.18 | 1.47 ± 0.16 |
| Kron 3 | 1.02 ± 0.28 | 1.25 ± 0.10 | 1.58 ± 0.12 | 1.80 ± 0.16 |
| NGC 339 | 2.27 ± 0.23 | 2.10 ± 0.10 | 2.61 ± 0.14 | 2.80 ± 0.18 |
| NGC 416 | 0.65 ± 0.19 | 1.74 ± 0.43 | 3.10 ± 0.27 | 1.70 ± 0.40 |
| Lindsay 38 | 0.30 ± 0.61 | 0.77 ± 0.27 | 1.58 ± 0.37 | 1.50 ± 0.27 |
Download table as: ASCIITypeset image
Because Lindsay 1 and Kron 3 do not appear to be dynamically evolved due to their low degree of mass segregation, their global PDMFs might not have changed much from their IMFs. If this is the case these clusters did not have a Salpeter/Kroupa-like IMF (α = 2.3).
NGC 339 on the other hand has a PDMF slope consistent with a Salpeter/Kroupa-like IMF. NGC 339 shows only a low degree of mass segregation, but its global PDMF is similar to the Salpeter/Kroupa IMF. The global PDMF of Lindsay 38 lies slightly below two, but shows significant mass segregation and hence evidence of dynamical evolution.
MFs were previously determined only for three young SMC star clusters. For the very young cluster NGC 346, Sabbi et al. (2008) found a slope of α = 2.43 ± 0.18 in the mass range of 0.8–60 M☉ and an age of 3 ± 1 Myr (Sabbi et al. 2007). For NGC 602 Schmalzl et al. (2008) found a MF slope of α = 2.20 ± 0.3 in the mass range of 1–45 M☉ and an age of approximately 4 Myr. For the same cluster, Cignoni et al. (2009) determined a MF slope of α = 2.25 ± 0.22 in the mass range of 0.7–30 M☉. The MF of NGC 330's central region (r < 30 arcsec) has a slope slightly steeper than Kroupa's, with a strong radial gradient that is consistent with mass segregation (Sirianni et al. 2002; Gouliermis et al. 2004). MFs also have been determined in the LMC, but also only for young objects and are mostly consistent with the Salpeter value (α = 2.35) in the respective given mass ranges (Kerber & Santiago 2006, see also Grebel & Chu 2000; Santiago et al. 2001; de Grijs et al. 2002a, 2002b). For all of these young star clusters, mass segregation was detected.
4. ESTIMATES OF THE TOTAL MASS AND RELAXATION TIMES
From the observed PDMFs we estimate the total observed mass Mtot for each cluster (Table 4). The main uncertainty is the low end of the MF which is not known because of the detection limit. The lower mass limit of a cluster is difficult to constrain especially for dense and distant clusters. Therefore, we have to make an educated guess. We extrapolate the observed PDMFs of the clusters down 0.01 M☉ with a Kroupa-like IMF of α = 1.3 in the mass range of 0.08 M☉ < m < 0.5 M☉ and adopted α = 0.3 in the mass range of 0.01 M☉ < m < 0.08 M☉ (Kroupa 2001). Stars brighter than the main-sequence turnoff were also included. The stellar remnants were included by assuming a Kroupa-like IMF of α = 2.3 in the mass range of 1 M☉ < m < 60 M☉. We assumed that stars in the mass range of 1 M☉ < m < 8 M☉ have produced a 0.6 M☉ white dwarf and stars in the mass range of 8 M☉ < m < 60 M☉ have evolved to produce 1 M☉ neutron stars all of which are retained in the cluster (e.g., Liebert et al. 2005; Kiziltan et al. 2010).
Table 4. Calculated Cluster Masses
| Cluster | MMS, obs | Mtota | Mtotb |
|---|---|---|---|
| (M☉) | (M☉) | (M☉) | |
| NGC 121 | 2.10 × 10⁵ | 9.67 × 10⁵c | 5.83 × 10⁵c |
| 7.91 × 10⁴ | 3.42 × 10⁵d | 2.34 × 10⁵d | |
| Lindsay 1 | 7.41 × 10⁴ | 2.56 × 10⁵ | 1.74 × 10⁵ |
| Kron 3 | 1.84 × 10⁵ | 5.84 × 10⁵ | 3.90 × 10⁵ |
| NGC 339 | 1.45 × 10⁵ | 4.82 × 10⁵ | 2.88 × 10⁵ |
| NGC 416 | 9.69 × 10⁴ | 3.35 × 10⁵c | 2.32 × 10⁵c |
| 9.27 × 10⁴ | 2.83 × 10⁵d | 1.43 × 10⁵d | |
| Lindsay 38 | 1.48 × 10⁴ | 5.05 × 10⁴ | 3.35 × 10⁴ |
Notes. aMasses determined using a Kroupa-like IMF (α = 1.3) for stellar masses between 0.08 M☉ and 0.5 M☉; a Kroupa-like IMF (α = 0.3) between 0.01 M☉ and 0.08 M☉, and a Kroupa-like IMF (α = 2.3) for stellar masses between 1 M☉ and 60 M☉. bMasses determined a declining MF for masses <0.5 M☉ (α = −1.0; Richer et al. 2004, 2008) and a Kroupa-like IMF (α = 2.3) for stellar masses between 1 M☉ and 60 M☉. cMasses determined using the entire catalogs excluding the central regions. dCentral regions of WFC data replaced with HRC data and limiting magnitude 24.35 mag (NGC 121) and 23.28 mag (NGC 416).
Download table as: ASCIITypeset image
While it is well established that the slope of the mass function becomes shallower in most stellar systems at low stellar masses, the mass of the slope break and the slope for lower stellar masses are not necessarily universal (Kroupa 2002). Richer et al. (2004, 2008) studied the MS mass function of the GCs NGC 6397 and M4 down to the hydrogen-burning limit. In the cluster core they found mass function slopes of α = −0.7 indicating that these cluster centers lack low-mass stars. Therefore, we calculated the masses of the six SMC star clusters also for a mass function with a linearly declining slope for masses <0.5 M☉ toward less massive stars (α = −1.0). The total masses estimated with this declining slope are roughly 50%–70% of the value we obtain using the Kroupa-like slope extension.
Dynamical evolution is achieved by two-body encounters during which low-mass stars attain higher velocities and occupy larger orbits. High-mass stars will sink toward the cluster center, which leads to dynamical mass segregation. The typical timescale on which a cluster has lost all traces of its initial conditions is given by its two-body relaxation time tr, h. This timescale is significant in the case of mass segregation, because it shows whether the mass segregation is of dynamical origin or not.
We estimated our clusters' present-day relaxation times using the formula given by Meylan (1987):
where rh, m is the half-mass radius (in pc), Mtot is the total cluster mass, and 〈m〉 is the typical mass of a cluster star (both in solar units). As a typical stellar mass 〈m〉 the median mass of the observed mass distribution was taken (Table 5). We estimated the radius within which half of the observed total mass (corrected for incompleteness, missing area, and field star contamination) of the clusters is confined. For NGC 121 and NGC 416 we determined the half-mass radii on the WFC+HRC data set, which includes the central regions of the clusters. The computed relaxation times are of the order of 109 yr and some are comparable to the cluster's ages. Only for NGC 339 is the estimated tr, h larger than the cluster age (by ∼3 Gyr) and therefore this cluster might still be undergoing relaxation. The values of tr, h and the observed rh, m are given in Table 5. The present-day relaxation times calculated here give a simple estimate of the dynamical age for each cluster.
Table 5. Relaxation Times
| Cluster | 〈m〉 | rh, m | rh, m | tr, h | Age/tr, h | Dist. to SMC Center |
|---|---|---|---|---|---|---|
| (M☉) | (arcsec) | (pc) | (Gyr) | (kpc) | ||
| NGC 121 | 0.7327 | 27.11 ± 3.44a | 8.53 ± 0.17 | 3.36 ± 0.92 | 3.13 ± 0.27 | 8.76 ± 1.1 |
| Lindsay 1 | 0.7614 | 59.15 ± 6.05 | 16.32 ± 0.32 | 7.62 ± 1.00 | 0.98 ± 0.11 | 13.28 ± 1.0 |
| Kron 3 | 0.8061 | 29.05 ± 4.21 | 8.53 ± 0.21 | 3.85 ± 0.87 | 1.69 ± 0.21 | 7.19 ± 1.1 |
| NGC 339 | 0.7496 | 52.10 ± 5.02 | 14.55 ± 1.08 | 9.26 ± 1.05 | 0.65 ± 0.08 | 0.73 ± 2.0 |
| NGC 416 | 0.8530 | 19.40 ± 2.74a | 5.68 ± 0.19 | 1.39 ± 0.47 | 4.32 ± 0.33 | 3.94 ± 1.4 |
| Lindsay 38 | 0.7413 | 47.98 ± 4.52 | 15.49 ± 0.36 | 3.71 ± 0.59 | 1.75 ± 0.14 | 6.27 ± 1.3 |
Notes. aDetermined on the HRC+WFC data set.
Download table as: ASCIITypeset image
We expect dynamical evolution to scale with the number of half-mass relaxation times, and thus mass segregation can build up over several tr, h. There is a general trend between the degree of mass segregation and age/tr, h. NGC 416 is the dynamically most evolved cluster in the present sample because of its high age/tr, h value followed by NGC 121 (Figure 5).
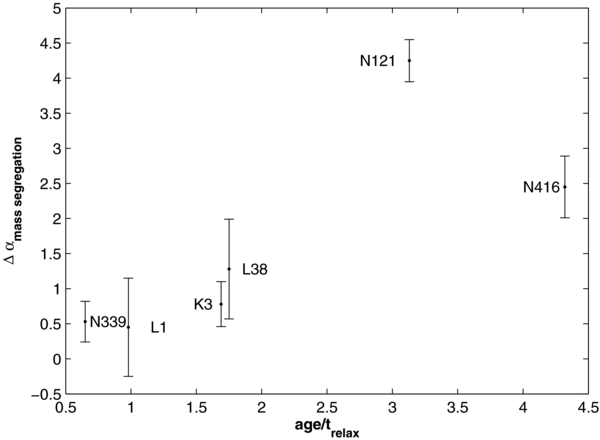
Figure 5. Difference between the highest and the lowest PDMF slope Δα (see Table 3) for each cluster is plotted vs. age/tr, h.
Download figure:
Standard image High-resolution imageOn the other hand, Lindsay 38 is dynamically young and yet shows a significant PDMF gradient. Kron 3 is dynamically only slightly younger than Lindsay 38, but shows only very weak signs of mass segregation. The degree of extensive mass segregation we observe in NGC 416 and Lindsay 38 requires several dynamical times to occur. Because of its dynamically young age, the mass segregation of Lindsay 38 may have originated in a process associated with the early evolution of the cluster, and not via a two-body dynamical process in an originally uniform cluster. While dynamical evolution can certainly foster mass segregation, a number of cluster formation models also assume some degree of primordial mass segregation (see, e.g., Bonnell & Davies 1998; Moeckel & Bate 2010).
Gieles et al. (2010) investigated the break in the mass-radius relation at ∼106 M☉ of hot stellar systems. They found that the initial cluster expands significantly between 10–100 Myr and therefore also its half-mass radius increases. Assuming that the clusters in the present sample did not experience mass loss of more than a factor of 10 (see Figure 3 from Gieles et al. 2010), then the current tr, h is larger than the initial value and the clusters in the present sample may have experienced a more rapid dynamical evolution when they were younger (see also Parmentier & Kroupa 2011; Parmentier 2010). This might be an explanation for the pronounced mass segregation we observe in some clusters, which appear to be dynamically too young (with NGC 121 being an exception) for the degree of mass segregation that we estimate from the present-day tr, h.
5. DISCUSSION
5.1. The De Marchi Diagram and the Clusters' Evolution
De Marchi et al. (2007) compiled the MF slopes in the stellar mass range of 0.3–0.8 M☉ for 20 GGCs of different sizes, concentrations, position in the Galaxy, etc. They found a correlation between the slope of low-mass stellar MFs and the clusters' concentration parameter c (defined as log(rt/rc), where rc and rt are the core radius and the tidal radius, respectively). Apparently, GGCs with small values of c are depleted in low-mass stars, while GGCs with large values of c have steeper MFs. Baumgardt et al. (2008) pointed out that this finding is the exact opposite of what one would theoretically expect, since more concentrated clusters should be dynamically higher evolved and have lost most low-mass stars via evaporation. This results in a flatter MF (Trenti et al. 2010).
Structural parameters of the six SMC star clusters were measured in Paper III. In all three panels of Figure 6, we plotted c versus α for 33 GGCs (Koch et al. 2004; De Marchi et al. 2007; Jordi et al. 2009; Paust et al. 2010, and references therein), and the six SMC star clusters from this study. The dash-dotted line represents an eyeball fit to the distribution of 20 GGCs adopted from De Marchi et al. (2007). The GGC data of Paust et al. (2010) also fit the distribution found by De Marchi et al. (2007), but the SMC clusters shown in Figure 6 do not follow this relation and are located in the lower left quadrant of Figure 6. In the second and the third panel, the clusters are additionally color-coded by age and age/trh, respectively. LMC clusters are not shown, since MF slopes and concentration parameters are not available from the literature.
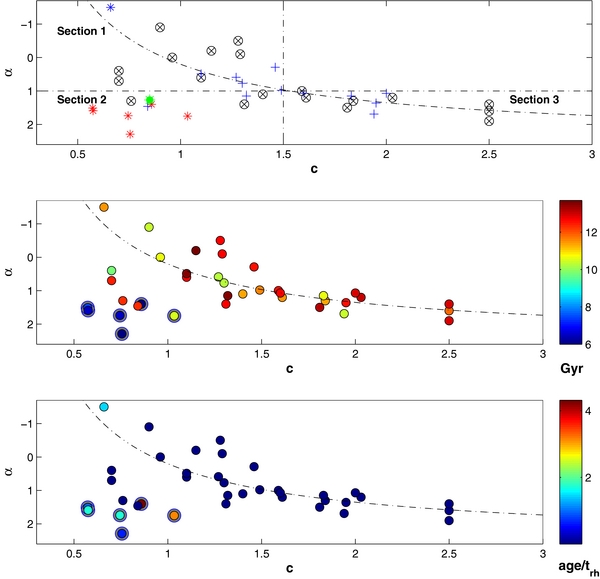
Figure 6. Concentration parameter c vs. MF slope α. The encircled crosses in the upper panel denote the GGCs collected by De Marchi et al. (2007), the green star Palomar 14 (Jordi et al. 2009), the blue asterisk Palomar 5 (Koch et al. 2004), and the blue pluses show GGCs adopted by Paust et al. (2010), while the results from this study are shown as red asterisks. In the lower two panels the cluster are color-coded by age and age/trh, respectively. The dash-dotted line is the eyeball fit (α = 2.3/c − 2.5) to the GCCs adopted from De Marchi et al. (2007). The clusters from the present sample are encircled in gray.
Download figure:
Standard image High-resolution imageLooking at the second panel, the cluster age might be an explanation for the different distribution of the SMC clusters compared to the GGCs. The SMC clusters in the lower left quadrant are all younger than the GGCs. Only NGC 121 with an age of 10.5 ± 0.5 (Paper I) has an age similar to some of the younger halo GGCs (e.g., NGC 288, NGC 362, or NGC 5904). The absolute ages of the GGCs shown here were adopted from Marín-Franch et al. (2009, see also Forbes & Bridges 2010), Sabbi et al. (2007), Koch et al. (2004), and Jordi et al. (2009). If the distribution is age-dependent, the PDMF slopes should become flatter with increasing age to reach the GGC distribution. The clusters lose an increasing number of low-mass stars with increasing age via two-body relaxation (dissolution), which results in a flatter MF slope. On the other hand, the concentration parameter c increases for tidally filled clusters in a weak tidal field (Figure 7).

Figure 7. Schematic of the evolution of star clusters in the rh/rt vs. r0/rh plane.
Download figure:
Standard image High-resolution imageIn the third panel the clusters are color-coded by the ratio age/trh. The GGCs following the eyeball fit to the distribution (De Marchi et al. 2007) are all dynamically highly evolved with the exception of Palomar 5. The SMC clusters in our sample have a higher value of age/trh compared to the GGCs. A possible interpretation is that the clusters in Section 2 are not compact enough to survive a Milky-Way-like environment (see Gnedin & Ostriker 1997 for details) and would dissolve like Palomar 5.
De Marchi et al. (2007) described the dash-dotted line in Figure 6 as an approximate tracer of the evolutionary path of GCs. Clusters with a concentration c ≳ 1.5 at birth evolve toward core-collapse and lose mass via stellar evolution during the first 1 Gyr. Mass loss via evaporation or tidal stripping happens slowly for these clusters and plays a minor role. Their global PDMF does not depart significantly from the IMF at any time. Clusters with a concentration c ≲ 1.5 at birth also evolve toward core-collapse, but mass loss (mostly of low-mass stars) happens faster via relaxation or tidal stripping, particularly if the orbit leads the cluster to cross the Galactic plane or close to the bulge. Therefore, the tidal radius becomes smaller and the global PDMF flattens.
Another explanation for this relation might then be the different structure of the host galaxies. For GGCs low-mass stars are more susceptible to depletion through disk and/or bulge shocks due to their lower binding energy depending on the cluster's orbit. Star clusters having orbits with a short perigalactic distance or frequent disk crossings should be depleted in low-mass stars and have a flatter MF. However, this does not explain the flat PDMF slopes of the SMC star clusters, because in the SMC there is no well-defined disk or bulge to be crossed.
The simplest hypothesis assumes all of the SMC star clusters in the present sample started with the same IMF and the observed intrinsic differences are due to varying initial structures of the clusters. The global PDMFs we see today then are the result of dynamical evolution, which means that the evolutionary paths among the SMC clusters are quite different. One way to investigate the evolution of a star cluster is by using the ratios of the cluster key radii (rc, rh, m, and rt) as described by Heggie & Hut (2003). We plot rh, m/rt versus r0/rh, m in Figure 7 and included two distinct evolutionary paths, which we adopted from Figure 33.2 of Heggie & Hut (2003). r0 is the King core radius as determined for the present cluster sample in Paper III. If the cluster initially is not tidally limited, it behaves like an isolated cluster and follows path A. If the tidal radius is filled at the start of evolution, it follows path B (see chapter 33 of Heggie & Hut 2003 for more details). Since in this case the cluster is tidally filled, rh, m/rt remains constant during the cluster's evolution and rc and rh, m decrease due to violent relaxation in the cluster core region followed by two-body relaxation, mass segregation, and finally core-collapse. From the cluster locations in the rh, m/rt versus r0/rh, m plane all of the clusters in our sample appear to be tidally filled, with three clusters (Lindsay 1, NGC 339, Lindsay 38) likely having significant extra-tidal stellar components. The concentration parameter c for this model increases steadily with time.
In order to investigate the degree of tidal filling, the Jacobi tidal radii rJ for the clusters in our sample are estimated. We adopted

from Chernoff & Weinberg (1990) with Mcl being the total cluster mass, Mgal the total mass of the SMC (2 × 10⁹ M☉; Stanimirović et al. 2004), and RGC the distance between the clusters and the SMC center. The obtained values are listed in Table 6. While the Jacobi radii refer to a three-dimensional distribution, our observed tidal radii are derived from the two-dimensional projected density distribution. A comparison with the discussion of tidal radii by Baumgardt et al. (2009), however, shows that the conversion of our observed radii to three dimensions would make a negligible difference. The Jacobi radius and the tidal radius should theoretically be equal, but the computed Jacobi radii are 3–9 times larger than the King tidal radii derived from EFF profiles (Paper III). A similar mismatch was found for the GGC NGC 2419, which has a King tidal radius of ∼120 pc and a Jacobi radius of 750 pc (Baumgardt et al. 2009). There are several reasons why rJ may differ from rt. For instance, for the used relation it is assumed that the clusters are on circular orbits or that both the galaxy and the cluster are spherical (Binney & Tremaine 2008). Furthermore, surface density or number density data become unreliable in the outer parts due to the uncertain density of background stars or the low number of cluster member stars. Baumgardt et al. (2009) showed that King models refer to physical conditions that do not prevail in nature and that clusters' rt can be significantly smaller than their rJ.
Table 6. Further Parameters
| Cluster | ρrt | rJ | rJ, min | rh, m/rJ |
|---|---|---|---|---|
| (M☉ pc−3) | (pc) | (pc) | ||
| NGC 121 | 1.27 | 476 ± 63 | 163 | 0.02 |
| Lindsay 1 | 0.17 | 464 ± 38 | 104 | 0.04 |
| Kron 3 | 1.90 | 330 ± 54 | 137 | 0.03 |
| NGC 339 | 0.70 | 31 ± 82 | 129 | 0.47 |
| NGC 416 | 4.18 | 150 ± 57 | 114 | 0.04 |
| Lindsay 38 | 0.05 | 128 ± 30 | 61 | 0.12 |
Download table as: ASCIITypeset image
However, the degree of the mismatch between Jacobi and King tidal radius is striking. The SMC has a roughly linear rotation curve to R = 3 kpc and the observed velocities yield a total mass for the SMC of about 2 × 10⁹ M☉ inside that radius (Stanimirović et al. 2004). The density in this region is then about ρ ∼ 0.1 M☉ pc−3. For R > 3 kpc the rotation curve becomes roughly flat, ρ scales as R−2, and the density drops rapidly. Star clusters become tidally limited when their mean density is ≈1/31/3 of the galaxy central density (Chernoff & Weinberg 1990).
Because we do not know the orbits of the clusters in the SMC we calculated rJ, min assuming that the clusters are located 3 kpc from the SMC center. This is a first approximation for rJ set by the conditions at peri-galacticon and a constant density core of the SMC, if the clusters are on elliptical orbits. Comparing this first approximation of the Jacobi radii to the measured King tidal radius, we still find clear differences with the Jacobi radii being 0.7–4 larger.
Another way to look at the tidal radii is via the clusters' mean densities ρrt. The mean densities were calculated (Table 6) and are well above the estimated SMC central density of ∼0.1 M☉ pc−3 in all cases but one (Lindsay 38). The clusters therefore could be significantly more extended than their present King tidal radius and still not be limited by tides from the present-day SMC.
5.2. Astrophysical Implication on the Intermediate-age Clusters
The clusters Lindsay 1, NGC 339, and Lindsay 38 have half-mass radii larger than 10 pc, which classifies them as extended clusters as discovered in the outer regions of various galaxies (e.g., Mackey et al. 2006; Huxor et al. 2008, 2009; Da Costa et al. 2009). Baumgardt et al. (2010) found two distinct groups of GGCs beyond 8 kpc from the Galactic center, with one group being compact and tidally underfilled and the other being extended and tidally filled. Their analysis showed that most likely the extended group was born with large half-mass radii instead of developing them during their dynamical evolution from more compact ones. The initial relaxation times should be much larger due to their size and the clusters should be less dynamically evolved. A similar finding was published by Da Costa et al. (2009) for GCs in dwarf galaxies. Hurley & Mackey (2010) used N-body simulations to investigate the evolution of star clusters within strong and weak tidal fields. They showed that depending on the initial condition it is possible to obtain large values for rh, m in a weak tidal field. Simulations showed that diffuse star clusters can directly form in regions having low background tidal forces (Elmegreen 2008). Star clusters formed in high-pressure regions can have high densities. Interestingly, NGC 339 is located only ∼1 kpc away from the SMC center, while Lindsay 1 and Lindsay 38 have projected galactocentric distances of ∼6 kpc and ∼13 kpc, respectively.
From their global PDMFs, the five intermediate-age clusters can be separated into two groups. In the first group are clusters having a "normal" PDMF slope (NGC 339, NGC 416, and Lindsay 38) and the second group contains those clusters having a flat PDMF slope (Lindsay 1 and Kron 3). Two of the three clusters in the first group show strong indications of mass segregation. NGC 339, which still has a Salpeter/Kroupa-like PDMF barely shows signs of mass segregation. Assuming that the IMF is canonical, the PDMFs we see today for the first group then are the result of dynamical evolution in combination with different initial structures.
Two clusters Lindsay 1 and Kron 3 have relatively flat global PDMFs of α ≈ 1.5 and at most weak indications for mass segregation. It is possible that what we observe are the inner parts of clusters with the outer parts missing in terms of their PDMFs. Therefore, these clusters might be candidates for extensive mass loss via removal of low-mass stars located in the periphery of the clusters that were stripped away or might well have had different IMFs.
All but one cluster in our sample (Lindsay 38) have mean mass densities well above the estimated central density of the SMC. Therefore, they could be considerably larger than observed and not be tidally truncated. All clusters with distances D > 3 kpc from the SMC center have larger Jacobi radii than King tidal radii. The clusters appear to be tidally filled or even overfilled their King tidal radii (see Figure 7). Therefore, the clusters appear to contain extra-tidal stars located between the structural tidal limits and the current Jacobi radii, and thus can still be bound to the cluster. This result is consistent with the findings of Elson et al. (1987) for some LMC star clusters.
One possible process responsible for the tidally filled clusters with the high mean mass densities is a close encounter with a giant molecular cloud (GMC). Gieles et al. (2006) investigated encounters of GMCs with star clusters and found that GMCs might be responsible for the lack of old open clusters in the solar neighborhood. From their simulations we conclude that with a high enough GMC mass and the right encounter properties the SMC clusters in the present sample might have been tidally limited by a GMC encounter.
The Gieles et al. study shows that the star cluster disruption rate scales inversely with the product of the surface density of individual GMCs and global GMC volume density. The SMC is known to contain some GMCs, albeit likely with considerably smaller volume filling factors than in the solar neighborhood of the Milky Way (Mizuno et al. 2001). Higher angular resolution follow-up observations confirm that SMC GMCs have masses extending into the >105 M☉ range (Muller et al. 2010; Bot et al. 2010), or somewhat lower than the 106 M☉ assumed by Gieles et al. The SMC GMCs also appear to be sufficiently dense as to be damaging to a star cluster in a close collision (e.g., Leroy et al. 2009). However, Gieles et al. further note that even with their adopted GMC mass, clusters with Mc > 5 ×10⁴ M☉ are not disrupted. It therefore seems unlikely that interactions between moderately massive star clusters and GMCs in the present-day SMC, with its low GMC densities and clusters on orbits extending well outside the central part of the galaxy where the GMC density is highest, could have a major impact on the survival of moderately massive SMC star clusters.
The possibility that GMCs modify the structures of SMC star clusters, however, is less clear. If we assume that the star clusters with of ages of ∼7 Gyr in our sample move on radial orbits, they could have made as many as ∼102 passages though the main SMC body. This might be sufficient for some clusters to experience the kinds of damaging interaction with a GMC described by Gieles et al., although it is not obvious that this process should be commonplace. The GMC cluster dynamical heating scenario probably requires a rather different SMC than what we see today. The SMC would need to contain a large number of GMCs to affect virtually all of the observed intermediate-age SMC star clusters. This point, however, should be quantitatively examined via a numerical modeling effort along the lines of the Gieles et al. model, a project that lies outside the scope of this paper.
A more speculative explanation is that the clusters formed in a pre-interaction SMC of higher mass and/or density. Orbit simulations of the Magellanic Clouds suggest that the LMC and the SMC have been gravitationally bound to each other since about 1–3 Gyr ago (Besla et al. 2007; Bekki & Chiba 2008; Rŭžička et al. 2010). Close encounters between the Clouds could have caused a significant amount of gas to be stripped from the SMC, such as, e.g., the Magellanic Stream, which probably formed ∼2.5 Gyr ago (Nidever et al. 2010). Tsujimoto & Bekki (2009) suggest that the SMC experienced a major merger such that two putative progenitor galaxies of the SMC merged around 7.5 Gyr ago.
The fact that some of the clusters in the present sample have similar ages but show significant differences in structure is an indication of evolution resulting from different initial structures or environments. Star clusters have a range of initial structures which influence their evolution and consequently their destruction rates as is also seen in the Milky Way (e.g., Gnedin & Ostriker 1997). We conclude that the clusters in our SMC sample formed in a denser overall environment or encountered GMCs, which led them to become tidally limited. In addition, it seems likely that the clusters had a variety of initial structures, were possibly initially mass segregated, that led to different rates of dynamical evolution (Kruijssen 2009).
5.3. Astrophysical Implication for NGC 121
NGC 121 is the oldest and only globular cluster in the SMC with an age of 10.5 ± 0.5 Gyr (Paper I) and thus is 2–3 Gyr younger than the oldest Galactic and LMC GCs. On the other hand, some of the youngest Galactic and Sagittarius GCs are ∼2 Gyr younger than NGC 121. NGC 121 is dynamically evolved, which is indicated by its high degree of mass segregation and its high age/tr, h value. The cluster's mean density is much higher than the central mean density of the SMC and apparently the cluster is tidally filled. Therefore, also for this cluster we conclude that its tidal limit is set by an environment much more massive than the present-day SMC or by an encounter with a GMC (Gieles et al. 2006).
There is a subsample of Galactic halo clusters that appear to be significantly younger than the average GGC population (e.g., Rosenberg et al. 1999; Salaris & Weiss 2002). Comparing the mass of NGC 121 to these GGCs, we find that some of them have masses a magnitude lower than NGC 121, of the order of 104 M☉ (Gnedin & Ostriker 1997), but these clusters are associated with the Sagittarius dwarf spheroidal galaxy (e.g., Whiting 1, Arp 2, Ter 7; Carraro et al. 2007, and references therein). Those GGCs for which structural parameters and MF slopes are available in the literature show a large variety of values (e.g., De Marchi et al. 2007; Paust et al. 2010). If we were to place NGC 121 into the Galactic halo, the cluster would not stand out of the GGC sample regarding its structural parameters.
5.4. Correlations between PDMFs and Other Parameters
We searched for correlations between the PDMF slopes of our SMC clusters with rc, rt, rh, cluster age, central surface brightness, and distance to the Galactic center rGC. To find a possible correlation associated with the De Marchi Diagram we divided Figure 6 into three sections. Section 1 contains clusters with α <1 and c < 1.5, Section 2 contains clusters with α >1 and c < 1.5, and Section 3 contains clusters with α >1 and c > 1.5. The SMC star clusters are located in Section 2. In Figure 8, we plotted α versus rc, rt, rh, cluster age, central surface brightness μV, 0, metallicity (on the scale of Carretta & Gratton 1997), and the galactocentric distance rGC to find possible correlations. The values for the GGCs' rc, rt, and the central surface brightness were adopted from Harris (1996) and Paust et al. (2010). The absolute GGC ages and metallicities were adopted from Forbes & Bridges (2010, see also Marín-Franch et al. 2009). The parameter rGC for the six SMC clusters in this study was adopted from Paper II and the parameters rc and rt were adopted from Paper III and were included in the plots as red asterisks. We are aware of the fact that the SMC clusters live in a different dynamical environment to the GGCs and plotting them together may not be fully valid.

Figure 8. Relations between α and rc, rt, rh, cluster age, central surface brightness, and distance to the Galactic center rGC (Harris 1996; Forbes & Bridges 2010; Paust et al. 2010). For the SMC clusters their distance to the SMC center was determined in Paper II. The GGCs from Section 1 are shown as filled circles, Section 2 as crosses, and Section 3 as diamonds. The SMC clusters are symbolized as red asterisks. For NGC 121 and NGC 416, we added in the fourth panel the slopes from the WFC+HRC data set as blue asterisks.
Download figure:
Standard image High-resolution image
Paust et al. (2010) found a correlation between α and the central surface brightness for the 17 GGCs in their sample. Adding the six SMC clusters from this study to the sample of Paust et al. (2010), we find α and the central surface brightness are not correlated. We need to take into account that surface brightness is dominated by stellar evolution. If we assume that the central surface density remains constant for clusters of their age (none of them has undergone core-collapse) and the PDMF slopes get flatter with increasing age, the SMC star clusters, when getting older, should move downward in the α–μV, 0 plane. NGC 121 has an age of ∼10.5 Gyr and therefore is the only cluster with a comparable age to some of the GGCs. The PDMF slope measured on the WFC data set is comparable to the Salpeter/Kroupa IMF (α = 2.3). Therefore, we added the PDMF slope of NGC 121 measured on the WFC+HRC data set as a blue asterisk to the plot. This slope is flatter and it lies now where the other GGCs' slopes are located. It is exactly the opposite for the PDMF slopes measured for NGC 416. On the WFC data set, α is flatter than measured on the WFC+HRC data set. In Table 7, we give the statistical correlation between α and c, rc, rh, rt, cluster age, μV, 0, [Fe/H], and rGC (for formulae see, e.g., Paust et al. 2010).
Table 7. Parameter Correlations with PDMF Slope
| Parameter | Correlation |
|---|---|
| c | −0.22 ± 0.03 |
| rc | −0.18 ± 0.12 |
| rh | −0.29 ± 0.11 |
| rt | −0.24 ± 0.13 |
| RGC | 0.12 ± 0.04 |
| Age | 0.31 ± 0.09 |
| μV | 0.30 ± 0.09 |
| [Fe/H] | 0.26 ± 0.03 |
Download table as: ASCIITypeset image
Piotto & Zoccali (1999, see also Capaccioli et al. 1993; Djorgovski et al. 1993) found a correlation between α and the galactocentric distance rGC, which was not confirmed by Paust et al. (2010). We did not find any correlation between α and the other parameters either. However, our cluster sample is small and for confirmation of our results a larger sample of SMC clusters is required.
6. SUMMARY
We have presented PDMFs for the six SMC star clusters NGC 121, Lindsay 1, Kron 3, NGC 339, NGC 416, and Lindsay 38, which differ in age, metallicity, and structural parameters. This is the first study of the PDMFs of intermediate-age and old SMC star clusters and triples the number of SMC clusters for which PDMFs are available. The PDMFs are affected by SMC field star contamination and incompleteness. In addition, we had to correct for the missing area coverage due to the field of view of ACS. The resulting PDMFs are well matched by power laws starting from their main-sequence turnoffs down to roughly 0.6 M☉. The clusters NGC 121, NGC 339, NGC 416, and Lindsay 38 have a "normal" PDMF slope similar to or slightly lower than that expected for the Salpeter/Kroupa IMF with α = 2.3 at the given mass range. The slopes of Lindsay 1 and Kron 3 are flatter and depleted in low-mass stars. We confirm that the PDMF around the half-mass radius is consistent with the global PDMF in our sample.
We analyzed the spatial variation of the PDMFs of each cluster in four concentric annuli around the cluster centers and detected mass segregation in all six SMC clusters, but in different degrees. The clusters NGC 121, NGC 416, and Lindsay 38 exhibit the most significant degree of mass segregation.
We give estimates of the total observed cluster masses by extrapolating the PDMFs to a lower mass limit of 0.01 M☉ with a Salpeter/Kroupa-like slope (α = 0.3 between 0.01 M☉ and 0.08 M☉ and α = 1.3 between 0.08 M☉ and 0.5 M☉) as well as with a declining slope (α = −1.0). Stellar remnants were included to an upper mass limit of 60 M☉ with a Salpeter/Kroupa-like slope (α = 2.3) for stellar masses between 1 M☉ and 60 M☉. The two mass estimates differ roughly by 50%–70%. The observed masses determined using the Salpeter/Kroupa-like slope extension are of the order of a few times 105 M☉ and thus are comparable to masses measured for GGCs (Gnedin & Ostriker 1997). From the total mass calculated with the Salpeter/Kroupa slope we estimate the half-mass radii of each cluster, which are comparable to the half-light radii we found in Paper III. Their large rh ⩾ 10 pc and low concentrations for several clusters indicate that these are extended clusters, similar in structure to diffuse star clusters found in the outskirts of some galaxies.
Using the total mass and half-mass radius we estimate the clusters' present-day relaxation times to be of the order of 109 yr. Except for NGC 339, the relaxation times are shorter than the cluster ages. Looking at the ratio age/tr, h we find that the clusters are in different states of dynamical evolution with NGC 121, NGC 416, and Lindsay 38 being the dynamically most evolved, which is confirmed by the high degree of mass segregation found in these three clusters. However, some of the clusters appear to be too dynamically young for the high degree of mass segregation we observe, which might be explained by larger initial relaxation times (Gieles et al. 2010) or initial mass segregation.
Both Lindsay 1 and Kron 3 have a low-mass star deficient global PDMF (α ∼ 1.50), but are barely mass segregated. It is possible that what we observe are only the inner parts of two clusters, which were once larger, with the low-mass stars in the outer parts being stripped away.
All of the clusters appear to be filling or even overfilling their tidal radii based on model fits to the stellar density distribution. The mean densities of all but one cluster are also well above the estimated central density of the SMC. They could be considerably larger than their observed rh and still not be limited by tides from the present-day SMC. While stars extend to outside of the King tidal radii, in most cases they lie well inside the Jacobi radii.
We analyzed a possible correlation between α and the concentration parameter c, previously found for GGCs. The six intermediate-age and old SMC clusters do not follow this correlation, which might be a dynamical age effect or due to their location in a galaxy where bulge and disk passages do not contribute to cluster dissolution. Furthermore, we have searched for correlations between the PDMF slope α and rc, rt, rh, central surface brightness, metallicity, and age but no statistically relevant correlation was found.
Our data suggest that the massive, intermediate-age SMC clusters were born in a denser overall environment, possibly the pre-interaction SMC, which led to them become tidally limited as they expanded following gas and stellar mass loss during the first few 108 yr of their existence. Another possible explanation is that the clusters had close encounters with GMC complexes in the SMC. In addition, it seems likely that the clusters had a range of initial densities and possibly initial mass segregation that led to different rates of dynamical evolution.
K.G. is very thankful to G. Parmentier, A. Pasquali, D. Crnojević, and M. Frank for their support and enlightening discussions. Support for the US component of this HST program GO-10396 was provided by NASA through a grant from the Space Telescope Science Institute, which is operated by the Association of Universities for Research in Astronomy, Inc., under NASA contract NAS 5-26555. Gisella Clementini and Monica Tosi have been partially supported by Cofis ASI-InAF I/016/07/0, and Jay Gallagher also obtained helpful additional support from the National Science Foundation through grant AST0708967, the University of Wisconsin Graduate School and the Heidelberg Graduate School of Fundamental Physics.
Footnotes
- *
Based on observations made with the NASA/ESA Hubble Space Telescope, obtained at the Space Telescope Science Institute, which is operated by the Association of Universities for Research in Astronomy, Inc., under NASA contract NAS 5-26555. These observations are associated with program GO-10396.
- 6
IRAF is distributed by the National Optical Astronomy Observatory, which is operated by the Association of Universities for Research in Astronomy, Inc., under cooperative agreement with the National Science Foundation.
- 7
For field designations, see Sabbi et al. (2009).