


ABSTRACT
We present XMM-Newton observations of the broad absorption line (BAL) quasar FBQS J131213.5+231958. The X-ray spectrum of the source can be well described by an absorbed power-law model in which the absorber is either ionized or only partially covers the continuum source. This can explain the apparent lack of absorption observed in the Chandra spectrum with low signal-to-noise ratio. While the power-law slope of the spectrum is similar to that of non-BAL radio-loud quasars, the Eddington luminosity ratio is likely to be significantly higher than the mean. This shows that in high-mass black holes (BHs), high Eddington accretion may not result in as steep of a spectrum as in lower-mass BHs. This provides important constraints for accretion disk models. It also provides support to the idea that BAL quasars, at least their radio-loud subclass, represent an early evolutionary stage of quasars.
Export citation and abstract BibTeX RIS
1. INTRODUCTION
Recent studies show that the intrinsic fraction of broad absorption line (BAL) quasars, BALQSOs, having rest-frame ultraviolet spectra showing deep absorption troughs displaced blueward from the corresponding emission lines in the high-ionization transitions of C iv, Si iv, N v, and O vi, is ∼20% (Hewett & Foltz 2003; Dai et al. 2008; Knigge et al. 2008; Shankar et al. 2008). These BALs are commonly attributed to material along our line of sight flowing outward from the nucleus with velocities of up to ∼50, 000 km s−1. No broad emission lines are observed with comparable widths, implying that the covering factor of the BAL region must be <20% (Hamann et al. 1993). This observation, together with the fraction of quasars showing BALs suggests that most or possibly all quasars contain BAL-type outflows. Indeed, counting weaker absorption systems, such as mini-BALs, narrow absorption lines, and associated absorptions, the fraction of active galactic nucleui (AGNs) with outflows is at least 40%–60% (Dai et al. 2008; Ganguly & Brotherton 2008; Maddox et al. 2008). BALQSOs may thus provide a unique probe of conditions near the nucleus of most QSOs. In this orientation scenario, we expect that the intrinsic X-ray emission of BALQSOs should be similar to that of normal quasars. BALQSOs were thought to be only radio quiet; however, radio-loud BALQSOs have been discovered with sensitive radio surveys (Becker et al. 1997). The fraction of BALs decreases with increasing radio luminosity (Shankar et al. 2008), partially explaining the initial failures when searching for BALs in radio-loud quasars.
While the above orientation scenario is popular and mostly accepted, it should be noted that according to some theoretical models BALQSOs might be that early phase in quasar evolution when matter around the nuclear black hole (BH) is blown away and a quasar emerges. Mathur (2000a, 2000b) has suggested that the early evolutionary phase is marked by a high accretion rate relative to Eddington ( ). Links between low-ionization BALQSOs and IR-luminous mergers (Canalizo & Stockton 2000) and between BALQSOs and narrow line Seyfert 1 galaxies (Mathur 2000a, 2000b; Brandt & Gallagher 2000) support this scenario. It is intriguing that at least three of the five z ⩾ 5 QSOs found in the Sloan Digital Sky Survey (SDSS) early data release show BALs (Zeng et al. 2000). The discovery of a merging system containing a BALQSO and a submillimeter-selected galaxy containing an obscured starburst also supports the evolutionary scenario. If the BAL phase does represent a high accretion rate period in a quasar lifetime, then an intrinsic X-ray power law steeper than that for non-BAL QSOs could be expected, by analogy to narrow line Seyferts and Galactic BH candidate binary systems in outburst (Pounds et al. 1999). Alternatively, the X-ray luminosity may be relatively smaller due to "trapping radiation" effects in which the X-rays created in the inner region of the accretion flow are dragged back into the BH (Begelman 1978).
Thus, X-ray spectroscopy of BALQSOs is not only important to study the properties and dynamics of absorbing outflow, but also to investigate quasar evolution. X-ray spectroscopy of BALQSOs, however, is notoriously difficult because BALQSOs are faint X-ray sources. ROSAT observations revealed that BALQSOs are soft X-ray quiet as a class and unusually steep optical-to-X-ray slopes (αox ⩾1.94 relative to non-BAL QSOs αox ∼1.6) were measured. Polarization studies also imply high column density absorption along the line of sight (Goodrich 1997). It is now believed that the BAL material has an absorbing column at least an order of magnitude larger than that estimated from UV spectra alone.
ASCA observations (Gallagher et al. 1999) pushed up the column density lower limit by an order of magnitude above the ROSAT value. The absorbing columns in some cases are at least ≈5 × 10²³, within a factor of three of being Compton thick. Deep (100 ks) ASCA observations of an optically bright BALQSO ruled out the possibility of BALQSOs being intrinsically X-ray weak; strong absorption was clearly indicated (Mathur et al. 2000).
The sharp point-spread function and low background of Chandra enabled easy detections of the high-ionization BALQSOs (Green et al. 2001). The low-ionization BALQSOs, however, were found to be significantly more X-ray weak, implying either much larger absorbing column densities or intrinsically different X-ray characteristics. The XMM spectroscopy confirmed that high-ionization BALQSOs are highly absorbed in X-rays, but the nature of their continuum shape remained unresolved (Grupe et al. 2003). No other property of BALQSOs, including radio-loudness and polarization fraction, was found to correlate with X-ray brightness (Gallagher et al. 2006). Almost all X-ray data of BALQSOs are consistent with continuum spectral slopes similar to "normal" quasars, but steeper slopes were not ruled out in most cases. A steep slope is implied in the case of the z = 5.8 BALQSO SDSS1044-0125 (Mathur 2001). All authors, however, agree on one important result: that strong X-ray absorption is a defining characteristic of BALQSOs.
A report that some BALQSOs show no intrinsic absorption therefore came as a surprise. Schaefer & Brotherton (2004) found that Chandra spectra of radio-loud BALQSOs showed no excess absorption above Galactic. Since this result was based on very few counts, it can be explained if (1) the absorber only partially covers the source, with some soft-X-ray photons making their way out of the quasar unabsorbed; (2) in addition to the absorbed power-law spectrum, there is a second soft component, e.g., from an extended region (as in some Seyfert 2 galaxies; Ghosh et al. 2007) or from the radio jet (see also Brotherton et al. 2005); or (3) the absorber could also be ionized (Streblyanska et al. 2010). Alternatively, the spectrum may be truly unabsorbed and if this is indeed the case, it will tell us something new about radio-loud BALQSOs. To resolve this issue, we obtained a high-S/N spectrum of a radio-loud BALQSO FBQS J131213.5+231958 (FBQS1312 + 23 here onward) with XMM-Newton which is presented in this paper. We have used the standard cosmological model throughout the paper with ΩΛ = 0.7, Ωm = 0.3 and H0 = 75 km s−1.
2. DATA
2.1. Observation and Data Analysis
We observed FBQS13121 with XMM-Newton with EPIC-pn as our prime instrument. The observation was broken into six parts between 2006 December and 2007 January; three of them are normal observations which were analyzed independently (Table 1). The other three pointings are "CalClosed" calibration observations. We followed the standard data analysis procedure, as discussed in Mathur et al. (2009) using the XMM-Newton Science Analysis System (SAS version 9.0.0). The good time intervals were created by rejecting background flaring intervals with count rates greater than 0.5 counts s−1 and 0.35 counts s−1 in the 10–12 keV band for the pn and mos chips, respectively. The effective exposure times for each observation and the observed count rates are also listed in Table 1.
Table 1. XMM-Newton Observations of FBQS1312
| Sequence Number | Observation Time | PN | Effective | PN | Effective | MOS1 | Effective | MOS2 |
|---|---|---|---|---|---|---|---|---|
| Exposure | PN | Count | MOS1 | Count | MOS2 | Count | ||
| (ks) | Exposure | Rate | Exposure | Rate | Exposure | Rate | ||
| 040304101 | 2006 Dec 29T11:55:27 | 58.0 | 48.5 | 4.6 ± 0.1 | 59.4 | 1.23 ± 0.05 | 59.3 | 1.19 ± 0.05 |
| 040304201 | 2006 Dec 28T03:00:46 | 10.1 | 0.6 | 4 ± 1 | 5.6 | 1.4 ± 0.2 | 5.7 | 1.1 ± 0.2 |
| 040304501 | 2007 Jan 7T01:43:11 | 12.1 | 4.7 | 3.8 ± 0.4 | 10.5 | 1.0 ± 0.1 | 10.5 | 1.2 ± 0.1 |
Notes. The count rates are calculated in the 0.2–8 keV band, and have units of 10−2 counts s−1. We list the 3σ upper limits count rate for non-detections in observations 301, 401, and 601.
Download table as: ASCIITypeset image
In each observation, the source counts were extracted from a circular region of 70 arcsec diameter. The background counts were extracted from a circular region of 200 arcsec diameter. We extracted source spectra from the three observations and co-added them using FTOOLS.5 We did not find significant (over 1.5σ) variability in flux among the three observations, so co-adding the spectra was justified. The combined spectrum was re-binned to contain at least 20 counts per channel. The spectra were then analyzed using XSPEC. The quoted errors are for 90% confidence for one interesting parameter unless otherwise noted.
2.2. Spectral Modeling
We started fitting the source spectrum with a simple model of absorbed power law where the absorption column was held fixed at the Galactic value of NH(Galactic) = 1.32 × 10²⁰ atoms cm−2. This provided a good fit (χ2ν = 0.49 for 131 degrees of freedom (dof)). The fitted value of the power-law photon index, however, was flat with Γ = 1.43. The fit did not improve (χ2ν = 0.50 for 130 dof) leaving the absorber column density free to vary, and the best-fit column density was found to be slightly in excess of the galactic value (NH = 2 × 10²⁰); the best-fit power-law slope was still flat with Γ = 1.45. This is suggestive of excess absorption at the source, which is entirely expected from a BAL quasar. We added the Galactic absorption in all the subsequent models and held it fixed.
In the next model, we added absorption at the source (z = 1.508). As expected, the fit remained good (χ2ν = 0.51 for 130 dof), the power-law slope remained flat Γ = 1.45, and the column density at the source was found to be small with NH(z) = 2 × 10²⁰. In order to understand whether the source spectrum is intrinsically flat, or appears flat due to complex absorption, we fitted the absorbed power-law model only to data above 1 keV (Figure 1). This corresponds to 2.508 keV in the quasar rest frame, so the spectrum is minimally affected by low-energy absorption. The resulting power-law slope was Γ = 1.6. This suggested that the spectrum is likely to be complex.

Figure 1. XMM-Newton spectrum with an absorbed power-law fit to only the high-energy spectrum (E ⩾1 keV corresponding to 2.5 keV, rest frame). The solid line shows the best-fit model extrapolated to low energies. The deficit of counts at low energies shows that the spectrum is absorbed.
Download figure:
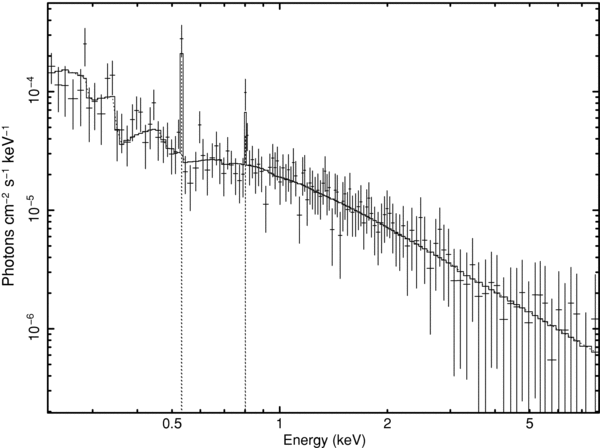
Standard image High-resolution imageWe then fitted the spectrum with an absorbed power law partially covering the source, which naturally resulted in a good fit (χ2ν = 0.47 for 129 dof; Figure 2). The absorption column density at the source was NH(z) = 3.3+4.1−2.6 × 10²² and the covering fraction was Cf = 0.45+0.2−0.38. The power-law slope was Γ = 1.75+0.25−0.35 and the normalization is 2.8 ± 0.8 × 10⁻⁵ photons cm−2 s−1 keV−1. Clearly, the parameters of the partially covering absorber are too ill-constrained to produce a meaningful contour plot of the Cf–NH(z) plane. We note, however, that if the covering fraction is as small as 0.07, NH(z) = 2.5 × 10²² and the power-law slope is flat with Γ = 1.46. The flatness of the continuum suggests that the covering fraction is unlikely to be this small. On the other hand, if Cf is as large as 0.65, the NH(z) = 3.7 × 10²⁰ and Γ = 2.0. The extremely low column density here suggests that the covering fraction is unlikely to be this large. Thus, even though the formal error on the covering fraction is large, Cf is unlikely to be very different from the best-fit value of 0.45 (see Figures 3 and 4).

Figure 2. XMM-Newton spectrum with a partially covered absorber model; the solid line shows the best fit. This is one of our preferred models.
Download figure:
Standard image High-resolution image
Figure 3. Solid line over the spectrum represents the best-fit absorber model, but with a covering fraction of unity. This shows how the spectrum would have looked without partial covering, if there was no jet emission.
Download figure:
Standard image High-resolution image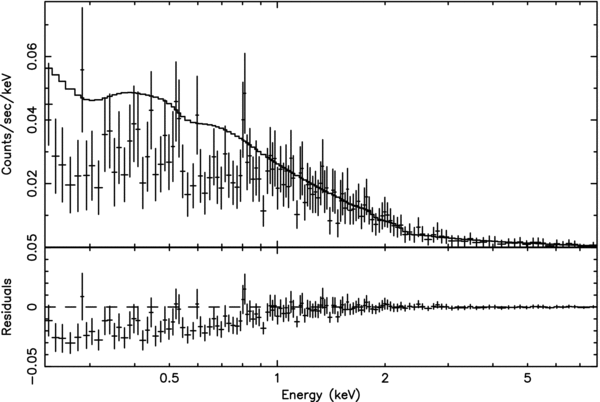
Figure 4. Solid line over the spectrum represents the best-fit absorber model, but with absorber column density set to zero. This shows how the spectrum would have looked if the source was not absorbed.
Download figure:
Standard image High-resolution imageIt is also possible that the intrinsic absorber is ionized, so we fitted the spectrum with an ionized absorber model. This too gave a good fit (χ2ν = 0.48 for 129 dof). The column density of the ionized absorber was NH(z) = 1.9+3.7−0.9 × 10²² and the ionization parameter was ζ = 343+4657−195. The power-law slope was Γ = 1.6+0.2−0.2 and the normalization is 2.3 ± 0.4 × 10⁻⁵ photons cm−2 s−1 keV−1. Again, the value of ξ is found to be highly unconstrained. If we freeze the photon index to the mean value found for radio-loud non-BAL quasars (mean Γ = 1.85 ± 0.03; Young et al. 2009), the resultant NH(z) = 2.3+2.4−1.5 × 10²² and ζ = 159+259−129, which are much better constrained.
The data quality is not good enough to distinguish between a partial covering and an ionized absorber model. As per the F-test, both models present significant (99.8%) improvement over the simple absorber model. Moreover, in these models the underlying power law has a slope consistent with the radio-loud non-BAL quasars. Therefore, these are our preferred models, even though the data quality is not good enough to reject other models. The observed flux is f(0.3–8.0 keV) = 1.3 × 10⁻¹³ erg cm−2 s−1 corresponding to the luminosity of L(0.3–8.0 keV) = 1.0 × 1045 erg s−1. The unabsorbed luminosity is L(0.3–8.0 keV) = 1.3 × 1045 erg s−1.
Figures 1–4 show some line-like features below a keV, particularly at energies about 0.5 keV and 0.8 keV. These features do not look statistically significant; nevertheless, we reanalyzed the spectrum, now including two emission lines at these energies. This clearly improved the fit, going from χ2 = 62.15 for 129 dof to χ2 = 58.91 for 125 dof. However, as expected, the improvement is not significant.
The best-fit values of line equivalent widths are 0.04 keV and 0.01 keV for lines at 0.5 and 0.82 keV, respectively. They are, however, consistent with zero. The energies of the two "lines" are 1.25 keV (9.89 Å) and 2.05 keV (6.039 Å) at the redshift of the source. The first may be identified with transitions of Fe xviii and the second with Al xii. Given the low abundance of Al, it is unlikely that it is one of the two strong lines we see. X-ray emission lines have been detected in obscured AGNs such as Seyfert 2 galaxies. The possible "lines" mentioned above have not been detected in published papers (e.g., in NGC 1068: Kinkhabwala et al. 2002; Brinkman et al. 2002; Mrk 3: Sako et al. 2000)
The detected lines closest in energy are, for line1: Mg xi f at 9.312 A and Ne x Lyβ at 10.24 A. For line 2, it could be Si xiv Lyα at 6.176 Å. So we fixed the line energies to these values and re-did the analysis. The fit was slightly worse with χ2 = 61.55 for 128 dof. The unfolded spectrum with this fit is shown in Figure 5. The observed equivalent width of the Mg xi line is EW = 0.7 ± 0.06 keV and that of the Si xiv line is EW = 0.02+0.04−0.01 keV. The fit is worse for the Ne x line, and its EW is consistent with zero. Thus, if the line features are indeed present they are likely to be Mg xi and Si xiv lines, produced in photoionized plasma around the quasar.
Figure 5. Unfolded spectrum of the source is plotted together with the best-fit ionized absorber model shown by the solid line. Also included are two emission lines at 0.53 keV and 0.08 keV corresponding to Mg ix f and Si xiv Lyα respectively at the quasar rest frame.
Download figure:
Standard image High-resolution image
3. DISCUSSION
3.1. The Observed Spectrum
The observed flux of FBQS 1312 + 23 is consistent with that during the Chandra observation. The apparent lack of absorption is also consistent with the inference from the Chandra hardness ratio. The XMM-Newton data show that the actual spectrum of the source is complex. Our preferred interpretation is that the X-ray continuum is absorbed by a column density NH(z) = few × 1022, but the absorber is either ionized or only partially covers the continuum (Cf ≈ 0.5). This is not surprising: FBQS 1312 + 23 is a radio-loud quasar with a two-sided jet on milliarcsecond scale. X-ray emission from the jet would make the nuclear X-ray continuum extended, and so not fully covered by the absorber.
Without X-ray spectroscopy it is difficult to rule out that radio-loud BALQSOs are intrinsically X-ray weak and are unabsorbed (see, e.g., Miller et al. 2009). While a simple power law provided a good fit to our XMM-Newton spectrum, we reject this model because the best-fit power-law slope is too flat even for a radio-loud quasar, and because a partial covering model provides a significantly better fit. This underscores the importance of spectroscopy over hardness ratio analysis.
The two-point slope between the optical and X-ray band is often parameterized by αox where αox = 0.384 × log(f2 keV/f2500. Using the best-fit spectrum and the corresponding luminosity (Section 2), we find αox = −1.55 for FBQS 1312 + 23. This is similar to αox = −1.64 observed for non-BAL quasars (Steffen et al. 2006). If, on the other hand, we use the fully covered model, which has a flat power-law slope, the resultant αox = −1.34. This is much too X-ray bright, even for a non-BAL quasar, providing additional justification to reject this model. Miller et al. (2009) quote a much lower αox = −1.8; this is in part because they assume a much higher f2500 Å based on the i-band optical magnitude of the source while we determined the flux density from the optical SDSS spectrum. The similarity of αox values between BAL- and non-BAL quasars suggests that there are no significant "radiation trapping" effects.
Miller et al. (2009) have presented X-ray properties of BALQSOs based on Chandra observations (note that this study is based on X-ray detections with counts too few to perform spectroscopy). They find that radio-loud BALQSOs are X-ray weak relative to their non-BAL counterparts. This implies that even radio-loud BALQSOs exhibit some soft-X-ray absorption as do radio-quiet BALQSOs. Miller et al. also note that while some radio-loud BALQSOs have harder X-ray spectra than typical radio-loud quasars, some do not. Our XMM-Newton observations of FBQS 1312 + 23 are consistent with these results. We show explicitly that at least this one radio-loud BALQSO is absorbed in X-rays, and its apparent soft spectrum is due to partial covering. Based on the observed spectrum, we conclude that the jet luminosity is about half of the total luminosity if the nuclear point source, presumably associated with a accretion disk corona, is fully covered and the jet is completely uncovered.
3.2. X-ray–UV Connection
X-ray warm absorbers, present in about 50% nearby Seyfert galaxies, are known to produce UV signatures of associated absorption lines such as Lyα, C iv, N v (Mathur et al. 1995, 1998). It was later found that the warm absorbers have multiple components and the component with low ionization parameter produces UV lines (e.g., Krongold et al. 2003). The situation in BALQSOs, however, was found to be different. The BALQSO X-ray absorbers are cold, with high column density (Section 1). These absorbers are believed to provide shielding to the UV absorbing gas, as suggested by models (e.g., Murray et al. 1995).
In FBQS 1312 + 23 the absorber may be cold (in the partial covering model), but it could also be warm (the ionized absorber model). In the latter case, it will produce UV absorption lines. The predicted column densities for the common UV lines from our best-fit ionized absorber model are log NH i = 15.91, log NC iv = 14.14, log NN v = 15.0 (calculated using CLOUDY, Ferland 1997). We did not find published UV line column densities in literature, making a direct comparison difficult. The Mg ii column density for the model is negligible, so we predict that Mg ii BAL should not be present in FBQS 1312 + 23, unless there is a separate lower ionization component without any X-ray signature. Indeed, the optical spectrum published by Becker et al. (2000) shows no Mg ii absorption lines, either broad or narrow.
3.3. BH Mass and Eddington Luminosity Ratio
FBQS 1312 + 23 has been observed by SDSS. Using the width of the Mg ii emission line in this optical spectrum, together with standard scaling relations, the BH mass in this quasar is estimated to be 1.9+4.7−1.4 × 10⁹ M☉ (M. Dietrich 2010, private communication). The quoted error is from the measurement error, contributed mostly by the FWHM of the emission line. Additionally, there is about a factor of three systematic uncertainty in BH mass determination, due to the unknown geometry of the broad emission line region. Because of these large uncertainties in the BH mass, we make the following estimates for a fiducial mass of 109 M☉. The Eddington luminosity for a 109 solar mass BH is 1.26 × 1047 erg s−1. From our observations, the X-ray luminosity of the source is L(0.3–8 keV, rest frame) = 1.3 × 1045 erg s−1. The unabsorbed 2–10 keV luminosity is L(2–10 keV, rest frame) = 1.0 × 1045 erg s−1. Vasudevan & Fabian estimate the bolometric correction to the 2–10 keV luminosity to be about 70 for the observed luminosity. This is similar to the bolometric correction of 73.64 obtained using the relation given in Young et al. (2010) for αox = −1.55. Using the dispersion around the Young et al. relation, the bolometric correction can be as high as 100. The bolometric luminosity of our source is then 7–10 × 1046 erg s−1 and the Eddington luminosity ratio is 0.56–0.79. The bolometric luminosity based on the optical (SDSS) spectrum and using the correction factor from Richards et al. (2006) is about 1047 erg s−1, resulting in an Eddington luminosity ratio of 0.79; this is the same as the larger of the values based on X-ray luminosity (as noted above, the i-band-based optical luminosity is even larger). These parameters of FBQS 1312 + 23, viz. the BH mass and the Eddington luminosity ratio, are within the distributions found for radio-loud quasars at z = 1.5 (Shankar et al. 2010). However, the Eddington luminosity ratio of the source is significantly higher than the mean log λ = −0.4 (or λ ≈ 0.4) for the corresponding BH mass, or the mean log λ = −0.9 (or λ ≈ 0.125) for the corresponding redshift (Shankar et al. 2010, their Figure 4). Given the uncertainties in BH mass estimates (especially with Mg ii lines; Dietrich et al. 2009), we should interpret this result with caution, but note that it is highly likely that this BALQSO has a high Eddington luminosity ratio.
The similarity of power-law slopes between BAL and non-BAL quasars has been interpreted until now as the complete intrinsic similarity between the two classes, with the viewing angle to be the only difference between the two. Here we show explicitly that even though the power-law slope of FBQS 1312 + 23 is similar to that of non-BAL quasars, it is perhaps accreting at a higher rate, closer to the Eddington limit. In low-mass BHs, such as in narrow-line Seyfert 1 galaxies, the observed steep spectra correspond to high Eddington luminosity ratios. It appears, however, that this is not necessarily the case for high-mass BHs. This is in line with the observed anti-correlation between Γ and BH mass and Γ and X-ray luminosity (Piconcelli et al. 2005; Kelly et al. 2008; Dai et al. 2004; Saez et al. 2008). This is also consistent with some accretion disk-corona models (e.g., Kuraszkiewicz et al. 2000) in which the steepening of the X-ray spectrum with the Eddington accretion rate is more pronounced for low-mass BHs and for softer X-rays. The observation of FBQS 1312 + 23, in which high Eddington accretion is indicated without a steep spectrum, provides important constraints to accretion disk models. It also reinforces the evolutionary scenario of BAL quasars.
We thank Matthias Dietrich for analyzing the optical data and providing us with the BH mass of the source. We also thank Sibasish Laha for providing the UV column densities. We gratefully acknowledge support through NASA grant NNX07AF05G to S.M.
Facility: XMM - Newton X-Ray Multimirror Mission satellite
Footnotes
- 4
αox is the slope of a hypothetical power law connecting 2500 Å and 2 keV.
- 5