


ABSTRACT
We present the orbital-phase-resolved analysis of an archival FO Aqr observation obtained using the X-ray Multi-Mirror Mission, European Photon Imaging Camera (pn instrument). We investigate the variation of the spin pulse amplitudes over the orbital period in order to account for the effects of orbital motion on spin modulation. The semi-amplitude variations are in phase with the orbital modulation, changing from (38.0 ± 1.8)% at the orbital maximum to (13.3 ± 3.7)% at the orbital minimum. The spectral parameters also show changes over the orbital period. One of the absorption components increase by a factor of five between the orbital minimum and maximum. We interpret that this absorption arises from the bulge where accretion stream from the secondary impacts the disk. The spectrum extracted from the orbital minima and maxima can be fitted with a warm absorber model yielding values NH = 2.09+0.98−1.09 × 10²² and 0.56+0.26−0.15 × 1022 cm−2; and log(ξ) = 0.23+0.37−0.26 and <0.30 erg cm s−1, respectively, indicating the existence of ionized absorption from the bulge at the impact zone which is spread out on the disk. The absorption due to accretion curtain and/or column which causes the spin modulation can be distinguished from the disk absorption via spectral modeling.
Export citation and abstract BibTeX RIS
1. INTRODUCTION
FO Aqr is a compact binary belonging to the sub-category of intermediate polars (IPs) of the cataclysmic variables (CVs) which are composed of a white dwarf accreting material from a Roche lobe filling main-sequence star. IPs have white dwarfs with a magnetic field of mostly 1–10 MG (although there are a couple of systems with magnetic field strengths up to 30 MG; e.g., Katajainen et al. 2010; Piirola et al. 2008). The accretion occurs through a truncated disk and via accretion curtains to the magnetic poles of the white dwarf (see Patterson 1994; Warner 2003).
FO Aqr is a well-studied IP, with an orbital period of 4.85 hr (Osborne & Mukai 1989) and white dwarf spin period of 20.9 minutes (Patterson et al. 1998). It has been observed with almost every X-ray mission: EXOSAT, Ginga, ASCA, RXTE, XMM-Newton, INTEGRAL, Swift, and Suzaku (Cook et al. 1984; Norton et al. 1992; Mukai et al. 1994; Evans et al. 2004; Parker et al. 2005; Landi et al. 2009; Yuasa et al. 2010, respectively). Our understanding of the accretion scenario in FO Aqr has changed over the years: Norton et al. (1992) suggested that the system shows diskless accretion and that the accretion flow changes poles. However, Hellier (1993) argued that there is an accretion disk in the system and the accretion takes place both via a disk and stream overflowing the disk. Mukai et al. (1994) confirmed this hybrid accretion mode, but proposed that accretion from a partial disk is dominant. Later, it was suggested that the accretion mode alternates from a hybrid of disk-fed and stream-fed accretion to disk-fed accretion over the years (i.e., hybrid in 1988, disk-fed in 1990, Norton et al. 1996; hybrid in 1993 and 1998, Beardmore et al. 1998; disk-fed in 2001, Evans et al. 2004). The changes in accretion modes are most likely due to changes in the mass accretion rate of the system (de Martino et al. 1999). The source shows orbital modulations, which are deeper at the lower energy regime, indicating that it could be due to absorption from structures on the disk and the accretion stream (Hellier et al. 1993; Evans et al. 2004; Parker et al. 2005). The spin pulse shape of the system is complicated, with a quasi-sinusoidal component and a notch after a "dip" caused by the accretion curtains (Evans et al. 2004). The spin pulse profile may vary between nearly sinusoidal to sawtooth shapes in different observations (Beardmore et al. 1998).
The X-ray spectrum of the source can be represented with a multiple plasma emission component, complex absorption, and Gaussian lines (e.g., Mukai et al. 1994; Evans et al. 2004; Yuasa et al. 2010). A soft blackbody emission was not detected by Evans & Hellier (2007) with X-ray Multi-Mirror Mission (XMM-Newton) data or by Yuasa et al. (2010) with Suzaku data. However, using the results of a combined joint analysis of INTEGRAL/IBIS and Swift/XRT data, Landi et al. (2009) claimed the detection of a blackbody component with a temperature of 61 eV which they attributed to the irradiation of the white dwarf atmosphere.
In this work, the spectral and temporal properties of FO Aqr over the orbital phase will be investigated. In Section 2, observation and data preparation will be introduced. In Section 3, the spin pulse profile behavior over the orbital phase will be outlined. In Section 4, the phase average spectrum and the variation of spectral parameters over the orbital phase will be investigated. In Section 5, the results of the analyses will be discussed.
2. OBSERVATION AND DATA ANALYSIS
FO Aqr was observed for about 35 ks (exposure time) on 2001 May 12 (OBS ID: 0009650201) with the XMM-Newton Observatory (Jansen et al. 2001) with all of its instruments on board: a pn CCD detector (Strüder et al. 2001), two MOS CCD detectors (Turner et al. 2001) sensitive in the 0.2–15 keV energy range at the focus of three European Photon Imaging Cameras (EPIC), Reflecting Grating Spectrometers (den Herder et al. 2001), a high-resolution spectrometer working together with the EPIC detectors, and the optical monitor instrument with an optical/UV camera (Mason et al. 2001).
Due to the higher sensitivity compared with the MOS, we used the archival EPIC pn data in the analysis, obtained using the small window mode, with a net count rate of 2.33 ± 0.01 counts s−1 in the 0.3–10.0 keV interval. Standard data preparation and processing was carried out with the raw data using the XMM-Newton Science Analysis Software (sas), version 11.0.0. The extraction of the background subtracted source spectrum was carried out using especget and the extraction of the source and background light curve was carried out with evselect which are tools within sas. Data with single- and double-pixel events, i.e., patterns 0–4 with Flag = 0 options, were extracted at all times. A circular extraction region with a radius of 32.4 arcsec was used for the source and background photons. To extract the light curve and spectra resolved at the orbital phase, we used the phasecalc tool to create a phase column in the events file with observation start time being the 0 phase. Next, phase-resolved spectra were extracted from the modified events file using a script. Further analyses of light curve and spectra were performed with xronos 5.2 and xspec 12.6.0 packages. We obtained the background subtracted source light curve using lcmath tool in ftools v6.10 and applied barycentric correction. Our preliminary analysis of FO Aqr is summarized in Balman & Pekön (2011). The original analysis of the archival XMM-Newton data of FO Aqr can be found in Evans et al. (2004).
3. SPIN MODULATION VARIATIONS OVER THE ORBIT
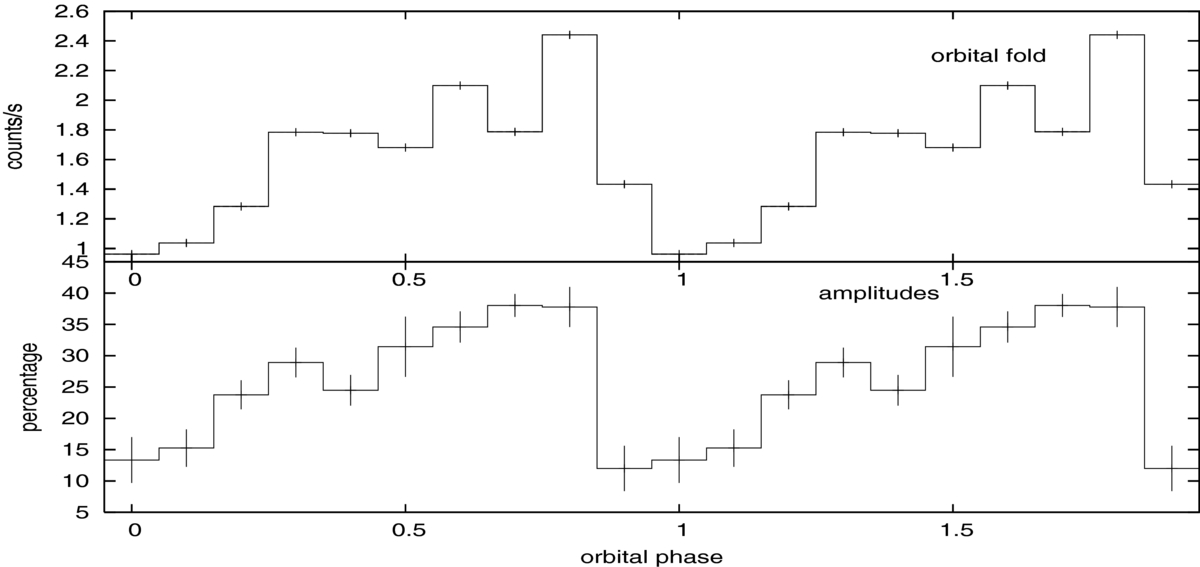
We folded the corrected light curve over the orbital (17,458 s) and spin (1254 s) periods (Patterson et al. 1998) using the same epoch given by Evans et al. (2004); T0 = 2452041.806 (HJD) for the orbital period and T0 = 2452041.858 (HJD) for the spin period. Figure 1 shows the folded light curve over the orbital period and the spin period separately (see also Evans et al. 2004).

Figure 1. Light curve folded over the orbital period of 17,458 s on top, and the light curve folded over the spin period of 1254 s at the bottom.
Download figure:
Standard image High-resolution imageIn order to investigate the changes in the spin pulse over the orbital phase, we extracted light curves for each 0.1 orbital-phase interval in the 0.3–10.0 keV range and then folded these over the spin period. One orbital-phase bin is 1745.8 s, which is greater than the spin period. In general, the pulse shapes look similar with spin minima at around phase 0.8. However, we find that the amplitude of the spin pulses change with orbital phase (see Figure 2). To construct Figure 2, we fitted spin pulse with a simple sine curve for each orbital phase. Then we calculated the percentage variations by taking the ratio of the semi-amplitude of each fit to the mean value and plotted the percentage variations versus orbital phase. We also compared them with the orbital folded light curve. As seen in Figure 3, the percentage variation is clearly in-phase with the orbital motion. The variations change from (38.0 ± 1.8)% at the orbital maximum to (13.3 ± 3.7)% at the orbital minimum.

Figure 2. Spin pulse profile of FO Aqr for each 0.1 orbital-phase interval. The corresponding phases are noted on each panel.
Download figure:
Standard image High-resolution image
Figure 3. Percentage variation of the spin pulse amplitudes from the mean (below), together with the orbital flux variation (above).
Download figure:
Standard image High-resolution image4. SPECTRAL VARIATIONS OVER THE ORBIT
We used the same composite spectral model from Evans et al. (2004) in order to fit the phase average spectrum of the source. The composite model consists of a simple absorption model (wabs), two partial covering absorption models (pcfabs), three plasma emission models at different temperatures (mekal), and a Gaussian emission line at 6.4 keV (Fe Kα).
In order to investigate the changes of this composite model spectrum over the orbital phase, we performed orbital-phase-resolved spectroscopy. We extracted spectra for each 0.1 orbital-phase interval, and fitted them with the composite model described above. Table 1 displays the spectral parameters over the orbital phases. Figure 4 shows the 10 phase-resolved spectra extracted from the data. The fits to the spectra clearly reveals that the neutral hydrogen column density of the second partial covering absorber pcfabs2 increases up to five times during the orbital dipping phases (see Figure 5 and Table 1), while the other partial covering absorber (pcfabs1) shows no particular variation (see Table 1). The first two plasma temperatures (kT1 and kT2) show no significant variation over the orbital phase; however, the third temperature (kT3) peaks during the orbital minima, indicating spectral hardening (see Figure 5 and Table 1).
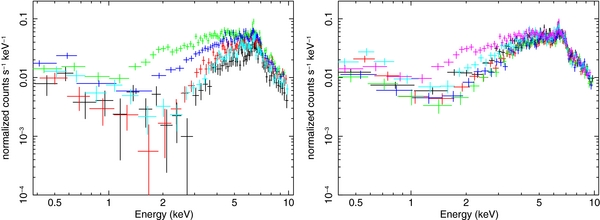
Figure 4. Orbital-phase-resolved spectra of FO Aqr for each 0.1 phase bin interval. The left-hand panel shows phases 0.8 (green), 0.9 (dark blue), 0.0 (red), 0.1 (black), and 0.2 (light blue). The right-hand panel shows the phases 0.8 (purple pink) and the rest of the phases 0.3–0.7. Note the spectral differences on the left-hand side during orbital minima and how the spectra are different for the rest of the phases.
Download figure:
Standard image High-resolution image
Figure 5. Variation of the NH parameter of the partial covering absorber pcfabs2 on top and the variation of the temperature parameter of the hardest emission component mekal3 at the bottom. Both variations are over the orbital phase.
Download figure:
Standard image High-resolution imageTable 1. Spectral Parameters Derived from the Fits to the Spectra for Each Orbital Phase of 0.1 in the 0.3–10 keV Range
| Model | Component | 0.1 | 0.2 | 0.3 | 0.4 | 0.5 |
|---|---|---|---|---|---|---|
| wabs | NH (× 1022 cm−2) | 0.152+0.041−0.029 | 0.093+0.048−0.034 | 0.077+0.027−0.035 | 0.067+0.034−0.027 | 0.188+0.024−0.020 |
| pcfabs1 | NH (× 1022 cm−2) | 20.0+2.6−2.0 | 21.2+1.4−1.3 | 18.4+1.1−1.0 | 24.6+1.2−1.1 | 23.8+1.7−1.5 |
| CoverFrac | 0.689+0.041−0.041 | 0.820+0.020−0.020 | 0.820+0.015−0.015 | 0.836+0.011−0.011 | 0.651+0.015−0.015 | |
| pcfabs2 | NH (× 1022 cm−2) | 17.45+1.20−1.11 | 9.79+0.68−0.63 | 7.12+0.44−0.40 | 6.37+0.37−0.34 | 7.06+0.29−0.27 |
| CoverFrac | 0.980+0.004−0.005 | 0.984+0.004−0.007 | 0.980+0.003−0.005 | 0.980+0.003−0.004 | 0.980+0.002−0.002 | |
| MEKAL1 | kT | 0.103+0.009−0.011 | 0.117+0.013−0.015 | 0.159+0.025−0.027 | 0.165+0.029−0.030 | 0.125+0.010−0.010 |
| Norm (× 10−3) | 5.36+2.07−2.07 | 8.05+3.23−3.23 | 3.95+1.43−1.43 | 3.61+1.36−1.36 | 7.12+1.70−1.70 | |
| MEKAL2 | kT | 2.17+0.57−0.50 | 6.87+5.00−4.17 | 2.25+0.57−0.51 | 2.71+0.71−0.57 | 8.19+3.51−3.00 |
| Norm (× 10−5) | 1.90+0.96−0.96 | 1.72+0.84−0.84 | 2.63+1.25−1.25 | 3.01+1.01−1.01 | 2.49+0.86−0.86 | |
| MEKAL3 | kT | 69.1+15.0−15.0 | 44.7+18.4−17.6 | 27.2+10.2−7.0 | 21.3+6.9−3.6 | 37.6+9.9−8.4 |
| Norm (× 10−3) | 3.57+0.15−0.15 | 5.62+0.17−0.17 | 5.70+0.15−0.15 | 6.85+0.17−0.17 | 6.61+0.14−0.14 | |
| Gaussian | Line center (keV) | 6.39+0.03−0.03 | 6.38+0.04−0.03 | 6.41+0.03−0.03 | 6.37+0.05−0.04 | 6.39+0.02−0.03 |
| σ | 0.070+0.069−0.070 | 0.052+0.073−0.052 | 0.040+0.057−0.040 | 0.060+0.098−0.060 | 0.001+0.067−0.001 | |
| Norm (× 10−5) | 1.15+0.33−0.33 | 0.92+0.33−0.33 | 0.96+0.30−0.30 | 0.88+0.35−0.35 | 1.24+0.31−0.31 | |
| χ2ν (dof) | 0.90 (69) | 0.80 (83) | 0.82 (76) | 1.08 (75) | 1.25 (75) | |
| Model | Component | 0.6 | 0.7 | 0.8 | 0.9 | 1.0 |
| wabs | NH (× 1022 cm−2) | 0.025+0.019−0.015 | 0.021+0.019−0.016 | 0.145+0.024−0.020 | 0.052+0.014−0.012 | 0.079+0.030−0.023 |
| pcfabs1 | NH (× 1022 cm−2) | 19.7+1.1−1.1 | 21.7+1.3−1.2 | 16.5+1.1−1.0 | 26.5+1.3−1.3 | 26.2+1.6−1.5 |
| CoverFrac | 0.793+0.013−0.013 | 0.731+0.013−0.013 | 0.697+0.013−0.013 | 0.776+0.010−0.010 | 0.828+0.016−0.016 | |
| pcfabs2 | NH (× 1022 cm−2) | 6.32+0.36−0.33 | 5.78+0.28−0.26 | 3.75+0.16−0.15 | 6.37+0.27−0.25 | 11.26+0.79−0.74 |
| CoverFrac | 0.980+0.003−0.002 | 0.980+0.003−0.002 | 0.980+0.003−0.003 | 0.980+0.001−0.002 | 0.980+0.003−0.004 | |
| MEKAL1 | kT | 0.180+0.022−0.022 | 0.199+0.024−0.023 | 0.147+0.013−0.013 | 0.128+0.009−0.009 | 0.160+0.023−0.023 |
| Norm (× 10−3) | 3.65+0.75−0.75 | 3.68+0.78−0.78 | 33.06+7.90−7.90 | 5.72+1.00−1.00 | 3.17+0.98−0.98 | |
| MEKAL2 | kT | 3.01+0.67−0.48 | 2.73+0.90−0.67 | 1.71+0.37−0.27 | 6.35+4.46−3.34 | 1.18+0.34−0.19 |
| Norm (× 10−5) | 3.05+0.78−0.78 | 2.80+1.15−1.15 | 4.00+1.07−1.07 | 2.25+1.02−1.02 | 2.06+1.16−1.16 | |
| MEKAL3 | kT | 40.8+12.5−9.6 | 28.6+10.2−6.8 | 30.6+8.0−6.6 | 14.8+1.9−1.2 | 32.6+17.8−10.5 |
| Norm (× 10−3) | 5.59+0.14−0.14 | 6.48+0.15−0.15 | 5.42+0.12−0.12 | 7.30+0.16−0.16 | 5.55+0.18−0.18 | |
| Gaussian | Line center (keV) | 6.31+0.05−0.06 | 6.36+0.03−0.03 | 6.36+0.04−0.04 | 6.36+0.03−0.04 | 6.42+0.03−0.03 |
| σ | 0.086+0.069−0.061 | 0.075+0.047−0.042 | 0.114+0.053−0.038 | 0.053+0.054−0.053 | 0.036+0.041−0.036 | |
| Norm (× 10−5) | 1.09+0.34−0.34 | 1.79+0.37−0.37 | 1.76+0.37−0.37 | 1.08+0.33−0.33 | 1.07+0.32−0.32 | |
| χ2ν (dof) | 0.83 (73) | 1.07 (80) | 0.73 (83) | 0.74 (66) | 0.82 (72) | |
Notes. All the spectra are fitted with a composite model of three collisional equilibrium plasma emission models at different temperatures (mekal), one Gaussian centered at 6.4 keV, two partial covering absorber model for intrinsic absorption (pcfabs), and a simple absorber for the interstellar absorption (wabs). The given errors correspond to 90% confidence level for a single parameter.
Download table as: ASCIITypeset image
The shape of the spectrum shows distinct variations over the orbital phase as well. During the phases where X-ray flux is minimum (i.e., phases around 0–0.1) there is a substantial decrease in normalized count rates around the 1–2 keV regime (see Figure 4), while below 1 keV the normalized count rates stay at the same level with that of the rest of the phases. This soft excess brought our attention to a possible warm absorber in the line of sight. In order to investigate this feature we have extracted two spectra from orbital maximum and minimum regions (phases between 0.55–0.85 and 0.9–1.2, respectively), and fitted them with the composite model similar to the one in Table 1, this time replacing the second partial covering absorber and one of the plasma emission components with a warm absorber model (i.e., warmabs model implemented into xspec). warmabs models the absorption from a photoionized plasma in the line of sight with column densities of ions (including small cross sections) coupled through a photoionization model using stored level populations calculated by XSTAR (Kallman & Bautista 2001) assuming a given continuum spectrum. The fit to the orbital minima and maxima yielded results with χ2ν of 1.39 and 1.24; with values of NH = 2.09+0.98−1.09 1022 cm−2 and 0.56+0.26−0.15 × 1022 cm−2; and log(ξ) = 0.23+0.37−0.26 and <0.30 erg cm s−1, respectively. Here NH is the equivalent hydrogen column density of ionized absorption and ξ = L/ner2 is the ionization parameter where L is the luminosity of the ionizing source, ne is the electron density of the plasma, and r is the distance between the absorber and the ionizing source. The fitted spectra of the orbital minima and maxima are presented in Figure 6, while the fitted parameters are given in Table 2.

Figure 6. Composite spectral fit including a warm absorber fitted to the spectrum at orbital minima of the source (phases between 0.9 and 1.2) is shown on the left. On the right, a plot of the composite model alone without the data is presented.
Download figure:
Standard image High-resolution imageTable 2. Spectral Parameters Derived from the Fits to the Orbital Maxima and Minima
| Model | Component | Maxima | Minima |
|---|---|---|---|
| warmabs | NH (× 1022 cm−2) | 0.56+0.26−0.15 | 2.09+0.98−1.09 |
| log(ξ) | <0.30 | 0.23+0.37−0.26 | |
| vturb (km s−1) | 295+295−295 | 193+108−193 | |
| wabs | NH (× 1022 cm−2) | 0.25+0.12−0.08 | 0.25+0.26−0.24 |
| pcfabs | NH (× 1022 cm−2) | 10.9+1.2−1.0 | 20.7+1.9−1.8 |
| CoverFrac | 0.88+0.02−0.02 | 0.98+0.01−0.01 | |
| MEKAL1 | kT | 0.081+0.038−0.081 | 0.19+0.11−0.08 |
| Norm | 0.058+0.121−0.051 | 0.18+4.54−0.13 | |
| MEKAL2 | kT | 61.1< | 49.5< |
| Norm | 0.014+0.001−0.001 | 0.012+0.01−0.01 | |
| Gaussian | σ | 0.23+0.06−0.05 | 0.16+0.12−0.06 |
| Norm (× 10−5) | 8.4+1.7−1.6 | 5.0+2.0−1.8 | |
| χ2ν (dof) | 1.24 (216) | 1.39 (126) |
Notes. The model used is warmabs*wabs*pcfabs*(mekal+mekal+gauss). The Gaussian emission line energy is fixed at 6.4 keV. NH of the warmabs model is the equivalent hydrogen column density of ionized warm absorption. All the errors are given in 99% confidence level.
Download table as: ASCIITypeset image
5. DISCUSSION
The orbital modulation in CVs provides essential information on the structure of the accretion disk in non-magnetic systems and IPs. The orbital-phase-resolved analysis requires demanding conditions in the X-ray regime such as adequate count rates, sufficient observation times, and suitable orbital/spin periods. Previous works on orbital-phase-resolved analysis (e.g., Pekön & Balman 2011; Hellier et al. 1996; Itoh et al. 2006; Salinas & Schlegel 2004; Staude et al. 2008) showed that the spectral characteristics such as absorption column densities, plasma temperature distributions, and line widths from IPs can be studied in detail over the orbital phase which contributes to the understanding of the detailed structure of the accretion phenomenon of these systems. In this work, we tried to incorporate the orbital-phase-resolved spectroscopy in order to calculate the absorption explicitly from the disk and the accretion curtains/columns, separately. The short Pspin of the system is an advantage since the spectral contributions from the spin modulation can average out in a single orbital-phase bin.
It was pointed out by Evans et al. (2004) that the orbital modulation of FO Aqr may be a result of the absorption from vertical structures on the disk extending out to 140° on the plane of the accretion disk and 25° above the accretion plane (however, it was not explicitly calculated). Moreover, Parker et al. (2005) showed that the modulation depth increases at lower energies which supports the absorption effects from the disk. The folded light curve over the orbital period shows three features: a plateau feature with almost constant/slightly increasing flux between phases 0.3–0.6, a peak at phases 0.6–0.8, and a quick decline and deep feature at the rest of the phases where flux minimizes around phase 0–0.1. In our orbital-phase-resolved analysis, absorption column of the second partial absorber (pcfabs2) follows this trend inversely, where it peaks during the orbital dipping phases and is lower during the orbital peak as shown in Figure 5. The absorption column densities of the maximum and minimum phases are NH values of 17.45 × 1022 cm−2 at the maximum reaching up to five times the minimum value of 3.75 × 1022 cm−2. The covering fraction of this absorber shows no significant modulation over the orbital phase and is close to 1. Hence, the absorber is almost uniformly obscuring the X-rays in the line of sight. The absorbing material is well spread out on the disk since the absorbing column never vanishes over the orbital period, but is denser and colder at dipping phases causing more absorption (see Figure 7).

Figure 7. Schematic diagram showing the system. The absorber (represented as the dark region on the disc) is concentrated around the accretion impact zone (phase 0) and smeared out gradually around the accretion disk.
Download figure:
Standard image High-resolution image
Osborne & Mukai (1989) suggest that the optical eclipse occurs at the inferior conjunction of the secondary star. Preceding the optical eclipse on the binary plane by 0.2 orbital phase is a reprocessing site noted by these authors, which is most likely the accretion stream–accretion disk interaction zone. When we phase lock the X-ray light curve to the optical light curve using the ephemerides given by Osborne & Mukai (1989), HJD 2446081.3037+0.20205956E for the optical eclipse, we find that the X-ray orbital minimum is at phase 0.8. Our phase 1.0 or 0.0 is phase locked to the UV minimum given by Evans et al. (2004). This is the same phase 0.8 in the optical band.
The absorption column for the simple photoelectric absorber component (wabs), NH, has values around 0.1 × 1022 cm−2 and the first partial covering absorber component has an NH value around 20 × 1022 cm−2 and the covering fraction is around 0.6–0.8. Considering the variation of these three absorption components over the orbital phase (see Table 1), it can be inferred that each has different origins. The simple absorber with relatively lower column density than the others (i.e., wabs) account for the interstellar absorption. The first partial covering absorber (pcfabs1) with changing covering fraction and relatively high absorbing column accounts for the absorption arising from the accretion curtain/column since it does not vary with the orbital phase. And finally, the second partial covering absorber (pcfabs2) accounts for the absorption from the bulk material on the disk (edge) since it changes with the orbital motion as explained above. At any orbital phase in our analysis, we can see the combined effects of these three absorption components. The interstellar component is in effect at all phase intervals since it is always in the line of sight; and the absorption from the accretion curtain/column is averaged out in each orbital-phase bin since a phase bin of 0.1 spans an interval of 1745.8 s which is greater than the spin period of the white dwarf.
The behavior of the spin pulse profile over the orbital period of the system also supports this scenario of the absorption components. The spin pulse shape have a sinusoidal nature that is constant throughout the orbital motion. The amplitude of the spin pulse vary in line with the orbital folded light curve. Therefore, the variations over the spin and orbital periods have different origins, the former by absorption from the accretion curtains/columns and the latter by absorption from the material on the disk near the accretion stream impact zone.
The average spectrum of the source can be represented with three plasma emission components: a soft component around 0.15 keV, a medium component around 3 keV, and a hard component around 30 keV. The hard component temperatures obtained from the orbital-phase-resolved spectroscopy ranges between 15 and 70 keV. The phase-averaged XMM-Newton data yield 13.9+6.5−3.1 keV (Evans et al. 2004), Suzaku data yield 14+4.0−1.4 keV (Yuasa et al. 2010), and Swift-XRT and INTEGRAL-IBIS data yield 29.7+70.1−16.6 keV (Landi et al. 2009), which are all consistent with this range. The first two softer plasma temperatures do not follow a significant variation over the orbital phase. However, during the orbital maximum at around phase 0.8, the flux of the soft component peaks at about 10 times more than the average. On the other hand, the temperature of the hard component peaks during the orbital dipping phases. These characteristics indicate a signature of spectral softening during the orbital maximum and hardening during the orbital minimum.
Hellier et al. (1993) and Parker et al. (2005) argued that the orbital modulation in IPs may be similar to those of low-mass X-ray binaries (LMXBs) where non-symmetric structures on the accretion disk raised by the impact stream (possibly around the hot spot) causing energy-dependent absorption hence reducing the X-ray flux. In particular, a class of LMXBs called low-mass X-ray binary dippers show considerable fluctuations and modulation around the orbital minimum. Such characteristics have been explained by modeling the dip and non-dip spectra using highly ionized warm absorber models (Boirin et al. 2005; Díaz Trigo et al. 2006; Balman 2009, and the references therein). We tried to explore the warm absorber scenario for FO Aqr, extracting spectra from phases around the orbital minima and maxima and fitting them with the assumed composite spectral model including a warm absorber. We simply replaced the absorption component due to the disk (pcfabs2) and one of the mekal components with warmabs model. Both minima and the maxima could successfully be modeled with an ionized absorber. The ionized absorption Nwarmabs value increases four times during the orbital minima which is expected since the absorber is denser and colder at the orbital "dip." The values for the ionization parameter log(ξ) is consistent within error margins between the minima and the maxima. This may be due to the fact that we used a range of 0.3 phases for the minimum and maximum calculations. The Nwarmabs values we find are lower than those found in LMXBs by about 10 times at all times (min or max) (see Díaz Trigo et al. 2006). Since ξ is given by L/(ner2), ξ values can be compared using ξ = L/NHRd, where ne ∼NH/Rd (Rd, disk radius and NH, equivalent hydrogen column density of ionized absorption). The 0.6–10 keV luminosities of LMXB dippers listed by Díaz Trigo et al. (2006) are of the order of 1036 erg s−1. The X-ray flux of FO Aqr in 0.6–10 keV range is 1.4 × 10⁻¹⁰ erg cm−2 s−1, yielding a luminosity of the order of 1032 erg s−1 at 400 pc source distance. Therefore, one can approximate log(ξCV) ∼ −3 log(ξLMXB) (given the warmabs absorption column is a factor of 10 more in LMXB dippers). We also assumed similar Porb and Rd, disk radius. This yields a range of log(ξCV) ∼ −0.8–1. Therefore, the orbital dip in the X-ray light curve of FO Aqr is analogous to the dips observed in the dipping LMXBs with the expected cause of the dips being variation of temperature and density of the warm ionized material on the disk. A schematic representation of the system is shown in Figure 7.
6. CONCLUSIONS
We have presented X-ray orbital-phase-resolved analysis of the IP FO Aqr. This work improves upon the previous works by calculating the spectral parameters over the orbital phase. The distinction between the absorbing components are clarified and the values are explicitly calculated. The absorption originating from the polar regions of the white dwarf can be resolved from the absorption by structures on the accretion disk. The shape of the spin pulse profile is unaffected by the orbital motion, however the semi-amplitude of the profile changes over the orbital phase. The X-ray orbital variation over the orbit in the system arises from absorption by the bulge material on the disk spread well over the disk. The absorption column is greatly enhanced during the X-ray orbital dip. Moreover, we have modeled the absorption from the orbital dip with a warm absorber model for the first time for this source and also for CVs, confirming the ionized nature of the material on the disk causing the absorption. We derived a range of ionization parameter log(ξCV) ∼ −0.8–1 for plausible warm absorbers on CV disks. We calculate that the orbital modulations in FO Aqr (and plausibly some other CVs) are similar to those seen in LMXB dippers as variations (density/temperature) of a warm absorber at the accretion impact region and spreading on the disk.
The authors thank D. de Martino and K. Mukai for valuable discussions. The authors acknowledge support from TÜBİTAK, The Scientific and Technological Research Council of Turkey, through project 108T735.