
ABSTRACT
The 1.2 m telescope and coudé spectrograph at our Elginfield Observatory was used to investigate the suitability of daytime skylight as a reference spectrum for astrophysical work. We show that with sufficient care, skylight does give the flux (or disk‐integrated) spectrum of the Sun, allowing direct comparison with other stars. The line profiles in skylight become shallower with increasing angular separation from the Sun up to ≈100°, and then for larger angles they deepen slightly again. The amplitude of this variation is typically 3%–4% of the depth of the line. If the profiles are normalized to their central depths, their shapes remain unaltered. This implies that astrophysical analyses based on the shapes of spectral lines or ratios of depths of spectral lines in skylight should not be seriously affected. However, equivalent widths are not conserved; they can be reduced by up to the same 3%–4% unless care is taken to observe the sky close to the Sun or unless the angular variation is measured, as described here, and corrections applied. The skylight variations can be explained as a combination of aerosol and Rayleigh‐Brillouin scattering. There is no discernible dependence with altitude of the Sun, ruling out a significant ground‐albedo effect.
Export citation and abstract BibTeX RIS
1. INTRODUCTION
Scattered sunlight seen in the daytime sky, skylight, is known to be an imperfect representation of the solar spectrum, but the extent of the imperfections and the reasons for them are poorly understood (Grainger & Ring 1962; Noxon & Goody 1965; Hutten 1970; Barmore 1975; Kattawar, Young, & Humphreys 1981; Gray 1992a). Since the daytime sky can serve as a ready spectroscopic reference for astronomical work, we inquired into the nature of the deviations of solar spectral lines as observed in the skylight. The importance of being able to measure the solar flux, i.e., disk‐integrated, spectrum cannot be overemphasized; the Sun is the primary reference for much of stellar astrophysics. The solar line spectrum is used for direct calibration of stellar parameters and as a testing ground for interpreting physical processes in other stars, for example, chemical abundance studies, rotation and differential rotation, granulation, magnetic fields, precise temperature measurements, surface features and more general inhomogeneous atmospheric structure, and their variations during magnetic cycles. Observers have gone to considerable effort to get around the problem posed by the extended disk of the Sun in order to compare the Sun to other stars which are spatially unresolved. F. N. Edmunds, Jr. (1975, private communication) placed a reflecting sphere on a nearby mountain and observed the diminished solar image on the sphere. Livingston (e.g., Gray & Livingston 1997) replaced the focusing mirror in the McMath solar tower at Kitt Peak with a plane mirror and conscripted the entrance aperture as a pinhole camera to get a disk‐integrated image on the grating. Beckers, Bridges, & Gilliam (1976) used a cylindrical lens of 5 mm focal length to get a line image of the solar disk into the spectrograph at Sacramento Peak Observatory. A fiber‐optics flux heliostat (Gray 1972) depends on the azimuthal mixing of light during transmission through the optical fibers to integrate the solar disk. Other investigators have observed the Moon, Jupiter's moons, or asteroids in their attempts to get the "stellar" version of the solar spectrum (Wallerstein 1962; Herbig 1965; Cayrel de Strobel 1970; Croft, McNamara, & Feltz 1972). Each of these schemes has its advantages and disadvantages, but simple observations of the daytime sky using the same equipment that is turned to the stars at night would be both convenient and powerful.
In the study presented here, we focus on detailed profiles of the spectral lines, their asymmetry, central depths, and equivalent widths. We do not emphasize polarization because it appears to have no sensible effect on our observations. Grainger & Ring first noticed the filling‐in of spectral lines, and this characteristic of the altered sunlight is sometimes referred to as the "Ring effect." Previous measurements of skylight spectra were often done at the zenith or the north celestial pole (e.g., Barmore 1975), making the angular separation from the Sun inextricably tied to the time of day and limited in range. By contrast, our measurements were done using a stellar telescope, allowing the angular separation from the Sun to be set at will and over a wide range; repeated measurements taken on the same day allow us to decouple temporal from angular variations.
The scattering of light in the terrestrial atmosphere must involve wavelength redistribution because the spectral lines are altered; photons must have changed their wavelength. In this regard, atmospheric scattering differs from scattered light commonly experienced inside spectrographs, where a photon is said to be "scattered" by virtue of its being in the wrong place, but it has not changed its wavelength. Previous investigators considered molecular effects involving, for example, rotational and translational displacements of Raman scattering, aerosol fluorescence, and Rayleigh‐Brillouin scattering (Sioris & Evans 1999; Humphreys, Kattawar, & Young 1984; Kattawar et al. 1981; Brinkmann 1968; Noxon & Goody 1965). In some studies, albedo effects, i.e., reflection of sunlight from the ground back into the atmosphere, were considered important, and Mie scattering from aerosols has been invoked to dilute the overly large calculated filling‐in of spectral lines. In our work, Rayleigh‐Brillouin scattering is clearly seen, but must be combined with aerosol scattering in order to explain our observations. We do not invoke dilution by aerosols, but instead find that they play a major role in shaping the characteristic dependence of filling‐in of lines with angular separation from the Sun.
2. OBSERVATIONS
The 1.2 m telescope and the coudé spectrograph it feeds have been described earlier (Gray 1986). The Richardson image slicer, which sets the entrance slit width, coupled with a 316 λ mm−1 grating produces a resolving power ≈100,000. Although this is high for a stellar spectrograph, the central depths of the spectral lines are still reduced by several percent. Since most of our measurements are relative, this does not matter. (But bear in mind that the sky itself scatters sunlight that is not degraded by the blurring of an instrumental profile.) The detector is an 1872 diode Reticon self‐scanned array. The wavelength span is ≈70 Å, centered near 6250 Å. Other orders are removed with a 300 Å bandpass interference filter. In addition to the usual telescope and spectrograph mirrors, there are three plane mirrors in the coudé train that bring the light to the entrance aperture of the coudé spectrograph. The beam is folded into the detector by another plane mirror. The angles of incidence and reflection are 45°, or nearly 45°, and the mirror surfaces are dielectric‐overcoated silver. Undoubtedly polarization occurs at these surfaces, and both they and the diffraction grating can act as polarization analyzers for the polarization intrinsic in the skylight. However, as we will show, polarization effects do not seem to play much of a role in our data.
The observations reported here were done on clear blue sky. Most of the measurements were done with the telescope at the same declination as the Sun, but with integral differences in hour angle, both east and west of the Sun. We also did a series of measurements with declination offsets. Some of the measurements were repeated and cycled, so that time variations at any given angular separation from the Sun could be monitored. There were none of significance. The elongation angle, the angular separation of the Sun from the sky position being measured, we call θ. This turns out to be the important independent variable. In order to understand the physical processes, it is valuable to measure the sky over a large range of θ. Our measurements span a range from θ = 14  2 to 141 7 on 1999 July 27 and θ = 14 2 to 170 6 on 1999 July 30, for example.
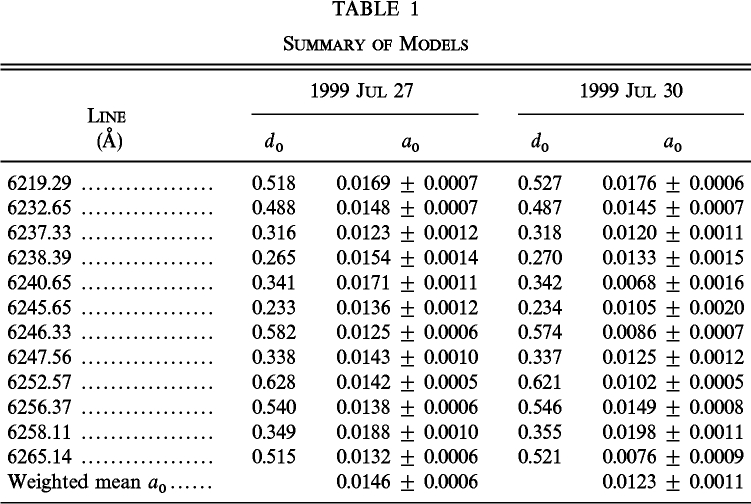
Photometric errors are relatively small, with typical signal‐to‐noise ratios of 400 in the continuum. All spectra are normalized to the continuum. Central depths of spectral lines (which we will simply call line depths) were measured by fitting a vertically oriented parabola to the three lowest points in the line cores. Individual line depths are uncertain by ≈0.3% of the continuum. The depths of 12 lines (listed in Table 1) were measured in each exposure. The amplitude of the signal is proportional to the line depth and so is easier to see in stronger lines. The errors on the average of the line depths for the 12 lines are slightly less that 0.1% of the continuum.
 |
On some days we also measured the Sun directly using a flux heliostat (Gray 1972). This device uses fiber optics to integrate the light from the disk of the Sun, allowing starlike measurements. Heliostat observations were interlaced with sky observations, enabling us to compare direct solar‐spectrum line depths with the skylight values. Within the limits of the observational errors, the heliostat measurements give line depths identical to sky values in the limit of small θ.
3. RESULTS AND ANALYSIS
3.1. Filling‐in of Lines
The elongation angle, θ, is essentially identical to the scattering phase angle (for single scatterings, with zero phase in the direction of the original sunlight) because sunlight comes to the scattering molecule and to the observer from almost exactly the same direction. When we plot the depths of spectral lines as a function of θ, we see a complex behavior. Figure 1 illustrates this variation. All spectral lines produce the same pattern of variation with amplitude proportional to the depth of the line. The means for the 12 lines we measured are plotted in Figure 1. The spectral lines are deepest in the direction of the Sun, become shallowest at intermediate angles near 100°, and then deepening slightly again toward the antisolar direction. The amplitude and detailed shape of the variation can change somewhat from one clear day to the next, and the presence of cloud produces significant perturbations in the amplitude and shape of such curves. The filling‐in at θ = 100° is ≈2.5% of the continuum for a typical line such as Fe i λ6252.57, with a central depth just over 60% of the continuum (with our spectral resolution). More precisely, the amplitude of the θ‐variation was 3.8% ± 0.3% of the line depth itself on July 27 and 3.3% ± 0.5% on July 30. These numbers can be derived from the amplitudes listed in Table 1.
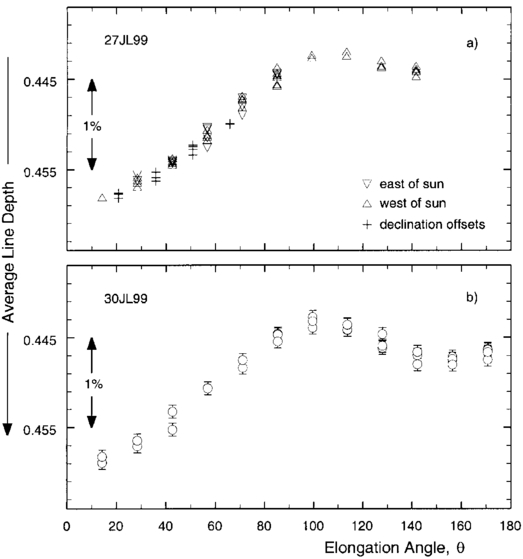
Fig. 1.— Average line depths of the 12 lines listed in Table 1 are shown as a function of angular separation from the Sun. The error bars include photon noise and readout noise of the detector and represent standard deviation errors on the means that are plotted. (a) Observations taken 1999 July 27, including angular offsets to the east, the west, and the north of the Sun, as denoted by the different symbols. (b) Observations taken 1999 July 30, all to the west of the Sun.
3.2. Line Profiles, Equivalent Widths, and Bisectors
The full profiles of the spectral lines show a simple behavior: they scale precisely with the central depth (Fig. 2). In other words, to the limit of our observational errors, the scattering that occurs in the sky does not change the shape of the lines; the lines are simply rescaled to be slightly weaker. The net effect on the profile is, therefore, similar to the changes brought about by general scattered light in spectrographs. That is, the zero level is altered by the fractional scattered light, effectively rescaling all line depths (see Gray 1974, 1992b, p. 256). This implies that the main peak of the scattering function must be narrow compared to the spectral lines. It acts like a δ‐function, but one that is normalized to unity less the fractional scattering in the core of the line, typically 3%–4% in our observations. This 3%–4% of the δ‐function area actually resides in extended wings, and the filling‐in of the lines physically results from continuum photons being redirected by these wings into the spectral lines of interest.
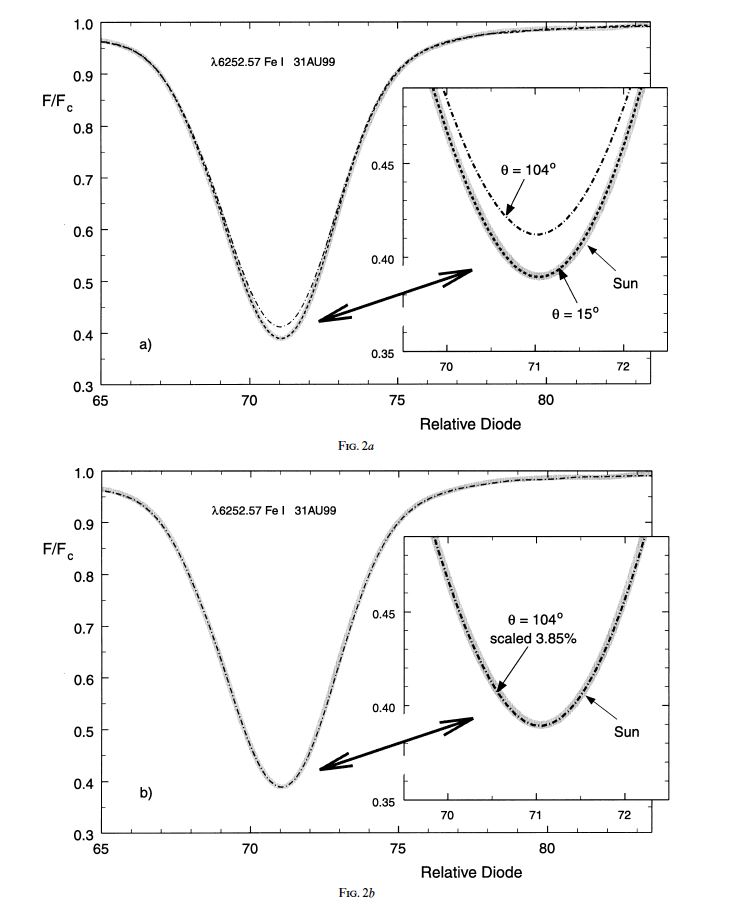
Fig. 2.— (a) Profiles taken at elongation angles of θ = 15° (dashed curve) and 104° (dash‐dotted curve) and the heliostat (wide solid curve) measurements are compared. The line cores are shown in the inset. The filling‐in of the larger θ case is ≫2.5% of the continuum. (b) The θ = 104° profiles is shown scaled deeper by 3.85%. The match to the solar profile is perfect within the errors of measurement. (The θ = 15° profile has been omitted in this second panel since it already was seen to match the solar profile in the first panel.)
Therefore, analyses using skylight spectral lines in which parameters such as stellar rotation rate and macroturbulence dispersion are deduced from line shapes will not be seriously affected. Likewise, even though the line depths are significantly altered, the ratios of line depths are not. In other words, temperature studies (e.g., Gray 1992a) that use the ratios of line depths are secure. On the other hand, studies based on equivalent widths of lines should be expected to have systematic errors. Since each point in the profile is scaled by the same factor as the core depth (as per Fig. 2), the equivalent width is reduced by this factor, i.e., up to 3%–4% of its value, depending on θ.
As a measure of the line asymmetry, line bisectors were computed for λ6246.33 and λ6252.57 for all exposures taken on July 27 and July 30. We looked at the slope and the curvature of these bisectors to see if there was any change with time or with elongation angle. If there are any variations, they are smaller than 20 m s−1, which is our detection limit. Smaller amplitude variations cannot be ruled out.
3.3. Polarization and Ground Albedo
In Figure 1a, we display, using different symbols, (1) measurements taken on the east side of the Sun, (2) measurements taken on the west side of the Sun, and (3) measurements taken with declination offsets. No systematic differences are apparent. We conclude that polarization plays no obvious role in our study. This follows because the field at the coudé focus, where the light enters the spectrograph, rotates with the hour angle and declination to which the telescope is pointing, whereas the line depths show no explicit dependence on these variables, but only on the angular separation from the Sun. The diagonal plane mirrors in the coudé train and the grating itself are expected to alter polarized light, and although the orientation of the sky polarization relative to these optical components varied widely during the observations, we detected no changes in line depths as long as the value of θ was preserved. This should not be misconstrued as a claim that polarization is not important in other situations; we are saying that any differential polarization across the line profiles must be small or nonexistent in our particular measurements.
In previous studies, sunlight reflected from the ground, a ground‐albedo effect, was thought to play a significant role (e.g., Humphreys et al. 1984). We find no dependence of the line depths on elevation of the Sun, and this implies no detectable ground‐albedo effect in our observations.
3.4. Brightness Variations
The recorded signal levels combined with the integration times of the exposures can be used to study the relative brightness of the sky as a function of θ. Figure 3 illustrates the variation we observe. In particular, there is strong peaking in the direction of the Sun. A natural explanation for this is scattering from aerosols. Their scattering profiles, or phase functions, are typically strongly forward‐throwing with a lesser backward‐pointing lobe (e.g., Lynch & Livingston 1995, p. 33; Born & Wolff 1959; van de Hulst 1957). Such phase functions will produce excess sky brightness toward the Sun and again opposite the Sun, as we observe. Aerosol scattering does not redistribute photons in wavelength; i.e., the spectral lines in the light they scatter should have unaltered profiles. Furthermore, the phase function depends on the size of the aerosols, their complex index of refraction, and, to a lesser extent, their shape. Insofar as the amount of aerosols can vary from day to day or with location, one can expect the brightness‐peaking toward the Sun to follow suit.
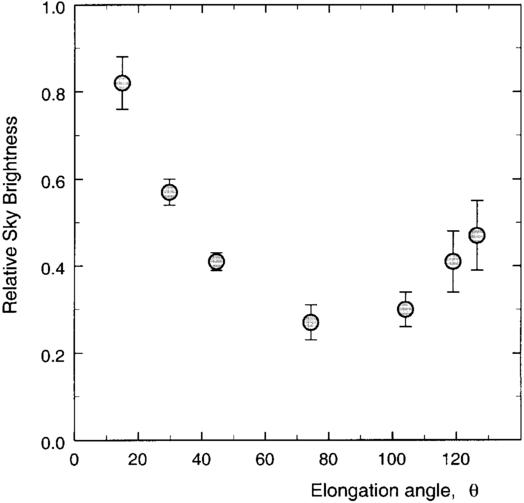
Fig. 3.— Measured relative brightness of the sky and the uncertainties are shown by the circles and error bars. The sky is distinctly brighter near the Sun and opposite the Sun.
4. INTERPRETATION
The variation shown in Figure 1 can be adequately modeled as a combination of the Rayleigh‐Brillouin scattering (Kattawar et al. 1981) with a second term representing the aerosol scattering. Redistribution in wavelength is an essential feature of the Rayleigh‐Brillouin scattering, whereas no redistribution in wavelength is an equally essential feature of the aerosol scattering. Given the information in Figure 3, we model the skylight as the sum of two spectra: one is sunlight modified by the oxygen and nitrogen molecules via Rayleigh‐Brillouin scattering, the other is unmodified sunlight scattered by the aerosols. Aerosol scattering strongly dominates for small θ‐values because of the forward‐throwing phase function, so in the limit of small θ, the skylight spectral lines would be expected to approach the true solar lines, in agreement with our observations. This result will be true as long as the aerosols have a scattering phase function dominated by a forward‐throwing main lobe. In directions away from the main lobe, the phase function becomes small, going through zeroes (corresponding to the observed minimum seen in Fig. 3), and consequently for these values of θ the spectrum is dominated by the Rayleigh‐Brillouin term. Filling‐in of the spectral lines grows as this switching of terms occurs, and that, along with the θ‐dependence of the Rayleigh‐Brillouin function itself (illustrated below in Fig. 4), accounts for the maximum seen in Figure 1 near θ = 100°. An additional component of decline when θ exceeds 100° can come from a backward‐throwing lobe of the aerosols (which is usually substantially weaker than the main lobe).
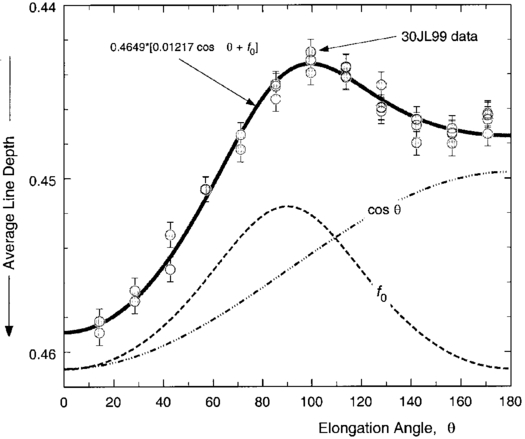
Fig. 4.— Model (wide solid curve) expressed in eq. (2) is compared with the average of the line‐depth observations (circles with error bars) of 1999 July 30. The individual cosine (dash‐dotted curve) and Rayleigh‐Brillouin (dashed curve) components are displayed underneath; they have been arbitrarily offset vertically so they do not conflict with the main part of the diagram, but they have the correct amplitude of variation.
This model can be made quantitative in the following way. The Rayleigh‐Brillouin function given by Kattawar et al. in their Figure 2 is indeed narrow compared to solar spectral lines for all values of θ; it therefore does have the requisite δ‐function behavior noted above in § 3. Furthermore, for unpolarized light, Kattawar et al. give the scaling function for Rayleigh‐Brillouin scattering,
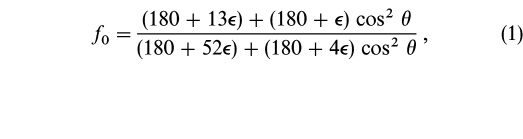
where  = 0.222. This is an absolute scaling function that produces the scaling effect seen in our Figure 2. Its variation with θ is relatively small, amounting to 2.0%.
For the aerosols, it is essential to model the forward‐throwing main lobe, but other smaller details of the phase function are likely to be smeared out by a range in size of the particles, and possibly by the presence of different types of particles. Therefore, we chose a simple cosine for this component of the model (although 1 + cos θ works equally well). Our model for line depth takes the form
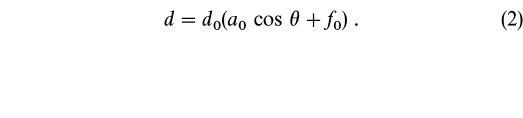
With the aid of least‐squares fitting, we determined the coefficients d0 and a0 for each of 12 lines, and they are given in Table 1. Bearing in mind that the signal is weaker in weaker lines, we see that within error every line on a given day yields the same relative amplitude for the cosine term (i.e., a0). Using weights proportional to the central depth of the line, the weighted mean value of the cosine amplitude is a0 = 0.0146 ± 0.0006 on July 27 versus 0.0123 ± 0.0011 on July 30, or a cosine variation of 3.0% and 2.4% for the 2 days compared to the 2.0% variation in f0. Figure 4 shows the model against the 12 line average variation of line depth for July 30, and we see that the model fits rather well.
The Rayleigh‐Brillouin function has a value of 0.975 at θ = 0°, which implies 2.5% filling‐in of skylight profiles in the limit of small θ. However, this residual filling‐in is diluted by the dominant aerosol component by perhaps a factor ≈3 (as per Fig. 3). Consequently, the model predicts skylight profiles to deviate from true sunlight profiles by ≤1% of the line depth as θ approaches zero. This basically agrees with our observations, as illustrated for λ6253 in Figure 2. (We occasionally see heliostat line depths to be less deep than the small‐θ skylight values by ≈0.2% of the continuum, but we attribute this to systematic errors in our equipment.)
Although the shape illustrated in Figure 4 seems to be the predominant one, we have observed, on other days, significant deviations from this shape. In one case, the Rayleigh‐Brillouin hump was considerably reduced in amplitude, presumably because of a much larger than normal contribution of aerosols to the skylight spectrum. Since that day was particularly humid, the aerosols may have been mainly water droplets.
5. CONCLUSIONS
Skylight is not a precise replica of the solar line spectrum, and some care is warranted in using the skylight spectrum as an astrophysical reference or calibration. Central depths and equivalent widths of skylight lines can be reduced by several percent compared to true solar values. The size of these degradations varies (only) with the angular distance from the Sun, rising from essentially the true value very close to the Sun to a maximum ≈4% near 100°, followed by a slight decline again toward still larger separations from the Sun. Two strategies for using skylight as a spectroscopic reference are therefore available: (1) look at the sky as close to the Sun as feasible with the instrumentation being used; and (2) measure the variations with solar elongation, obtaining curves such as those shown in Figures 1 and 4, and apply scaling corrections by extrapolating to zero angular separation.
Line profiles are scaled strictly in proportion to the altered central line depth, and so retain their shape. Therefore, scientific analyses incorporating the shapes of skylight spectral lines will not be sensitive to what part of the sky is used. Ratios of line depths or ratios of equivalent widths are also safe since the scaling factor cancels when the ratio is formed. No variation in line asymmetries with angular separation from the Sun was detected.
Polarization and ground‐albedo effects appear to be negligible, at least in our data. The filling‐in of the spectral lines with angular separation from the Sun can be adequately modeled as a combination of Rayleigh‐Brillouin scattering and a cosine term mimicking the forward‐throwing phase functions of aerosol scattering.
Based on the recent low‐resolution study of Sioris & Evans (1999), we anticipate the filling‐in of spectral lines to be more severe toward shorter wavelengths. However, high‐resolution studies are still needed to establish this, especially because the phase functions of the aerosols vary with wavelength.
We are grateful to the Natural Sciences and Engineering Research Council of Canada for financial support. We express our thanks to A. T. Young for several helpful comments.