
ABSTRACT
Like two other metal‐poor, late‐type field stars showing odd abundance ratios suggestive of accreted origin, BD +00°2058A has a substantial apogalactocentric distance, reaches a large maximum height above the Galactic plane, and is a member of a common proper motion system. To examine whether such wide pairs might have a common origin in accreted subsystems, we present detailed abundances in BD +00°2058A derived from high signal‐to‐noise, high‐resolution optical spectroscopy. Using spectroscopically derived parameters, we find [Fe/H] = -1.16 ± 0.07, a factor of 2–4 larger than previous (but less direct) estimates. We find the α‐element, iron‐peak, and n‐capture abundances to be unremarkable compared with other field stars of similar [Fe/H]. The derived Li abundance, log N(Li) = 2.53, is large compared with otherwise similar stars; the normal n‐capture abundances and upper limits to6Li/7Li provide no evidence of Li enrichment from Li‐rich asymptotic giant branch star material or spallation. Interestingly, the [C/Fe] and [Na/Fe] ratios appear to be ∼0.3 dex lower and higher, respectively, than otherwise similar stars. This might point to Li enrichment by contaminating material having undergone "cool bottom processing," but the lack of radial velocity variations provides no evidence of a close companion. Comparison with theoretical isochrones suggests a distance of 150 pc, which is in better agreement with two previous studies' estimates of the distance of the fainter wide companion; kinematically based population classifications based on this distance are ambiguous. Finally, we draw attention to the importance of different, but reasonable, choices of Fe i gf‐values in our (and other) analyses.
Export citation and abstract BibTeX RIS
1. INTRODUCTION
In the ensuing nearly four decades since the seminal study of Eggen, Lynden‐Bell, & Sandage (1962), the study of the structure and formation of the Galactic halo remains a vital field of astrophysical interest nurtured, in part, by large‐scale kinematically and spectroscopically selected stellar surveys (e.g., Ryan & Norris 1991; Beers, Preston, & Schectman 1992). Recently, high‐quality spectroscopic abundance determinations of several elements in Population II stars have revealed some surprises. Nissen & Schuster (1997, hereafter NS97) determined abundances in a sample of 13 kinematically defined halo stars with intermediate metallicities (−1.3≲[Fe/H]≲ - 0.5) and found that eight of these demonstrated anomalously low [α/Fe] values. Given the relation between the underabundances and the stars' orbital parameters, NS97 suggested that their eight objects may have been accreted from nearby dwarf galaxies having chemical evolution histories distinct from that of the Milky Way.
King (1997a, hereafter K97) determined abundances in the metal‐poor ([Fe/H] = -1.50) halo dwarfs HD 134439 and HD 134440 and found α‐element ratios [Mg, Si, Ca/Fe] some 0.3 dex lower than those of metal‐poor field dwarfs; as noted by NS97 for their [α/Fe]‐poor stars, [Na/Fe] and [Ni/Fe] appear to be 0.1–0.2 dex lower in HD 134439/134440 than similarly metal‐poor field stars. Carney et al. (1997, hereafter C97) found that the metal‐poor ([Fe/H] = -1.9) halo subgiant BD +80°245 has [α/Fe] ratios discrepant by a further factor of ∼2 compared with other metal‐poor halo stars. The C97 and K97 studies reveal [Ba/Fe] to be significantly underabundant in their α‐deficient stars, but this property is not evident for the NS97 stars.
Given the C97 and K97 stars' distinct chemical abundances, retrograde motion, and large apogalactic distances (42 kpc for HD 134439/134440 and 22 kpc for BD +80°245), an extragalactic origin for these current Galactic denizens is also suggested. Such conjecture is supported by the abundance study of the anomalously young Galactic globulars Rup 106 and Pal 12 by Brown, Wallerstein, & Zucker (1997), who find low [α/Fe] ratios—like those for HD 134439/134440 and BD +80°245—in giants in these metal‐poor ([Fe/H]∼ - 1.5 for Rup 106; [Fe/H]∼ - 1.0 for Pal 12) clusters, which Lin & Richer (1992) suggest have been accreted from the Magellanic Clouds. Although the Sagittarius dwarf (Ibata, Gilmore, & Irwin 1994) has been caught in the act of dissolving into the Galactic field, evidence other than the apparent paucity of α‐deficient metal‐poor stars suggests that accreted stars account for only a few percent of the halo field (e.g., Preston, Beers, & Schectman 1994; Unavane, Wyse, & Gilmore 1996). Regardless, the identification and characterization of such rare objects is of great interest since they may reveal historical accretion events in the Galaxy (Stephens 1999).
BD +80°245 and HD 134439/134440 share more characteristics than chemical anomalies, rather extreme kinematics, and large apogalactocentric orbits; they are also members of common proper motion systems. Might a common origin of such wide systems, which can survive disruption during the Galactic lifetime (see, e.g., Stryker et al. 1985), be accretion from Galactic neighbors? If so, then such pairs may be fertile candidates in attempts to locate other chemically anomalous metal‐poor stars. As a small step in investigating this possibility, we present abundances derived from high‐resolution and high signal‐to‐noise (S/N) spectra of the metal‐poor common proper motion star BD +00°2058A. This star is an additionally attractive accretion candidate since it has a relatively low age relative to other metal‐poor field stars in the Schuster & Nissen (1989) study and since it likely belongs to the "high halo" category of Carney et al. (1996, hereafter C96), who proposed that such objects have been accreted by the Galaxy.
BD +00°2058A is also of interest for other reasons. The Ca ii K–based metallicity estimate of Ryan & Norris (1991) is [Fe/H] = -1.74; the high‐resolution, low S/N spectroscopic determination in Carney et al. (1994) is [Fe/H] = -1.51. Despite apparent metal poverty, Vrot estimates from these studies are ∼180 km s−1, which is suggestive of disk kinematics—although the distance is uncertain and Hipparcos results are unable to improve this. Given asymmetric drift estimates for the thick disk in the range −30 to −100 km s−1 (Carney, Latham, & Laird 1989; Wyse & Gilmore 1988), the V velocity is suggestive of membership in the thick disk, which has been suggested to have a merger origin. However, the extant metallicity estimates are significantly lower than some values ([Fe/H]∼ - 0.5 to −1.0) purported to characterize this apparent Galactic component; indeed, the magnitude of the W velocity component is consistent with a low metallicity and suggestive of a halo classification. Detailed abundances in this star might elucidate the nature of this star in the framework of Galactic populations.
2. SPECTROSCOPIC DATA
We observed BD +00°2058A using the two‐dimensional coudé spectrograph (Tull et al. 1995) of the McDonald Observatory 2.7 m telescope during 1994 January. Uncooperative weather hampered observations of the fainter common proper motion companion BD +00°2058B. The instrumental configuration yielded an inverse spectral resolution of R∼60,000. A 1500 s exposure was taken at two different grating settings to lessen incomplete wavelength coverage.
Preliminary processing was performed using standard IRAF1 routines. Flat‐fielding the CCD exposures, order identification and extraction were accomplished using a suite of FIGARO echelle reduction routines developed and imported into the IRAF environment at U. Texas by J. McCarthy and A. Tomaney. Scattered light corrections and dispersion solutions (found from Th‐Ar lamp spectra) were carried out using routines in the IRAF ECHELLE package. Continuum rectification and measurement of the extracted one‐dimensional spectra were carried out using the extensive suite of routines in the package SPECTRE (Fitzpatrick & Sneden 1987). The final per‐pixel S/N achieved is ∼175–200. The data are thus nearly identical in quality to those obtained with the same instrumentation and displayed in Figures 2 and 3 of King (1997b).
3. ABUNDANCE ANALYSIS
3.1. Procedural Comments
Abundances were derived from measured equivalent widths using an updated version of the LTE analysis package MOOG (Sneden 1973), and the l/Hp = 1.25 model atmospheres of R. L. Kurucz (1992, private communication). While a differential line‐by‐line analysis with respect to the Sun is desirable for accurate abundances, most moderate strength lines in BD +00°2058A are quite strong in the Sun, and this might raise concerns about the treatment of damping in performing a consistent solar normalization of the stellar abundances. For cases where this was a concern (Fe i, Cr i, Mg i), normalization of the mean stellar absolute abundance was carried out using the mean solar abundance derived from different (generally weaker) solar features havinggf‐values consistently determined in the same fashion as for the stellar features. For the remaining species (Fe ii, Ni i, Ti ii, Ca i, Si i, O i, S i, Na i, C i, Ba ii, Y ii, Zr ii), solar normalization was carried out on a line‐by‐line basis using consistently determined solar abundances.
3.2. Equivalent Widths and Atomic Data
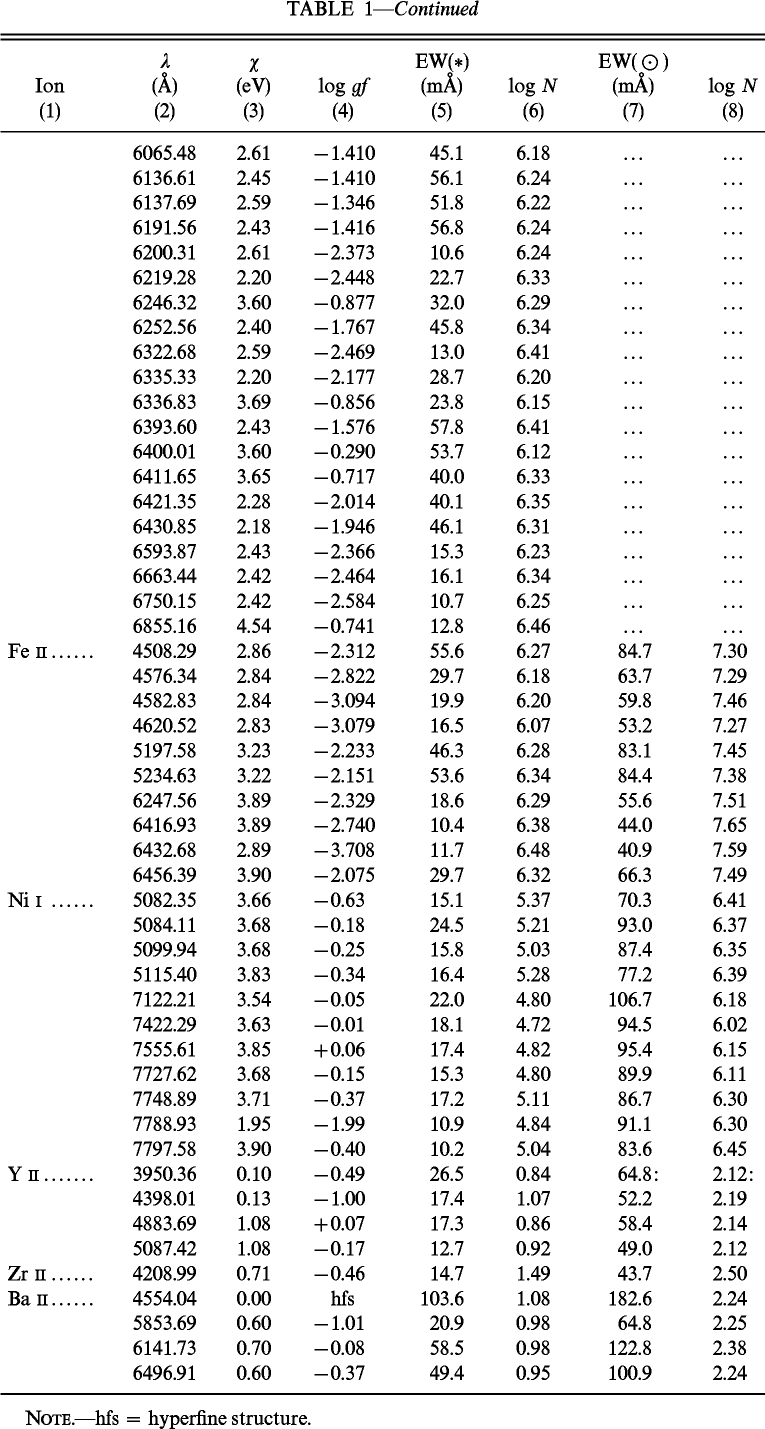
The species and wavelengths of the analyzed features are given in columns (1) and (2) of Table 1. Columns (3) and (4) contain the lower excitation potential and oscillator strength. The gf‐values for Fe i are the reasonably accurate (typically ≲15% or so) measures from O'Brian et al. (1991); for three features (λλ4978, 6336, 6400), gf‐values were taken from Bard & Kock (1994) or Bard, Kock, & Kock (1991, hereafter BKK). Thegf‐values for Fe ii are from Biemont et al. (1991). The remaining oscillator strengths are as follows: mean values of Blackwell, Menon, & Petford (1984) and Tozzi, Brunner, & Huber (1985) for Cr i; both Edvardsson et al. (1993, hereafter E93) and Thévenin (1990) for both Ni i and Si i; mean values from Chang (1990) and Chang & Tang (1990) for Mg i; Wiese, Smith, & Glennon (1966) for O i; the Kurucz (1995) CD‐ROM linelist value for S i; Table 2 of Holweger (1971) for Na i; Table 1 of Grevesse et al. (1991) for C i; the sources utilized and described by King et al. (1998, hereafter K98) for Ti ii and Ca i; and the sources utilized and described by King, Deliyannis, & Boesgaard (1996) for Ba ii, Y ii, and Zr ii. Owing to its significant strength in the Sun, hyperfine structure components of the λ4554 Ba ii were taken into account using the data from McWilliam (1998) and assuming the solar isotopic proportions from Anders & Grevesse (1989).
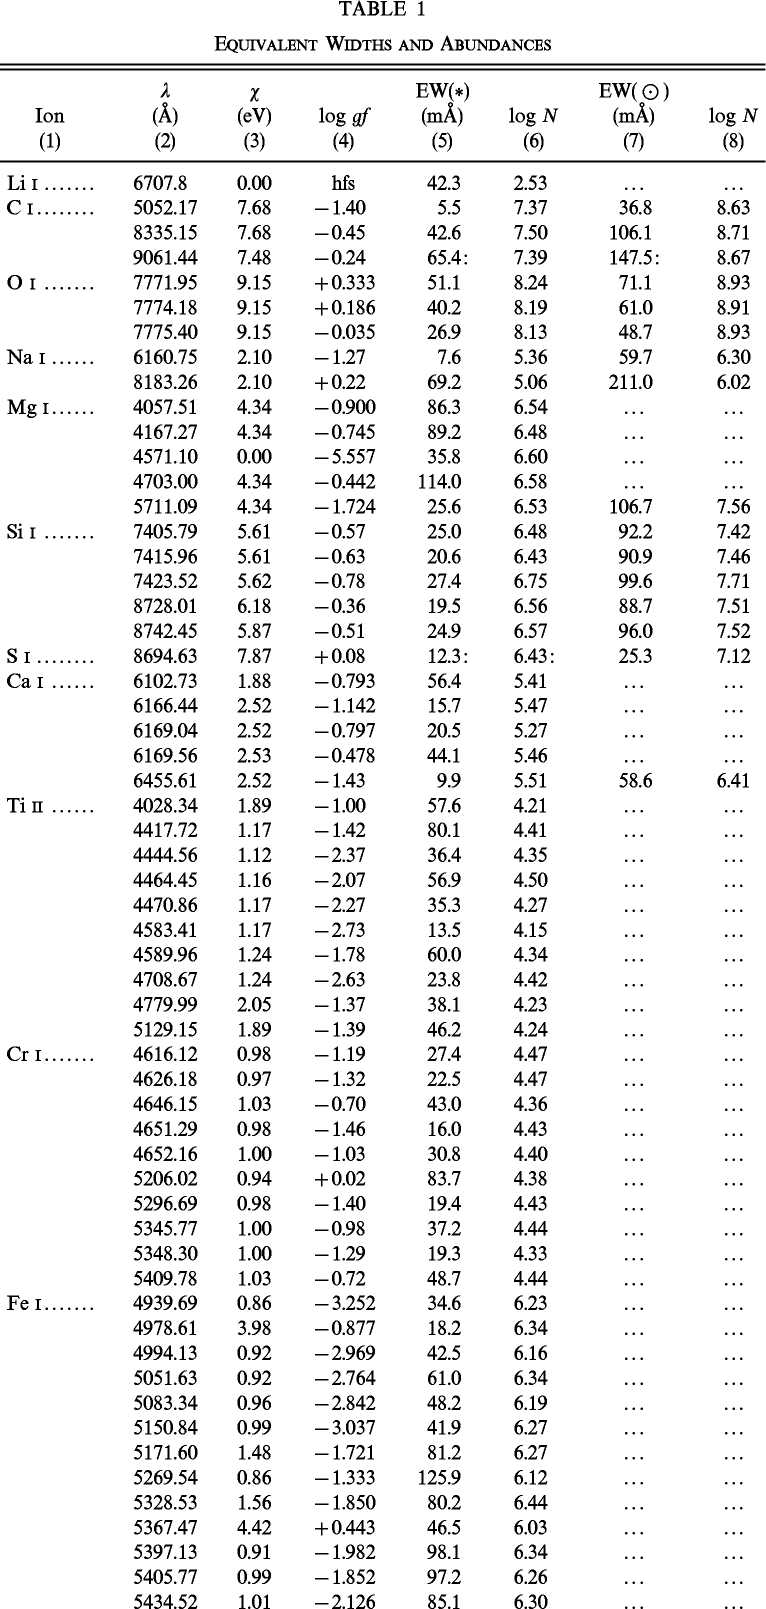 |
The stellar equivalent widths and the derived absolute stellar abundances are listed in columns (5) and (6) of Table 1. The solar line strengths measured from a daytime sky spectrum obtained with the same instrumental configuration used to acquire our stellar spectra, and the absolute abundances derived therefrom, are given in columns (7) and (8) of Table 1. When no solar data are listed, this indicates either that solar data for the same features were not used to conduct a line‐by‐line normalization or that we used the solar abundances for the same features from Table 3 of K98, which were derived in a wholly self‐consistent fashion (same atmospheres, damping assumptions, consistent atomic data, etc.) as the present abundances. If the former, then the mean solar abundances of a particular species from K98 were used to normalize the mean stellar abundance derived here. The K98 solar data are from a high‐resolution, high S/N lunar spectrum obtained with the Keck HIRES spectrograph. We searched for any systematic instrumental differences by measuring 16 Fe i lines having a range in strength from a daytime sky spectrum obtained with our McDonald 2.7 m configuration. The comparison is shown in Figure 1 and indicates outstanding agreement. The mean equivalent width difference (Keck minus McDonald) is 0.1 ± 0.5 (s.d. of 1.8) mÅ; in relative terms the differences is 0.6% ± 1.0% (s.d. of 3.9).
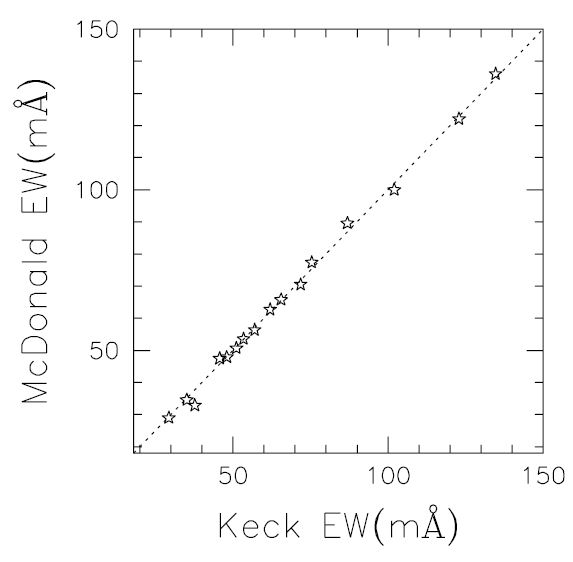
Fig. 1.— Equivalent widths of 16 Fe i lines measured from our McDonald 2.7 m daytime sky spectra are plotted against equivalent widths from the Keck measures of K98.
3.3. Peripheral Notes
Peripheral notes concerning the analysis and data are as follows: A typical modest enhancement (2.2 times) in the van der Waals broadening was employed for all species except Ba ii. Following several studies (e.g., the seminal solar analysis of Holweger & Mueller 1974), a slightly larger van der Waals enhancement factor of 3.5 was adopted for the Ba calculations. The K98 solar Mg and Ca data was supplemented with the λ5711 Mg i and λ6455 Ca i features measured in our McDonald sky spectrum and are listed in Table 1; the atomic data for this Ca feature are taken from Tomkin et al. (1997). The stellar measurement of the weak S i line is more uncertain than for the other lines.
The only two Na i lines available to us are not entirely satisfactory. The profile of the λ6160 feature is not clean in our stellar spectrum; the measured line strength is thus uncertain. The solar λ8183 feature is strong, and its abundance is sensitive to damping and the accuracy of the measured line strength. The normalized [Na/H] values are in outstanding agreement, however. For the λ9061 C i feature, we adopted a gf‐value which gave an absolute solar abundance equal to the mean from the other two C i lines. This feature may be affected by modest blending. The equivalent width measured from the Kurucz et al. (1984) atlas is 134 mÅ, 14 mÅ less than the measure from our McDonald sky spectrum. We have retained the latter, however, to mitigate the effects of blending which would likely similarly affect the stellar line too. Accordingly, ourgf‐value is 0.1–0.2 dex larger than the values from Grevesse et al. and the Kurucz (1995) CD‐ROM. Happily, the three lines yield normalized C abundances in fine agreement. Given the significant strength of the λ4554 Ba ii feature, its strength was measured from the high‐resolution, high S/N solar flux atlas of Kurucz et al. (1984).
3.4. Stellar Parameters
Initial parameters of Teff = 6065 K, log g = 4.25, ξ = 1.5 km s−1, and [m/H] = -1.5 were adopted to begin our analysis. The remainder of the analysis, while not described as such, was conducted iteratively such that successive results were used to adjust the initial parameters until self‐consistency was achieved. The weaker of those Fe i lines listed in Table 1 were considered first. Minimizing the trend of derived absolute abundances with excitation potential yielded Teff = 6130 K. Repeating the analysis with the stronger lines and minimizing the trend of abundances with line strength resulted in an estimate of ξ = 1.4 km s−1. The final satisfactory state of affairs between abundance and excitation potential/line strength is shown in Figure 2, where the Fe i lines have been supplemented with the Fe ii, Ti ii, Cr i, and Mg i results in the abundance versus line strength plane.
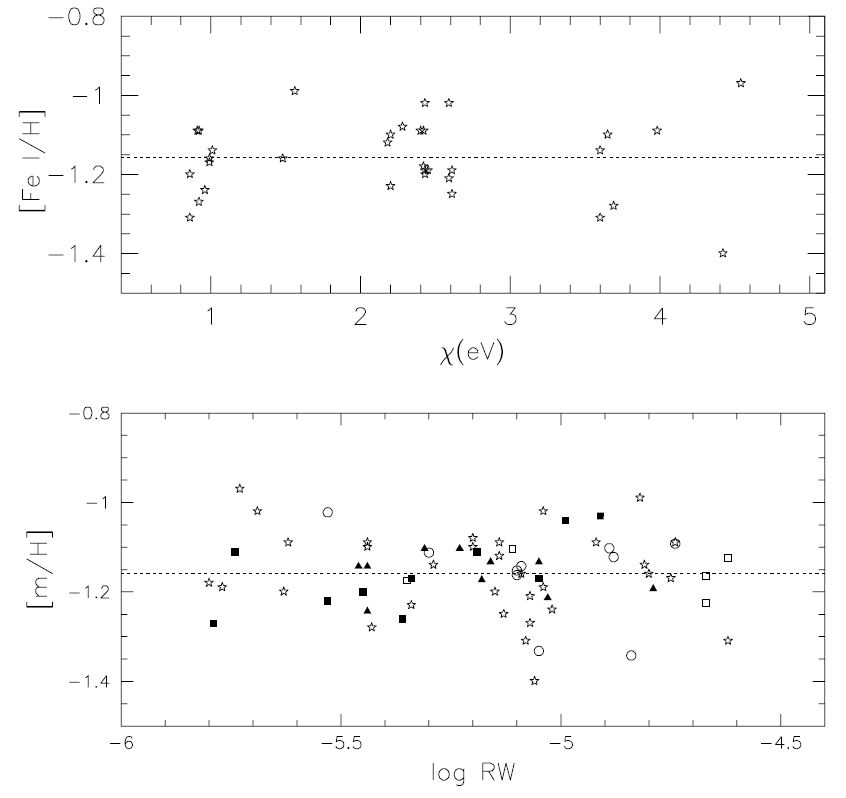
Fig. 2.— The top panel shows the Fe i–based Fe abundances (normalized by the constant Fe i–based solar Fe abundance of K98) as a function of lower excitation potential. The bottom panel shows the Fe i–based Fe abundances (stars), Fe ii–based Fe abundances (filled squares), Ti ii–based Ti abundances (open circles; adjusted by an additive constant to set the mean Ti abundance equal to the mean Fe abundance), Cr i–based Cr abundances (filled triangles; similarly adjusted by a constant), and Mg i–based Mg abundances (open squares; also adjusted) as a function of reduced equivalent width. No significant trend is present in either panel.
We find [Fe/H] = -1.16 ± 0.03 (internal mean error) with a 0.10 dex scatter in the absolute Fe i abundances. Accordingly, the final parameters and results were derived with a refined model atmosphere metallicity of [m/H] = -1.0. Ionization balance was used to estimate the final log g value. The assumed model atmosphere gravity was altered until we achieved a mean result of [Fe ii/H] = -1.16, the result from our Fe i lines. This procedure yields log g = 4.19. The per‐line Fe ii standard deviation is a satisfactory 0.085 dex (σ = 0.03 dex), similar to the Fe i value.
3.5. Uncertainties and Results
The Teff uncertainty was determined by reanalyzing the Fe i lines with model atmospheres of different Teff and examining the resulting slope in the abundance‐excitation plane. We find that the 1 σ level changes occur for 65 K deviations and take this as our Teff uncertainty. Similar examination of slope changes in the abundance–line strength plane after varying the assumed microturbulence suggests a 1 σ level uncertainty of ±0.15 km s−1. The uncertainty in log g from the internal mean abundance errors in the Fe i and Fe ii results is ±0.11 dex. However, the derived gravity is also sensitive to the assumed temperature since this affects the Fe i abundance. Including the above Teff uncertainty, the final total estimate is σ(log g) = ±0.19 dex.
The final normalized abundance ratios (i.e., relative to Fe) are given in Table 2. The internal statistical mean error (usually derived from the line‐to‐line scatter) in the abundance ratios is given in column (3). The typical line‐to‐line abundance (i.e., relative to H) scatter for a given species is 0.08 dex, with a range from 0.04 dex (Si i) to 0.13 dex (Ni i). Given the uncertainties mentioned above in the S and Na results, we suggest uncertainties of 0.15 dex in their abundances. The Zr abundance uncertainty (0.10 dex) is assumed to be similar to the typical per line abundance scatter of other species. Columns (6)–(8) of Table 1 show the changes which result in the abundance ratios when altering each ofTeff, log g, and ξ by the indicated amounts and holding the other parameters fixed.
 |
3.6. Li Abundance and the6Li/7Li Ratio
The Li abundance was determined from the λ6708 Li i resonance feature by comparing the measured line strength with that of syntheses conducted using the linelist of King et al. (1997). We find log N(Li) = 2.53 ± 0.05, an abundance that is high relative to other warm stars of similar metallicity; therefore, we also examine the6Li/7Li ratio. First, a precise estimate of the wavelength shift to the rest frame was estimated from 14 Fe i lines having accurate wavelengths in the NIST on‐line database. Macroscopic broadening (parameterized with a Gaussian) was determined by synthesizing the profiles of eight different Fe i features using abundances from their equivalent widths, convolving these with Gaussians, and comparing these with the observed spectra. The left panel of Figure 3 shows a synthesis of the λ6708 Li i region containing no6Li and having log N(7Li) = 2.53 as determined from the measured line strength. The synthesis, assuming no6Li, is a wholly satisfactory fit to the data.
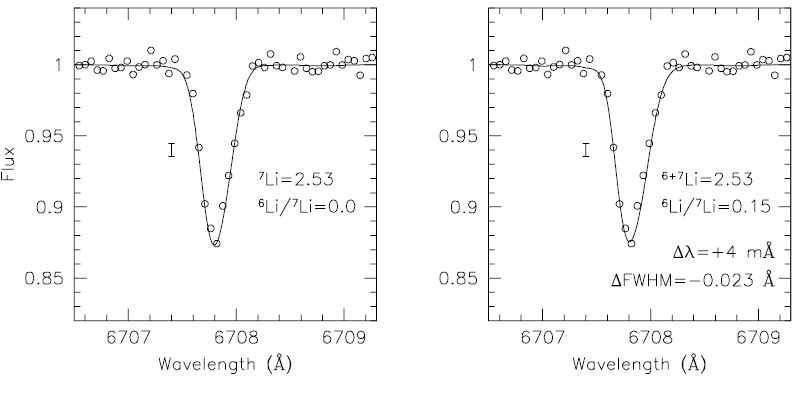
Fig. 3.— The observed spectrum (open points) of BD +00°2058A in the λ6708 Li i region with overplotted syntheses (solid line). The left panel shows a synthesis containing7Li alone for log N(Li) = 2.53 (set by the equivalent width) with our best macroscopic broadening and wavelength shift estimates. The right panel shows a synthesis with6Li and7Li (in the ratio of 0.15) for the same total Li abundance. Trial adjustments (broadening and wavelength shift) relative to our best estimates are indicated. The plotted error bar gives the per‐point (pixel) Poisson‐based flux uncertainty.
The right panel of Figure 3 shows a synthesis with the same total Li, but 6Li/7Li = 0.15. To "improve" the quality of the fit, we have (a) shifted the data redward by an additional 4 mÅ with respect to our optimal value used in the left panel and (b) decreased our best‐estimate FWHM of the convolving Gaussian by 0.023 Å. Both of these changes are 2–3 σ excursions each as estimated from our multiple measures. Still, the synthesis appears to be slightly too weak (despite decreased macroscopic broadening) and the synthetic red core and wing too strong (despite the redward shift applied to the data). We believe that 6Li/7Li≲0.15 is a conservative limit to the6Li content of BD +00°2058A. Lower but nonzero values, though, are certainly allowed. A caveat is that the above analysis implicitly assumes that the photospheric velocity distribution (both its mean and width) is similar for Fe i and Li i. The rigorous accuracy of this usual assumption is unclear, as are the effects of, e.g., convective inhomogeneities.
4. DISCUSSION
4.1. Stellar Parameters
Our result of 6130 ± 65 K for BD +00°2058A is in good accord with the infrared flux method estimate of 6065 ± 83 K by Alonso, Arribas, & Martinez‐Roger (1996) and somewhat warmer than the 6000 ± 42 K photometric estimate of Carney et al. (1994, hereafter C94); the agreement remains reasonable given the respective errors, and the higher Strömgren‐based reddening of E(B−V) = 0.03 [assuming E(b−y) = 0.72E(B−V)] of Schuster & Nissen (1989, hereafter SN89). A comparison of the dereddened Strömgren photometry of SN89 with the synthetic R. L. Kurucz (1992, private communication) grid colors in the (b−y)0 versus c0 plane indicates log g = 4.13 for [m/H] = -1.2 and log g = 4.19 for [m/H] = -1.0. These values are in excellent agreement with our spectroscopic estimate of log g = 4.19 ± 0.19. The gravity and near‐turnoff Teff does not cleanly establish a dwarf or subgiant classification.
Our "metallicity" estimate [Fe/H] = -1.16 is a factor 2–4 larger than the moderate resolution Ca ii K–based estimate of Ryan & Norris (1991; −1.74), the high‐resolution, low S/N spectroscopic estimate (−1.51) of C94, and the Strömgren‐based value (−1.41) of SN89. The reason for these discrepancies is unclear. Table 2 indicates that our Teff would have to be overestimated by 410 K to yield [Fe/H] = -1.5; this would result in unacceptable abundance‐excitation trends. Interestingly, our metallicity is in good agreement with the C94 estimate of [m/H] = -1.27 for the cooler proper motion companion BD +00°2058B; the Ryan & Norris (1991) [Fe/H] estimate for BD +00°2058A is also substantially lower than for the cooler component.
4.2. Abundances and Population Classification
4.2.1. Age Estimate
Age, kinematics, and detailed abundances can be examined to address the Population classification of BD +00°2058A. First, we revisit the relatively low 10.5 Gyr age of SN89 by comparing our inferred Teff and log g values with evolutionary models. Our [Fe/H] abundance, the scaling relation of Salaris, Chieffi, & Straniero (1993), and the assumption of Z⊙ = 0.017 indicate that Z = 0.0018 isochrones are most appropriate for comparison with BD +00°2058A.
The left panel of Figure 4 plots BD +00°2058A in the log g versus Teff plane with isochrones having Y = 0.23 and Z = 0.002 from Straniero & Chieffi (1991). BD +00°2058A appears to be right at the turnoff with an age of 14 Gyr, although an age as young as 10 Gyr is allowed. The right panel plots BD +00°2058A plotted with the Y = 0.23 and Z = 0.001 Yale96 isochrones;2 this metallicity is appropriate for, e.g., lower metallicity determinations noted above. The star resides right at the turnoff and is very old (20 Gyr); about 4 of the 6 Gyr difference between the two sets of isochrones is because Yale96 isochrones are ∼100 K hotter at the metallicity, gravity, and rough age of our star. In sum, BD +00°2058A resides right at the turnoff and has an age similar to the oldest globulars, although an intermediate age is allowed.
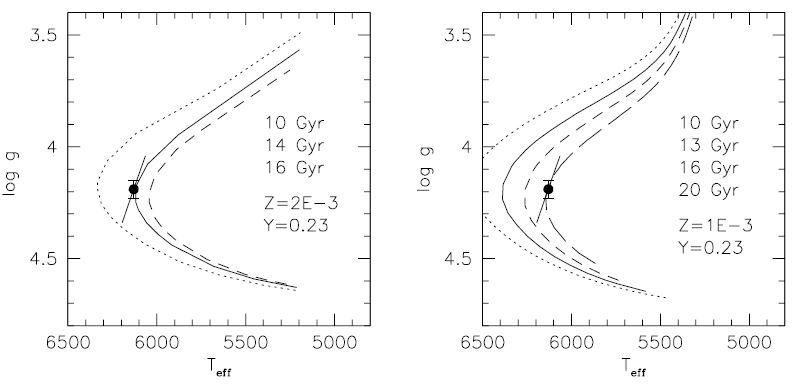
Fig. 4.— The left panel shows our values of Teff and log g for BD +00°2058A (point) plotted with the Y = 0.23, Z = 2 × 10⁻³ isochrones of ages 10, 14, and 16 Gyr from Straniero & Chieffi (1991). The vertical error bars indicate the internal uncertainty in log g. The horizontal extent of the sloping error bar represents the internal uncertainty in Teff, while its vertical extent represents the Teff effect on the derived log g. The right panel is similar, but contains the Y = 0.23, Z = 1 × 10⁻³ Yale96 isochrones with ages 10, 13, 16, and 20 Gyr.
4.2.2. Distance and Kinematics
The MV values of BD +00°2058A were determined from the two isochrone sets and averaged to yield MV = 4.23. The observed V magnitude and AV = 0.09 mag from the Strömgren‐based reddening gives (mV−MV) = 5.89; uncertainties in the derived parameters, reddening, and isochrone differences mean this estimate is probably no better than to 0.5 mag. Ryan (1992) notes that both his VRI‐based and UBV‐based distance moduli for the two BD +00°2058 components differ by ≳0.5 mag. The C94 distance estimate is 97 and 162 pc for BD +00°2058A and B; those of Ryan & Norris (1991) are 133 and 172 pc. Our value of 151 (±31 pc) for BD +00°2058A is in better agreement with both of the estimates for the B component. This distance, the C94 radial velocity, and the Hipparcos proper motions yield space velocities of U = 113 ± 13, V = -78 ± 33, and W = -231 ± 55 km s−1.
The inferred rotation and total space velocities are thus Vrot∼140 km s−1 and Vsp∼270 km s−1. The Vrot value suggests disklike kinematics with a drift comparable to thick disk estimates noted in § 1. On the other hand, the W and Vsp values seem very large for a thick disk star and more consistent with a halo classification. The three‐dimensional orbital eccentricity of C94, calculated using the kinematic/orbital parameters for BD +00°2058B since its distance UVW values are close to ours for BD +00°2058A, is an intermediate e = 0.43—typical of more metal rich stars (−1.0≲[Fe/H]≲ - 0.5; Fig. 4 of C96), although Figure 2 of C96 shows a number of considerably more metal poor stars ([Fe/H]≲−2.0) with comparable or smaller eccentricities.
That the kinematics offer no clear population classification likely illustrates the difficulty in classifying a single star into broad groups with a continuum of properties. However, the kinematics of BD +00°2058A remain interesting given the atypical eccentricity and V velocity (Figs. 5 and 7 of C96), and the outlying Zmax (maximum height above the Galactic plane; Fig. 10b of C96) value for its metallicity. Zmax for BD +00°2058B (taken again as a proxy for A) from C94 is a large 6.8 kpc; this places the system in the C96 "high halo" group, which they suggest to have an accreted origin given its retrograde motion. NS97 find their (anomalous) lowest [α/Fe] and [Na/Fe] values in stars with the largest values of Zmax. While the "high halo" BD +00°2058 has prograde motion, one might wonder if its kinematics and high Zmax are due to an accreted origin. If so, detailed abundance ratios might provide a clear sign of this.
4.2.3. Abundance Signatures
Our abundances, however, reveal no such sign. The [Ca, Si, Ti/Fe] ratios we find (Table 2) are indistinguishable from those seen in the more metal poor disk stars and metal‐rich halo star in Figure 4 of NS97 and Figure 15 of E93. Our [O/Fe] ratio perhaps exceeds that of NS97 by 0.1 dex. The large [S/Fe] ratio is similar to those derived in modestly metal‐poor stars (Francois 1988). [Mg/Fe] may be a possible exception. Our value is ∼0.15 dex lower than the modestly metal‐poor values in NS97, E93, and Fuhrmann, Axer, & Gehren (1995); however, the latter note significant scatter in [Mg/Fe]. The weight of the evidence indicates an unremarkable [α/Fe] ratio for BD +00°2058A.
Combining the results of various studies (e.g., Fig. 5 of NS97 and Figs. 30 and 33 of Timmes, Woosley, & Weaver 1995) indicates that [Cr,Ni/Fe] = 0 to −0.1 at the [Fe/H] of BD +00°2058A. Our values of [Cr/Fe] = -0.08 ± 0.04 (internal) and [Ni/Fe] = -0.12 ± 0.05 are consistent with this. The [Na/Fe] deficiency of accreted candidate stars in the NS97 and K97 studies is not seen for BD +00°2058A; rather, our value of [Na/Fe] = +0.21 is larger than or perhaps comparable to ratios seen in similarly metal‐poor stars (Fig. 5 of NS97, Fig. 17 of TWW, and Fig. 15 of E93). The union of these data, though, leaves the impression of systematic differences or large intrinsic scatter in metal‐poor Na abundances.
The n‐capture element abundances appear completely normal with respect to those exhibited by the majority of metal‐poor stars. The typical modest (∼0.1 dex) [Ba/Fe] and [Y/Fe] underabundances and [Zr/Fe] overabundance in metal‐poor stars is also demonstrated by BD +00°2058A. In particular, our [Ba/Fe], [Y/Fe], [Zr/Fe], and [Y/Zr] values are in outstanding agreement with those from the observed relations of Gratton & Sneden (1994). In sum, the abundance ratios of BD +00°2058A do not carry the signatures of an accretion origin inferred by Brown et al. (1997), C97, NS97, and K97. If the large Zmax and odd kinematics of BD +00°2058 are due to accretion, then the chemical evolution in this environment must have proceeded in a very similar fashion to that of the general Galactic metal‐poor field.
4.3. The High Lithium Abundance
Our Li abundance for BD +00°2058A, log N(Li) = 2.53, is significantly larger than the mean value (∼2.2) seen in other warm metal‐poor stars constituting the so‐called Spite plateau. Figure 7 of Lambert, Heath, & Edvardsson (1991) indicates that Li abundances this large are not seen until higher metallicities of [Fe/H]≳ - 0.5. The origin of the high Li abundance is relevant to ongoing debate about the Spite plateau. Is the large Li abundance of BD +00°2058 due to the extraordinary action of Galactic Li enrichment over and above a near‐primordial Spite plateau abundance, or has BD +00°2058 suffered less Li depletion than other Spite plateau stars from a higher primordial Li abundance?
One Li production mechanism is spallation reactions between cosmic rays and the ISM characterized by an isotopic ratio of 6Li/7Li∼1. For a factor of 2 Li enhancement above a primordial level (having no6Li); one thus expects a current isotopic ratio of 6Li/7Li∼0.25. Our conservative isotopic upper limit of ≲0.15 provides no evidence of spallation production of Li for this star. A second mechanism is the speculative ν‐process in supernovae (Woosley et al. 1990). Li production in this scenario should be accompanied by copious B production. Space‐based UV spectra of the λ2500 B i lines in BD +00°2058 could discern such B enrichment.
Another Galactic Li enrichment mechanism is the7Be transport mechanism (Cameron 1955), where7Be is produced in the deep interior of asymptotic branch (AGB) stars and quickly transported outward and converted to7Li via e− capture. In principle, this7Li can enrich the ISM through mass loss, or enrich the surface of a companion via mass transfer. Observational evidence of this process comes from Li‐rich AGB stars in the Small Magellanic Cloud (Smith & Lambert 1989). An important observation is that Li‐rich metal‐poor AGB stars also demonstrate n‐capture overabundances and large heavy‐to‐light s‐process abundance ratios. Could Li‐rich material from a metal‐poor AGB star have contaminated the photospheric material (directly or prior to formation) of BD +00°2058? Our n‐capture abundances are unremarkable for this star, as is the heavy‐to‐light (e.g., [Ba/Zr] = -0.27) ratio. The n‐capture abundances thus provide no evidence of Li production carrying an s‐process signature. However, as kindly pointed out to the author by D. Lambert, such a signature may not be observable if the contaminating material is super Li rich [log N(Li)≳4.0]. However, the metal‐poor SMC AGB stars are all Li rich [log N(Li)∼3], but not super Li rich; contaminating Li abundances this low should result in observable s‐process enhancements not seen.
The metal‐rich J‐type AGB star WZ Cas does demonstrate a superrich Li abundance [log N(Li)∼6; Denn, Luck, & Lambert 1991] but no s‐process enhancement. If a similar mechanism of Li production with no neutron source also operates in a metal‐poor context, this could explain the Li abundance of BD +00°2058A. Another intriguing possibility is Li production in pre‐AGB first‐ascent giants. A number of field K giants are observed to be Li rich. That most of these objects are inferred to have circumstellar shells from far‐IR photometry has led de la Reza, Drake, & da Silva (1996) to propose this is a short‐lived but normal phase of evolution of low‐mass giants in which7Li is produced via the7Be transport process acting via "cool bottom processing" (Wasserburg, Boothroyd, & Sackmann 1995). If true, observational signatures of other abundance alterations in low‐mass giants (C→N, Ne→Na, Mg→Al) may be relevant.
Interestingly, such abundance signatures may exist in BD +00°2058A, although more observational work is needed to confirm these. First, our value of [C/Fe] = -0.09 ± 0.04 is some 0.3–0.4 dex below the metal‐poor C i–based abundances presented by Tomkin et al. (1995) and Reynolds et al. (1992). An uncertainty in a claimed C deficiency is the poorly understood ∼0.3 dex systematic difference between C i– and CH‐based C abundances in metal‐poor stars (e.g., Wheeler, Sneden, & Truran 1989); the latter are typically in agreement with our value for BD +00°2058A. Second, our estimate of [Na/Fe] = +0.21 ± 0.15 is larger than values derived in some studies of metal‐poor stars. Unfortunately, homogeneous analyses of numerous stars with metallicities higher and lower than our value for BD +00°2058A are lacking, and comparison of extant work suggests study‐to‐study differences and/or significant intrinsic scatter in metal‐poor Na abundances, which complicates interpretation of our result. Additional complications are that the line strength of our weak Na feature is uncertain, and the other feature has a very large solar equivalent width. A determination from the λλ5682, 5688 lines would be welcome.
Finally, we noted that our [Mg/Fe] ratio may be ∼0.15 dex below similarly metal‐poor stars; however, the presence of intrinsic scatter in metal‐poor [Mg/Fe], and possible study‐to‐study differences cloud the reality of this modest difference. Regardless, the C, Na, and Mg results seem to form a consistent picture of material having undergone mixing on the red giant branch. If true, then contamination of the BD +00°2058A photosphere with Li‐rich material produced in an evolved star having undergone cool bottom processing would be a promising means to explain the Li abundance of BD +00°2058A. Of course, the "action" of both Li enrichment and in situ mixing/Li destruction is also possible.
4.4. Systematic Errors
Reanalysis of our data motivated by discussion with J. Laird concerning his unpublished analyses of BD +00°2058A reveal that the detailed accuracy of our adopted gf‐values may be an important source of systematic error in our derived parameters and abundances. As an example, we repeated the parameter analysis using the critical compilation of Fe i gf‐values from Lambert et al. (1996, hereafter LHLD). The mean difference in the log gf values for the 22 Fe i lines in common (in the sense LHLD, this work) is −0.011 ± 0.013 dex (s.d. of 0.058 dex).
This excellent on average agreement seems satisfactory, but the detailed dependences on excitation potential are such that, for the lines in common, employing the LHLD gf‐values instead of our values yields estimated Teff values some 110 K lower than values from our gf‐values. As a result, the spectroscopic log g estimate would be 0.25 dex lower. Most of the difference seems to be attributable to differences in gf‐values for moderate excitation lines (∼2.5 eV). Such a difference between the OB91 and BKK gf‐values (used here) and the Oxford results (heavily relied upon by LHLD) has been noted before. As emphasized by K98, subsets of lines or the detailed dependence(s) of gf differences can significantly influence derived parameters and abundances of metal‐poor stars despite overall agreement between different sources of gf‐values.
Since it is unclear which, if either, choice of oscillator strengths is correct, we have simply preferred a "sole‐source vendor" (or nearly so) of Fe i gf‐values here. How would the present results differ if, e.g., LHLD's critical gf‐values were employed? The derived [Fe/H] would be −1.23, which is in closer agreement with C94's estimate for BD +00°2058B (−1.27) but still discrepant with previous estimates for BD +00°2058A itself. The Li abundance would be lowered by 0.1 dex, and its discrepancy becomes more marginal—especially considering its (now) subgiant status. As can be judged from Table 2, the [C/Fe] and [Na/Fe] ratios do not change appreciably, and thus would remain odd. The other abundance ratios change by only a few hundredths of a dex and would remain unremarkable.
Given the revised parameters, the isochrones in the left and right panels of Figure 4 suggest ages of 11 and 15–16 Gyr, and the star would be evolved just past the turnoff. A revised luminosity of MV = 3.58 is found, and this gives an estimated distance of 203 pc. The resulting kinematics are U = +130, V = -123, and W = -307 km s−1. The large W and Vsp (355 km s−1) are indicative of a halo classification. These kinematics are much less remarkable in the V‐[m/H] distributions of C96's Figure 5.
5. SUMMARY
Two metal‐poor, late‐type common proper motion systems are believed to be accreted objects based on their kinematics and odd abundance ratios (C97; K97). In order to investigate whether metal‐poor wide pairs in the Galactic field might have an accreted origin, we have derived abundances of numerous elements in BD +00°2058A, a metal‐poor common proper motion pair member. Using spectroscopically derived Teff (6130 K) and log g (4.19) estimates, we find [Fe/H] = -1.16 ± 0.07 (total mean error); this value is a factor of 2–4 larger than previous, but indirect, measures. However, our Fe abundance is in good agreement with the C94 estimate of [m/H] = -1.27 for the cooler wide companion. The α‐element, Fe‐peak, and n‐capture abundances are all unremarkable compared with other field stars of similar [Fe/H]; there is no chemical evidence to identify BD +00°2058A as an accreted system.
The Li abundance of log N(Li) = 2.53 is some 0.2–0.3 dex larger than otherwise similar stars. The normal n‐capture abundances and our upper limit (≲0.15) on the6Li/7Li ratio provide no evidence for Li enrichment in this star via a7Be mechanism operating in metal‐poor AGB stars or via spallation reactions.
We find the [C/Fe] and [Na/Fe] to be a factor of ∼2 lower and higher (respectively) than values in otherwise similar stars. This striking pattern might be consistent with that expected in material having undergone "cool bottom processing." Such processing has been proposed as the source of Li‐rich field K giants. The radial velocities of C94 provide no evidence of a companion which may have contaminated BD +00°2058A with Li‐rich, C‐poor, Na‐rich material.
Comparison of theoretical isochrones and our parameters gives a distance of 151 ± 31 pc for BD +00°2058A. This is in better agreement with the wide companion distance estimates from C94 and Ryan & Norris (1991). The resulting V velocity (−78 km s−1) and three‐dimensional orbital eccentricity (∼0.40–0.45) seem consistent with thick disk characteristics, but the space velocity and W velocity are consistent with a halo classification.
We draw attention to the importance of different, but reasonable, choices of Fe i gf‐values in our analysis. Despite overall excellent agreement for the lines in common, replacing our gf‐values with the critical oscillator strengths of LHLD reduces the Teff by 110 K and the gravity by 0.25 dex. The α‐element, Fe‐peak, and n‐capture abundance ratios remain unremarkable in this case, and the [C/Fe] and [Na/Fe] ratios remain anomalous. The Li abundance becomes less discrepant—perhaps marginally so—with respect to otherwise similar stars. The inferred distance of 203 pc results in kinematics indicative of a halo classification.
It is with both pleasure and sadness that the author remembers the capable professional assistance of the late Mike Marcario, McDonald Observatory telescope operator, in obtaining the observations presented here.
Footnotes
- 1
IRAF is distributed by National Optical Astronomy Observatories, which are operated by the Association of Universities for Research in Astronomy, Inc., under contract to the National Science Foundation.
- 2
The Yale Isochrones are provided by P. Demarque, B. Chaboyer, D. Guenther, M Pinsonneault, L. Pinsonneault, & S. Yi, 1996, Yale Isochrones 1996 in Sukyoung Yi's WWW Homepage (see http://www.astro.yale.edu/demarque/astronomy.html).