
ABSTRACT
A long‐exposure short‐wavelength IUE spectrum of the hydrogen‐deficient carbon (HdC) star HD 182040 does not show any detectable emission in the C ii λ1335 line. It is not certain whether this absence of emission is intrinsic or due to the large uncertainties in the distance, absolute luminosity, and reddening toward HD 182040. If intrinsic, this absence of emission along with the absence of an IR excess from circumstellar dust imply that little or no mass loss is occurring at present from this star even though it is very similar spectroscopically to the R Coronae Borealis (RCB) stars. This result also suggests that the emission‐line gas and the circumstellar dust may result from the same mass‐loss mechanism in the RCB stars.
Export citation and abstract BibTeX RIS
1. INTRODUCTION
The cool hydrogen‐deficient carbon stars were characterized as a class by Bidelman (1953). The strong carbon and weak hydrogen lines in the spectrum of R Coronae Borealis had been pointed out previously by several authors (Ludendorff 1906; Berman 1935; Herbig 1949). Most of the known hydrogen‐deficient carbon stars are R Coronae Borealis (RCB) stars. These stars are easily detected owing to their spectacular brightness variations caused by circumstellar dust formation. About 35 RCB stars are known in our Galaxy and about 15 in the LMC (Clayton 1996; Alcock et al. 1999). There are also five stars in the Galaxy including HD 182040 that are identical to the RCB stars spectroscopically but do not show large brightness variations (Warner 1967). These stars (hereafter HdC) are much harder to detect since a spectrum of 2 Å resolution is needed to identify them (Drilling 1986). Warner (1967) estimates that the actual number of HdC stars may be 10 times as many as the RCB stars. The HdC and the RCB stars typically have effective temperatures of 5000–7000 K (Lawson & Kilkenny 1996).
From an observational point of view, a cool RCB star can be identified as having all of the following characteristics (Clayton 1996). The stellar spectrum looks like an F or G supergiant with anomalously strong carbon and weak or absent hydrogen absorption features. All RCB stars are variable at maximum light, typically with periods of 40–100 days and amplitudes of a few tenths of a magnitude (Lawson, Rao, & Giridhar 1990). These variations are due to pulsations (Lawson & Cottrell 1997). Deep declines of up to 8 mag in the visible occur without warning at irregular intervals. The star spends most of its time at maximum light with declines occurring every few years. As the star fades at the onset of a decline, a rich emission‐line spectrum always appears, consisting of singly ionized and neutral metals (see, e.g., Alexander et al. 1972). This narrow‐line spectrum fades after a couple of weeks leaving a few broad emission lines, notably, Ca ii H and K, Na i D, and Mg ii h and k. All RCB stars have a near‐IR excess owing to circumstellar dust (Feast et al. 1997). Many are also detected at IRAS wavelengths (Walker 1985, 1986).
Abundance analyses of the RCB and HdC stars show that they have similar chemical compositions (Warner 1967; Lambert 1986). The absolute luminosities of the RCB stars have been estimated from those that are LMC members (Feast 1972; Alcock et al. 1996, 1999). Most of the RCB stars in the LMC have MV = -4 to −5. Hipparcos gave lower limits to the distances and hence absolute luminosities of the Galactic RCB stars (Cottrell & Lawson 1998; Trimble & Kundu 1997). These limits imply that the RCB stars must be brighter than MV = -3. There are no HdC stars known in the LMC, so there is no direct measurement of their absolute luminosities. However, the Galactic HdC stars were observed with Hipparcos, and the results are consistent with those of the RCB stars (Cottrell & Lawson 1998). Also, as summarized by Eaton et al. (1985), various spectroscopic indicators imply that the HdC star HD 182040 is a high‐luminosity star. HD 182040 has the very low abundance of13C typical of RCB stars (Maron 1979). Recent results from Hipparcos imply the velocity dispersion of the RCB and HdC stars are quite similar to each other and to the extreme Helium (eHe) stars, which implies that they may be mostly bulge populations (Cottrell & Lawson 1998). However, the number of stars is small, and there may be selection effects (Lawson et al. 1990; Lawson & Cottrell 1990).
All of the RCB and HdC stars appear to be pulsational variables. There is a wide range of both brightness and radial velocity amplitudes (Kilkenny, Marang, & Menzies 1988; Lawson et al. 1990; Lawson & Cottrell 1997). For the RCB stars, the typical amplitudes are 10–20 km s−1 and 0.2–0.3 mag. With the exception of HD 175893, the HdC stars have lower pulsation amplitudes than the RCB stars (Lawson & Cottrell 1997). Among the HdC stars in the near‐IR, only HD 175893 seems to show a slight excess in the L band (Feast et al. 1997). In the IRAS data, four of the five HdC stars were detected in the 12 μm band. Only HD 175893 and 173409 show a small excess over normal stars (Walker 1985, 1986). None of the HdC stars were detected in the other IRAS bands. Recent ISO measurements confirm that HD 175893 has a far‐IR excess (Lawson et al. 1999).
The HdC and RCB stars seem to be very similar with the exception that the HdC stars undergo little or no mass loss. As mentioned above, all RCB stars show an emission‐line spectrum that is typically visible only during declines when the stellar photosphere has been eclipsed. However, in the UV, where the cool star photosphere is relatively faint, at least one emission line, C ii λ1335, can be seen even at maximum light, which indicates that the emission‐line region is always present (Clayton 1996; Holm & Wu 1982; Holm et al. 1987). Since the HdC stars have no declines, an observation of the C ii line is an opportunity to see whether an emission‐line region is present around these stars. To this end, HD 182040 was observed with the International Ultraviolet Explorer (IUE).
2. OBSERVATIONS AND ANALYSIS
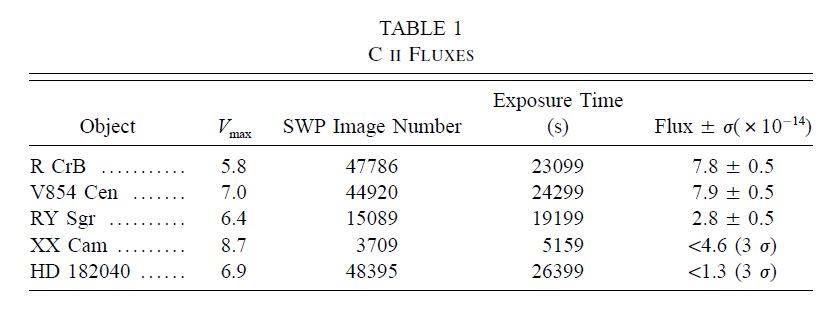
A deep short‐wavelength spectrum of HD 182040 was obtained with IUE on 1993 August 17. The spectrum was obtained with the large aperture at low dispersion. The SWP spectrum is plotted in Figure 1 along with SWP spectra of the RCB stars V854 Cen, XX Cam, R CrB, and RY Sgr. These spectra have been reprocessed and the emission‐line strengths measured using the TOMSIPS package (Ayres et al. 1995). The SWP images used and integrated fluxes in C ii measured in ergs cm−2 s−1 are summarized in Table 1. The C ii λ1335 line is present in emission in the spectra of R CrB, RY Sgr, and V854 Cen. No line is visible in the XX Cam spectrum, but it is a very short exposure compared to those of the other stars. This feature is noticeably absent from HD 182040. The C ii flux measured here for RY Sgr agrees well with the flux measured from a STIS spectrum obtained recently with Hubble Space Telescope (Clayton et al. 1999).
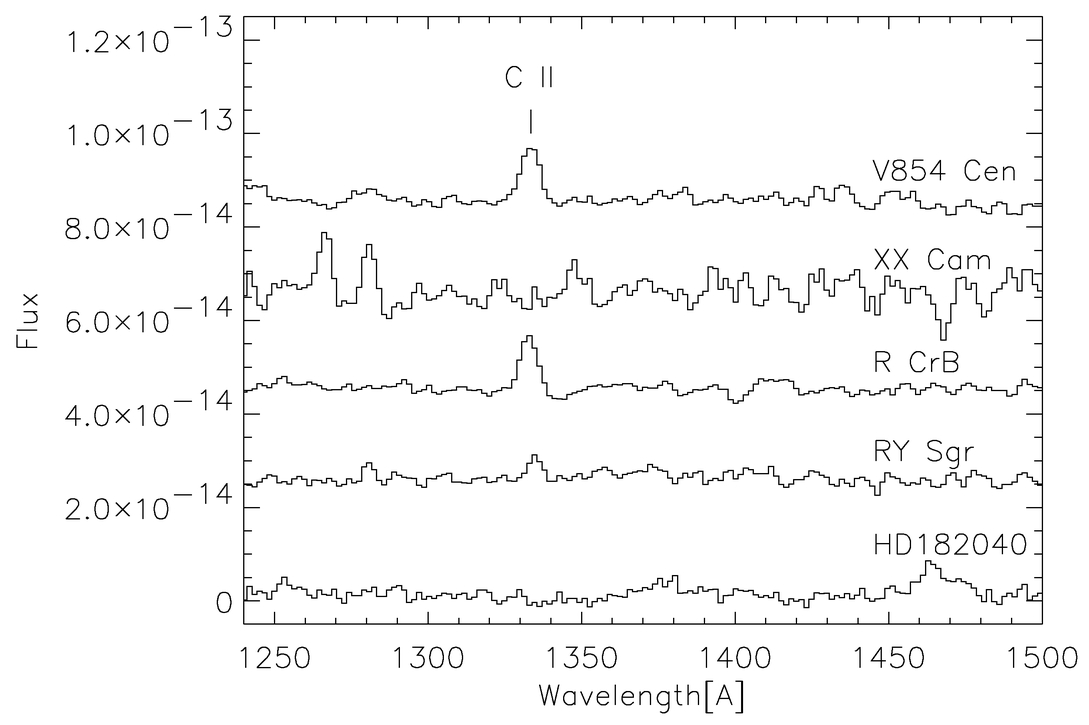
Fig. 1.— IUE SWP spectra of V854 Cen, XX Cam, R CrB, RY Sgr, and HD 182040. The fluxes are given in ergs cm−2 s−1 Å−1. The spectra of RY Sgr, R CrB, XX Cam, and V854 Cen have been shifted upward by 2, 4, 6, and 8 × 10- 14 ergs cm−2 s−1Å−1, respectively. The apparent features in the XX Cam spectrum are due to the lower S/N in this observation.
 |
Several low‐dispersion IUE LWR spectra of HD 182040 show no evidence for emission lines (Eaton et al. 1985). A high‐dispersion LWR spectrum also shows no emission features that can be unambiguously identified (Johnson, Ameen, & Eaton 1984). There is a very weak blueshifted absorption seen in Mg ii λ2800 that could be due to absorption in a wind.
In order to compare the C ii fluxes for the individual stars, we would need to calculate the absolute fluxes. This has not been done since the distances, luminosities, and reddenings are not well known. The reddenings are not well known because the intrinsic colors, effective temperatures, and circumstellar reddenings of the RCB stars are not certain particularly because they vary as the stars pulsate. For instance, the reddening of RY Sgr has been reported as 0.0, 0.13, and 0.31 (Lawson et al. 1990; Asplund et al. 1997; Goldsmith et al. 1990). Estimates of the effective temperature are only good to about 500 K, which leads to an uncertainty in E(B − V) of 0.1. The reddening toward HD 182040 has been reported as 0.05 and 0.23 (Asplund et al. 1997; Lawson et al. 1990).
3. DISCUSSION
The location, genesis, and energy source for the RCB star emission‐line regions are not well understood. At maximum light, the visible‐light stellar continuum swamps the emission spectrum, but in the UV, where the stellar continuum is much fainter, emission at C ii λ1335 has been detected at maximum light in R CrB, RY Sgr, and V854 Cen (Holm & Wu 1982; Holm et al. 1987; Clayton 1996; Clayton et al. 1999). Rao, Nandy, & Bappu (1981) report that emission is visible at Mg ii in a very noisy high‐resolution spectrum of R CrB at maximum. No emission is seen at Mg ii in RY Sgr in a much higher S/N spectrum (Clayton et al. 1994). Lambert et al. (1990) have found Sc ii emission filling in the core of a photospheric line in R CrB at maximum. So emission from circumstellar gas, typically seen only during declines, is present at all times in the spectra of RCB stars.
It is believed that the RCB star dust forms locally in a patch or puff not as a complete shell (Feast 1986; Clayton 1996). The dust will accelerate quickly away from the star owing to radiation pressure. If the dust has a net charge, then the gas will be pulled along with the dust as it moves. At any given time, there may be a number of puffs arranged around the star so emission could be coming from gas associated with these puffs without any dust being in front of the star to cause a decline. In a decline, most of the emission lines quickly fade as the gas is eclipsed by the expanding dust cloud, so large parts of the emission‐line region are close to the star and behind the new dust cloud. Clayton et al. (1992) find the emission measure loci of Mg ii, Si ii, and C ii] are consistent only for electron densities near 2 × 1010 cm−3, and the emitting regions might have characteristic electron temperatures near 6000 K. These temperatures are typical of the line‐forming regions of red giants (Judge 1986). Also, the presence of C ii λ1335 and C iii] λ1909 and the He i lines indicates that a higher temperature emitting region must exist.
Strong evidence for a physical connection between the RCB star and the condensing dust comes from the correlation between pulsational phase and the time of decline onset found for RY Sgr and V854 Cen (Pugach 1977; Lawson et al. 1992). There does not seem to be a simple relationship between pulsation phase and decline onset in R CrB itself (see, e.g., Fernie & Seager 1994). Another possible connection with dust formation and pulsations is seen in band strength variations of C2 and CN, which are correlated with pulsational phase in R CrB and RY Sgr (Lloyd Evans 1986; Clayton et al. 1995).
The absence of emission from HD 182040 could be intrinsic or could be due to a combination of reddening and the low sensitivity of the IUE data. If intrinsic, it indicates that the emission‐line gas is also missing from the HdC stars. This would make sense if the gas producing the emission was just part of the mass loss from the RCB star from which the dust condenses. Lawson & Cottrell (1997) suggest that the pulsation amplitude is the deciding factor in whether significant mass loss occurs from these stars. Dust formation may take place in nonequilibrium conditions associated with shocks in the atmospheres of RCB stars (Clayton 1996; Woitke, Goeres, & Sedlmayr 1996). The HdC stars show smaller amplitudes than the RCB stars, so perhaps the conditions for condensation of gas into dust do not occur. HD 182040 shows variations of ΔV∼0.05 and ΔRV∼1.7 km s−1 (Kilkenny et al. 1988; Lawson & Cottrell 1997). The one exception, HD 175893, is the only HdC star to show an IR excess. However, at least one RCB star, V854 Cen, is very active yet has very a very small radial velocity amplitude (Lawson et al. 1992).
Some RCB stars are very inactive. XX Cam has had only one decline in this century and was not detected by IRAS (Yuin 1948; Walker 1986). Its radial velocity has not been measured, but it shows brightness changes of ±0.1 mag (Lawson et al. 1990; Weiss, Fried, & Olson 1996). Unfortunately, no deep UV spectrum exists for this star, so the presence or absence of its emission‐line region is unknown. It may be better classified as an HdC star. The brightness variations of R CrB and RY Sgr have been monitored for over a century (Mattei, Waagen, & Foster 1991, 1994). These stars go through periods of activity and inactivity lasting 10 yr or more. Since we do not have observations of these stars on longer timescales, it is quite possible that periods of inactivity may occur which last considerably longer.
If the HdC stars are inactive RCB stars, then the absence of C ii emission in HD 182040 implies that the emitting gas is part of the same mass‐loss mechanism that also results in dust formation. Also, the range of fluxes seen in our small sample of stars may indicate that the intrinsic strength of the emission varies from star to star, possibly correlated with the amount of mass loss. It is also possible that the HdC stars are RCB stars that do not pulsate strongly enough for significant mass loss to occur.
We would like to thank Warrick Lawson for helpful comments on this paper. This work is supported by NASA grant NAG5‐3338.