

ABSTRACT
We present near‐infrared (1.85–2.47 μm) and optical (4300–5800 Å) spectroscopic observations of the polar ST Leonis Minoris (ST LMi) in an extreme low state. The near‐infrared spectrum, showing no emission lines whatsoever, is produced solely by the secondary star. We have fitted the spectrum with a series of stellar atmosphere models and found the secondary star to have a temperature of 2800 ± 200 K. Six months later, ST LMi was reobserved in the near‐infrared, at which time mass transfer had resumed, and the system was in a high state.
Export citation and abstract BibTeX RIS
1. INTRODUCTION
As part of a program to study and understand the evolution of the secondary stars in cataclysmic variables (e.g., Ciardi et al. 1998; Howell, Hauschildt, & Dhillon 1998; Howell, Rappaport, & Politano 1997; Harrop‐Allin et al. 1997; Dhillon et al. 1996; Dhillon & Marsh 1995), we spectroscopically observed the polar ST Leonis Minoris (ST LMi, Porb = 113.9 min, V = 15–17 mag; Downes, Webbink, & Shara 1997). Polars are a subclass of cataclysmic variables where the primary white dwarf possesses a strong magnetic field (B>10 MG) which prevents the formation of an accretion disk. Instead, the infalling material impacts the surface of the white dwarf directly (Cropper 1990). Polars experience variations in mass transfer rates which lead to luminosity changes of 3–5 mag in the optical, referred to as high and low states. In a high state, the near‐infrared (NIR) and optical emission of the polar is dominated by the accretion material in the form of strong emission lines and cyclotron radiation (e.g., Warner 1995). In typical low states, the accretion material emission, although present, is reduced significantly in intensity, at which time the secondary generally is observable (e.g., Warner 1995). Polars, without the confusion of a large ∼10,000 K accretion disk, provide a unique environment to study the stellar components as well as the accretion stream within cataclysmic variables (e.g., Ciardi et al. 1998).
We present NIR and optical spectra of ST LMi which indicate that the system was observed during a near‐zero accretion state. We have used the observations to identify the secondary star and directly associate a temperature with the star. In addition, NIR spectra obtained 6 months later show that the system had resumed mass transfer. In § 2, we discuss the NIR and optical observations. In § 3, we discuss the identification of the secondary star, and the contribution of the secondary star to the NIR while the system is in a high state.
2. OBSERVATIONS
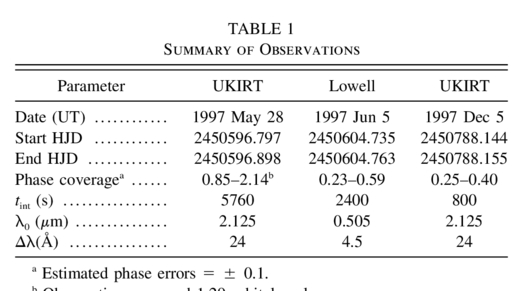
K‐band spectroscopy of ST LMi from the 3.8 m United Kingdom Infrared Telescope (UKIRT) was obtained in 1997 May and in 1997 December. The May data were acquired via the UK Panel for the Allocation of Telescope Time (PATT) time allocation, while the December data were obtained via service time observations. In addition, optical spectroscopy was performed at the 1.8 m Perkins Telescope of the Ohio Wesleyan and Ohio State Universities at Lowell Observatory in 1997 June. A summary of the observations is given in Table 1; all reported orbital phases have been determined from the ephemeris of Cropper (1986).
 |
The NIR spectroscopy was acquired with the UKIRT Cooled Grating Spectrometer 4 (CGS4) equipped with a 256 × 256 InSb array. The May observations utilized a 75 line mm−1 grating, a 150 mm focal length, and a 1  22 slit width. The December observations utilized a 40 line mm−1 grating, a 300 mm focal length, and a 1 22 slit width. To optimize the spectral sampling and improve the spectral resolution, the detector array was mechanically shifted by two pixels in half‐pixel steps in the dispersion direction (e.g., Harrop‐Allin et al. 1997). The May data have been smoothed to the resolution of the December data to facilitate a direct comparison between the two spectra; thus, both spectra have a resolution of ∼350 km s−1. Sky subtraction was performed by nodding the telescope between two positions on the sky separated by ∼20
''. Flat fields and argon arc lamps were observed just prior to the target observations. Telluric line removal was performed in the standard way of observing a main‐sequence star at a similar air mass as the target, masking out the stellar features of the main‐sequence star spectrum, and by dividing the target spectra by the spectrum of the main‐sequence star: BS 4412 (F7 V, 1997 May) and BS 4254 (A8 V, 1997 December) (e.g., Dhillon et al. 1996; Harrop‐Allin et al. 1997). These same main‐sequence stars were used to flux calibrate the data.
22 slit width. The December observations utilized a 40 line mm−1 grating, a 300 mm focal length, and a 1 22 slit width. To optimize the spectral sampling and improve the spectral resolution, the detector array was mechanically shifted by two pixels in half‐pixel steps in the dispersion direction (e.g., Harrop‐Allin et al. 1997). The May data have been smoothed to the resolution of the December data to facilitate a direct comparison between the two spectra; thus, both spectra have a resolution of ∼350 km s−1. Sky subtraction was performed by nodding the telescope between two positions on the sky separated by ∼20
''. Flat fields and argon arc lamps were observed just prior to the target observations. Telluric line removal was performed in the standard way of observing a main‐sequence star at a similar air mass as the target, masking out the stellar features of the main‐sequence star spectrum, and by dividing the target spectra by the spectrum of the main‐sequence star: BS 4412 (F7 V, 1997 May) and BS 4254 (A8 V, 1997 December) (e.g., Dhillon et al. 1996; Harrop‐Allin et al. 1997). These same main‐sequence stars were used to flux calibrate the data.
Optical spectroscopy of ST LMi was obtained with the OSU CCD spectrograph covering the spectral region between 4300 and 5800 Å at a dispersion of 2 Å per pixel. When combined with a 2 '' wide‐entrance slit, the spectra yielded a spectral resolution of 4.5 Å. Spectra of the standard star Feige 34 were used to correct the ST LMi spectra for instrumental response. Although absolute spectrophotometry was not attempted, we have used Feige 34 to flux calibrate the data, under the assumption that the slit losses for both ST LMi and Feige 34 were the same.
3. DISCUSSION
In Figure 1 the 1997 May NIR spectrum is shown, and it is clear that ST LMi displayed no visible signs of emission lines. Using the optical guidestar camera at UKIRT, we took care to ensure that we indeed were observing the correct system. In the optical, there are only ∼12 stars within a 2 5 radius of ST LMi, and only ∼4 stars within a 1
' radius. In addition, ST LMi is the brightest optical source within a 25 radius. Finally, the 2.2 μm spectrum displays CO absorption features which are rotationally broadened with respect to the same features in single late main‐sequence stars (see Fig. 1 and Dhillon 1998). We are confident that we indeed observed the correct system and that the observations indicate that ST LMi was in an extreme low state with a near‐zero accretion rate.
5 radius of ST LMi, and only ∼4 stars within a 1
' radius. In addition, ST LMi is the brightest optical source within a 25 radius. Finally, the 2.2 μm spectrum displays CO absorption features which are rotationally broadened with respect to the same features in single late main‐sequence stars (see Fig. 1 and Dhillon 1998). We are confident that we indeed observed the correct system and that the observations indicate that ST LMi was in an extreme low state with a near‐zero accretion rate.
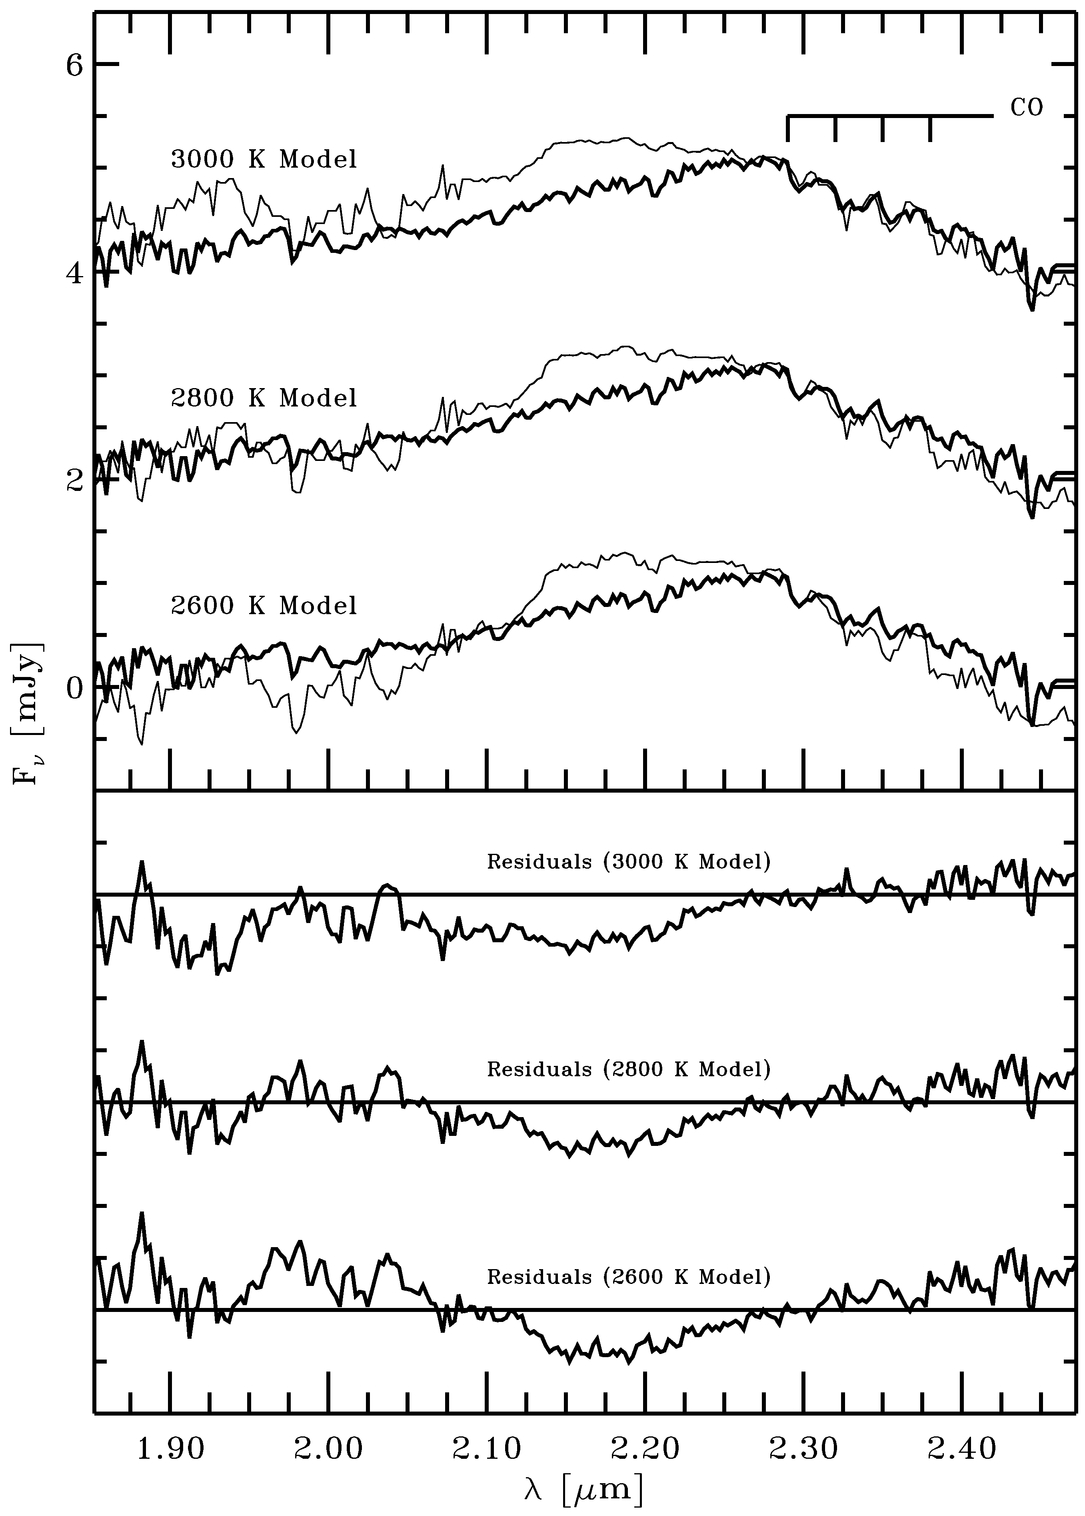
Fig. 1.— 1997 May NIR spectrum (thick lines) is shown, along with the 2600 K, 2800 K, and 3000 K stellar atmosphere models (thin lines). Note the strong presence of the broad H2O water absorption features which produce the downturn in the continuum shortward and longward of 2.3 μm. Each model is scaled to the data at 2.27 μm. Data plotted with the 2800 K model represent the actual measured flux level. The other spectra have been shifted for clarity in the plot. The residuals for each of the fits also are shown; horizontal lines represent zero.
The continuum shape of the May NIR spectrum is dominated completely by the H2O opacity features from the secondary star (note the downturns in the flux on either side of 2.3 μm). In addition, the CO bandheads at 2.29, 2.32, 2.35, and 2.38 μm are clearly visible (Fig. 1). These features are only ∼8% below the level of the continuum and are normally filled in by emission due to accretion processes and not visible in NIR spectra during a high state (e.g., Ferrario, Bailey, & Wickramashinghe 1993). Assuming that the flux in the 1997 May NIR spectrum is produced solely by the secondary star, we have fitted the data with a series of red star models in order to determine the temperature. The red dwarf models are LTE model atmospheres with solar abundances (Ciardi et al. 1998; Allard & Hauschildt 1998). Normal main‐sequence stars have surface gravities of log g ≈ 4.5; we have attempted to compensate for the effect of rapid rotation (∼120 km s−1) by reducing the surface gravity to log g = 3.5 (Howell, Hauschildt, & Dhillon 1998; Ciardi et al. 1998). Based upon the χ2 test, we find a temperature range of 2800 ± 200 K best fits the data. In Figure 1, the 2600, 2800, and 3000 K models are plotted with the data, along with their corresponding residuals. The 2700 and 2900 K models were indistinguishable, in a χ2 sense, from the 2800 K model. Except for the excess emission near 2.2 μm (likely a result of incomplete H2O opacities in the red star models; Leggett et al. 1996), the 2800 K model does a remarkable job in reproducing the observed spectrum.
The main‐sequence spectral type for a Teff = 2800 K star is ∼M6 V (Leggett et al. 1996) which agrees with that predicted from the empirical orbital period–spectral type relationship derived from the work of Patterson (1984) and Sproats, Howell, & Mason (1996). The 2.2 μm flux corresponds to a magnitude of K = 14 mag which is 0.3 mag fainter than the K magnitude of ST LMi during the faint phase of a high state (Bailey et al. 1985). At a distance of 128 pc (Cropper 1990), the secondary star has an absolute magnitude of MK = 8.5 mag, in good agreement with absolute magnitudes expected for late‐M type stars (Leggett et al. 1996).
The optical spectrum (Fig. 2), obtained 1 week after the NIR spectrum, shows Hβ and Hγ white dwarf absorption features with extremely weak emission cores, indicating that accretion had resumed but that the system was still very much in a low state. During a high state, ST LMi possesses strong optical and NIR H emission lines which are 5–10 times the strength of the continuum level (Bailey et al. 1985). Extending the 2800 K model to the optical (Fig. 2) and assuming that the optical spectrum was properly corrected for slit losses, we find that the secondary star contributes only ∼15% of the flux, yielding an apparent visual magnitude for the secondary star of V ≈ 20 mag and an absolute visual magnitude of MV ≈ 14 mag. A color index of V - K ≈ 6 mag is in agreement with the colors expected for an M6 main‐sequence star (Leggett et al. 1996).
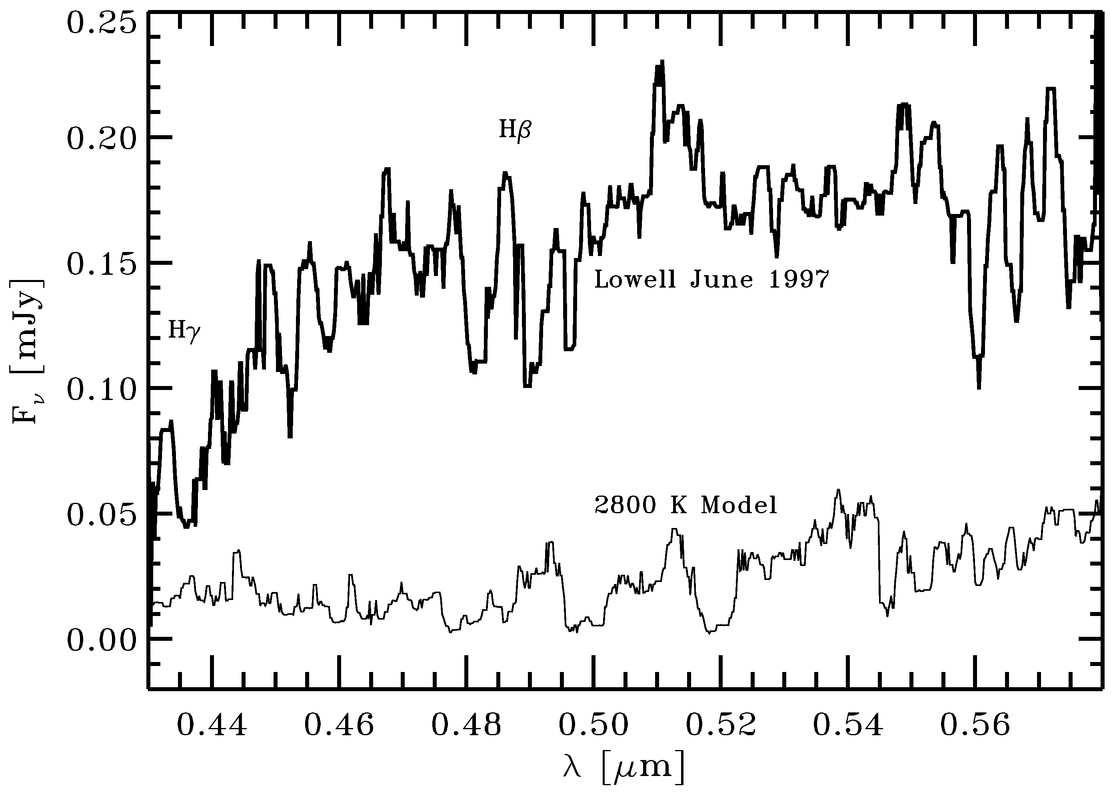
Fig. 2.— 1997 June optical spectrum is shown (thick line) with the Hβ and Hγ absorption features with emission cores labeled. The 2800 K red star model (thin line; Fig. 1), extended into the optical, is also shown. The secondary star contributes only ∼15% of the flux (see text). For ease of comparison, the data have been smoothed to a resolution of 24 Å to match the resolution of the NIR observations and the stellar atmosphere model.
Via UKIRT service time, we obtained a second 2.2 μm spectrum of ST LMi in 1997 December (Fig. 3). The strong H emission lines and the presence of the He i2.06 μm line indicate that the accretion in ST LMi had resumed and that the system was now in a high state. The spectrum was obtained during the faint phase of the orbit (see Table 1); i.e., the primary accretion pole was hidden behind the limb of the white dwarf (Ferrario, Bailey, & Wickramashinghe 1993). In the bottom half of Figure 3, the difference between the December and May spectra is shown, and it demonstrates that, aside from the emission lines, the continuum emission of the secondary star represents 80%–85% of the NIR flux during the faint phase of the orbit. However, the slit losses for each of the spectra are unknown and not necessarily equal, and, thus, the estimated secondary star contribution represents an upper limit to the true contribution. The shape of the continuum after the removal of the secondary star is not quite flat, but this simply may be the result of incomplete telluric subtraction.
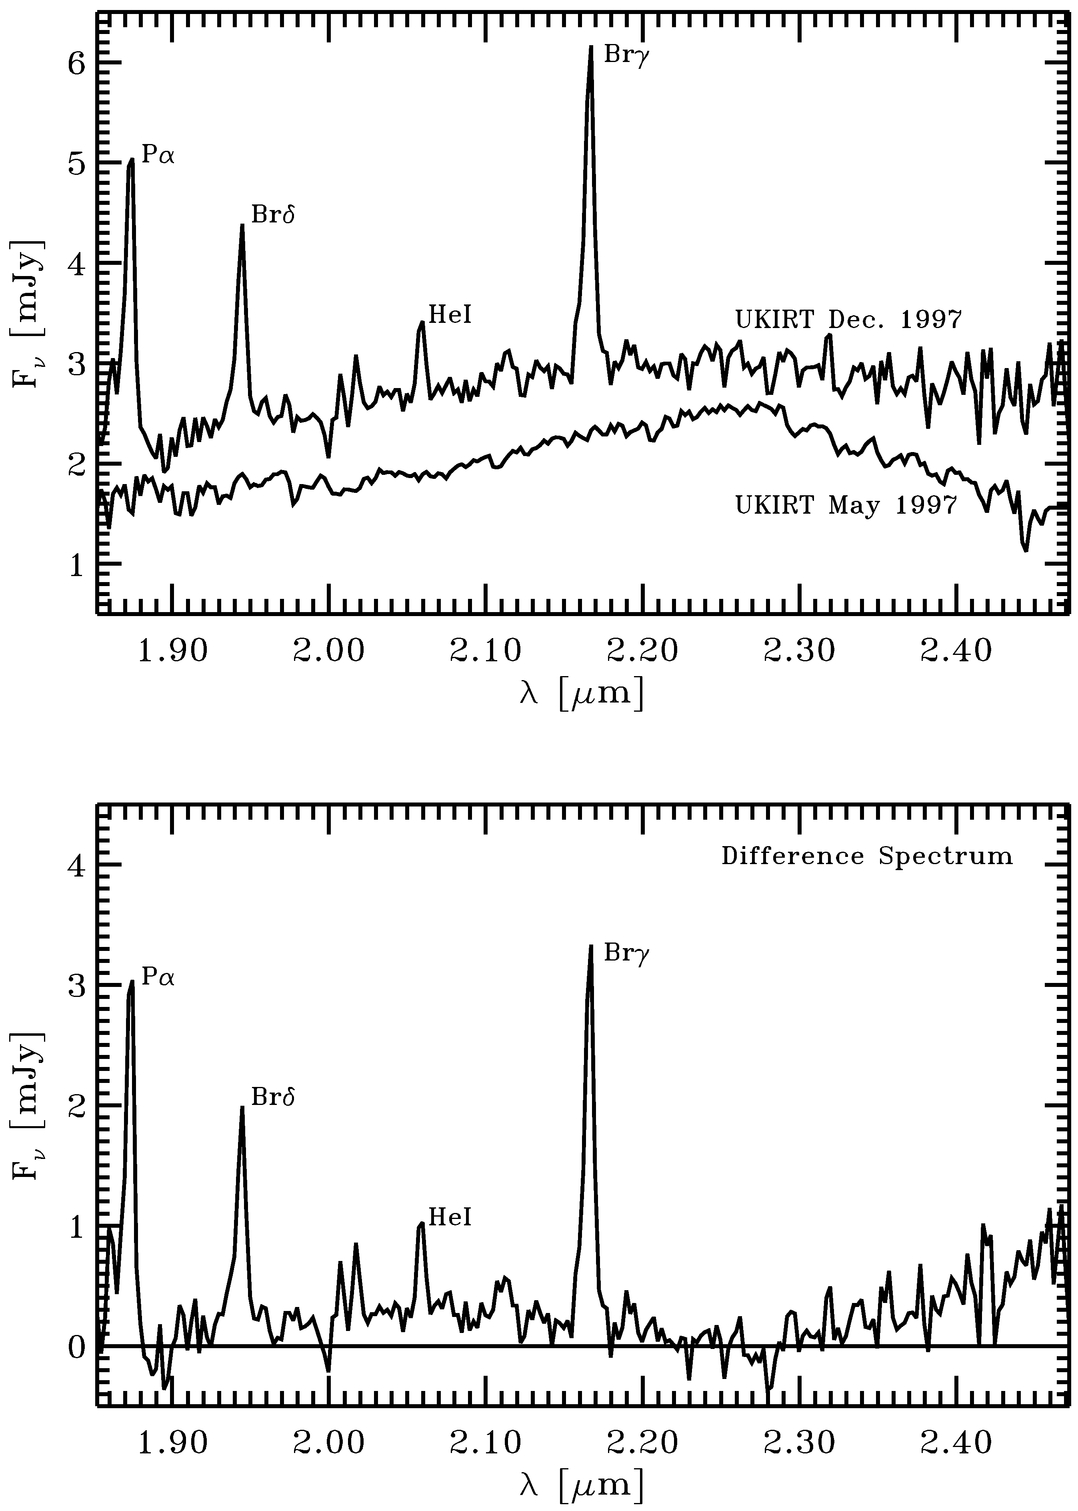
Fig. 3.— 1997 December and 1997 May (Fig. 1) NIR spectra are shown (top). The May spectrum has been shifted down by 0.5 mJy for clarity. The emission lines of Pα, Brδ, He i, and Brγ have been identified. The difference spectrum (December data − May data) is shown in the bottom plot.
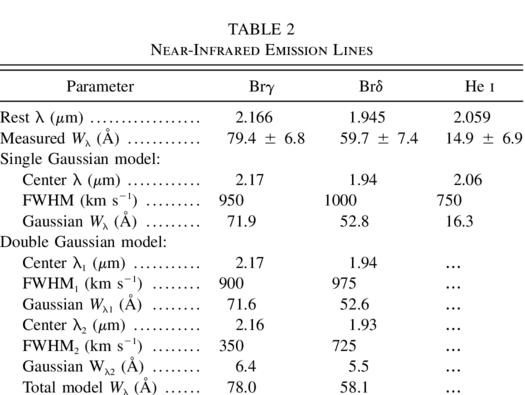
In the 1997 December spectrum Pα (1.875 μm), Brδ (1.945 μm), He i (2.059 μm), and Brγ (2.166 μm) are all clearly visible (Fig 3). In Table 2, we report the equivalent widths of each of these lines except for Pα, which is deep in "telluric land" and a reliable measurement is not possible. In Figure 4, the Brackett emission lines are redisplayed with the continuum normalized to unity. Both lines show a narrow blue component, distinct from the main line. Using both a single‐component and a double‐component Gaussian model, we have modeled the H emission lines (Fig. 4), the results of which are summarized in Table 2. For both Brγ and Brδ, the double‐component model produced a fit 50% better (rms) than the single‐component model. He i showed no evidence for two components and was fitted only with a single Gaussian. The narrow blue components in Brγ and Brδ have velocities of approximately 1200 km s−1 away from the center of the main line. The broad emission lines centered at the rest wavelengths are likely from a symmetric halo‐like region surrounding the accretion region(s) (e.g, Ciardi et al. 1998), while the narrow blue components are from the accretion stream itself (e.g., Howell et al. 1997). In both emission lines, the blue component comprises ∼10% of the total (broad+narrow) line flux.
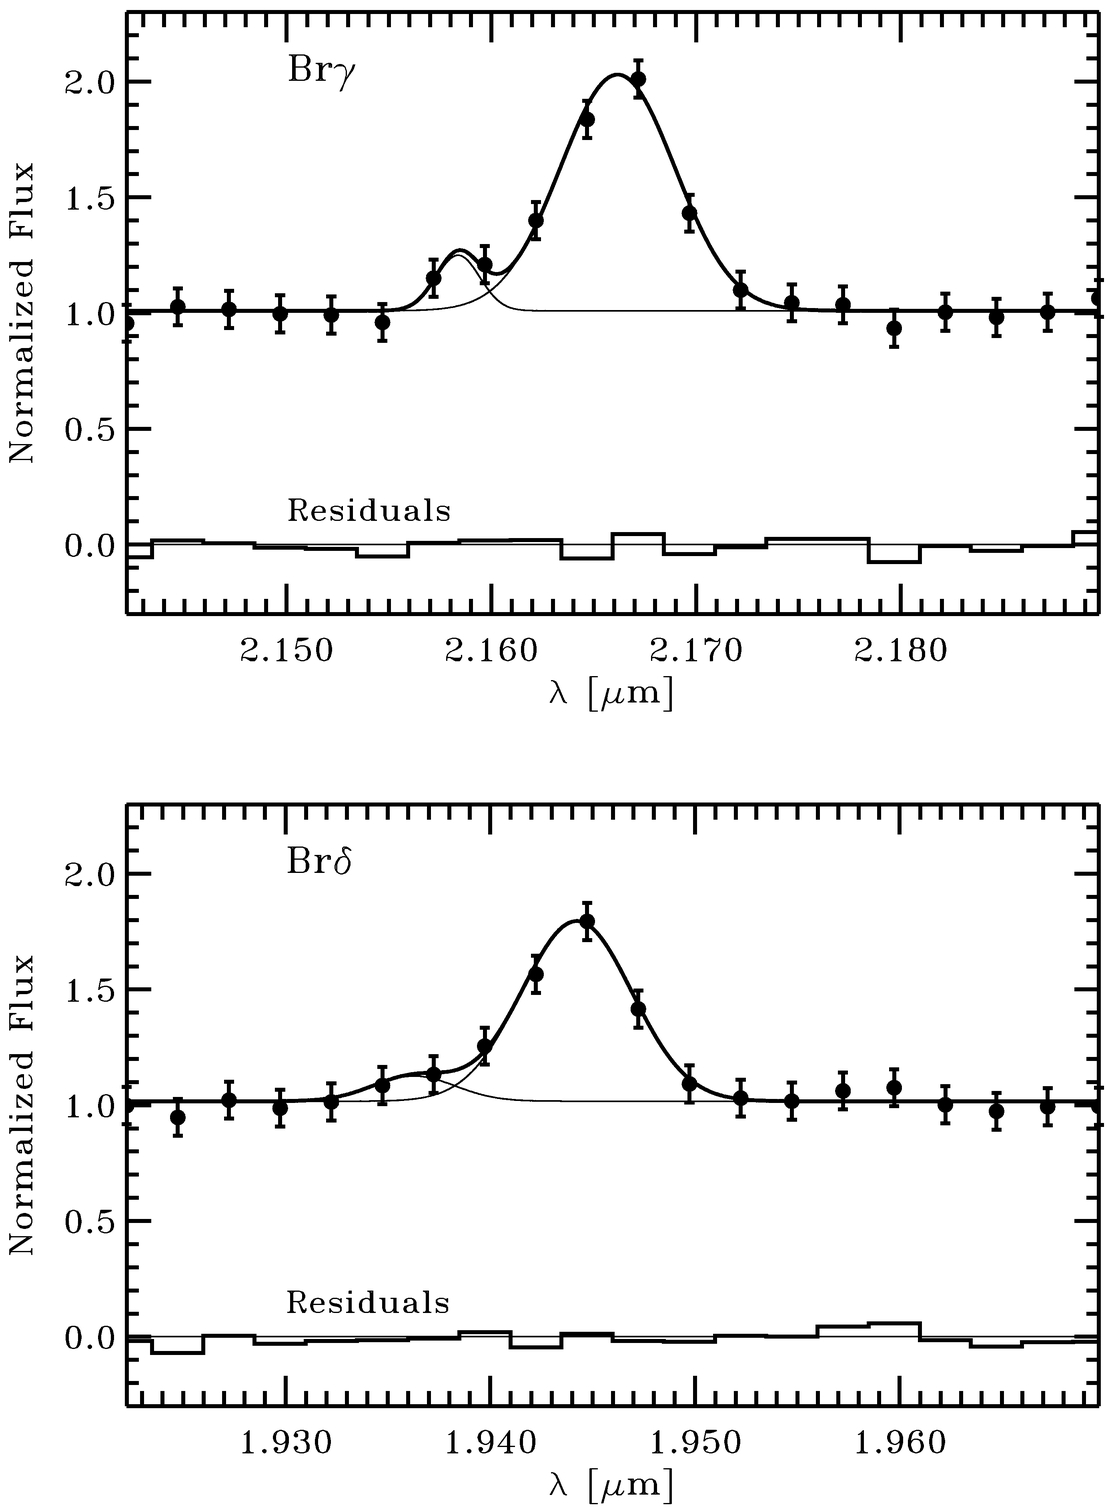
Fig. 4.— Emission lines of Brγ (top) and Brδ (bottom) from the 1997 December spectrum (Fig. 3) are shown with the continuum normalized to unity. Filled circles (•) are the data; thin lines are the two‐component Gaussian fits (see Table 2 and text); the thick line is the summation of the two Gaussians. The residuals from each of the models are shown; horizontal lines represent zero.
 |
4. CONCLUSIONS
We have observed the polar ST LMi in an extreme low state. NIR and optical spectra indicate that the mass transfer rate was near zero. We have used the NIR spectrum to model the secondary star and have found it to possess a temperature of 2800 ± 200 K. Six months later, ST LMi was reobserved and found to be in a high state. The emission lines at 2.2 μm display two components which have been identified with emission from the accretion stream (narrow blue component) and a symmetric halo‐like region (broad component). Finally, in an upcoming paper, we will explore the phase‐dependent variation of the low‐state spectra of ST LMi, as well as any observed variations of the temperature of the secondary star.
The authors would like to thank the staff at the Joint Astronomy Centre and at the United Kingdom Infrared Telescope for all their courteous support. D. R. C. would particularly like to thank Dr. S. Leggett for patiently answering all his data reduction questions. The United Kingdom Infrared Telescope is operated by the Joint Astronomy Centre on behalf of the UK Particle Physics and Astronomy Research Council. Some of the data reported here were obtained as part of the UKIRT Service Programme. Finally, the authors would like the thank the anonymous referee whose comments made this a better paper. P. H. H. was supported, in part, by NASA ATP grant NAG 5‐3018 and LTSA grant NAG 5‐3619 to the University of Georgia. Some of the calculations presented in this paper were performed on the parallel supercomputers of the UGA UCNS, at the San Diego Supercomputer Center (SDSC), the Cornell Theory Center (CTC), and at the National Center for Supercomputing Applications (NSCA), with support from the National Science Foundation.