
ABSTRACT
The Gravity Probe B (GP‐B) satellite photometric system and instrumentation are introduced. Observational results are presented for calibration stars demonstrating a single‐orbit relative photometric precision capability of 500 μmag for bright stars. Broadband photometric observations of the bright star ζ Pegasi are then presented that display brightness variability of 488.2 ± 6.6 μmag (parts per million), with a period of 22.952 ± 0.804 hr (f ≈ 1.04566 cycles day−1). Over the short observational period, the variation is monosinusoidal, thus recommending the star for membership in the class of small‐amplitude, slowly pulsating B (SPB) star variables oscillating in a nonradial g‐mode.
Export citation and abstract BibTeX RIS
1. INTRODUCTION
During the course of the Gravity Probe B (GP‐B) mission (Buchman et al. 2000), the star ζ Peg was observed for a total of 27 hr. The opportunity to observe the star was the by‐product of science gyroscope torque calibrations at the end of the science mission. The scheduling of repeated observing periods was incompatible with the mission plan.
Hipparcos performed photometry of stars brighter than 8th magnitude (i.e., those in the solar neighborhood). It observed 118,218 objects, some with a precision of 0.2 (6) mmag for a 5th (9th) magnitude star (van Leeuwen et al. 1997). For ζ Peg, the precision was no better than 2 mmag and frequently degraded considerably from that level. Hipparcos observations are consistent with constant brightness to its level of precision.
After averaging for a few hours, the Hubble Space Telescope (HST) fine guidance sensor capability for photometric precision is typically <500 ppm (500 μmag, or 0.5 mmag), and at best 50 ppm (0.05 mmag), for stars in the 9th to 11th magnitude brightness range (Zwintz et al. 2000).
The photometric precision level that we report for GP‐B is not unprecedented for a space‐based observatory. What is new is that such precise observations have not been made for the bright B star ζ Peg, a star that is used widely as a spectrophotometric standard by ground‐based observatories.
First, we compare the observations of another B8 IV star, GSC 07393‐00128 (HD 168922; mV = 9.8), which has somewhat similar characteristics. It was studied by Zwintz et al. (2000) and was found to display a frequency of 1.05551 cycles day−1 (period of 22.74 hr) over a period of several years. This variation was noted to be similar to that found in δ Sct variables, which is normally confined to spectral type A stars. Although the δ Sct variables have similar variational amplitudes, their periods are only one‐tenth that of ζ Peg. That places ζ Peg outside the range defined for the class, and also outside the spectral class recognized for δ Sct variables.
The slowly pulsating B (SPB) stars (Waelkens 1991) have periods of between about 1 and 3 days and range over class types B3–B8, and are therefore more appropriate to ζ Peg. Typically, they are multiperiodic and have low rotational velocities (vsin i∼20 km s−1), unlike ζ Peg. Recently, a few rapidly rotating candidates have been identified by Aerts et al. (1999) in the Hipparcos database. These span the spectral range B2 to B9. The existence of another variable class characterized by similar spectral class and variability period leads to the conclusion that ζ Peg is an example of a micromagnitude, slowly pulsating B‐type variable. Zwintz et al.'s comment that VGS 15 is like a δ Sct variable, but with a B‐type spectrum, demonstrates the distinction between the two classes. The SPB class of variables is also distinct from the β Cep variables, which are radial and nonradial pulsators of early B spectral class and O9 to B3 (Stankov & Handler 2005).
2. OBSERVATIONS
A diagram of the GP‐B telescope is shown in Figure 1. The telescope design and performance are discussed by Buchman et al. (2000) and Wang et al. (1998). It contains an image divider assembly (IDA) and a pair of detector package assemblies (DPAs), one each for the X‐ and Y‐axes. There is a pair of bicells in each DPA, along with a beam splitter that creates redundant channels. The functionality of the IDA is shown in Figure 2. Unfortunately, the optical channels created by the IDA are not identical, leading to the need for numerical weighting factors for the conversion from individual detector electron current to photon rate.
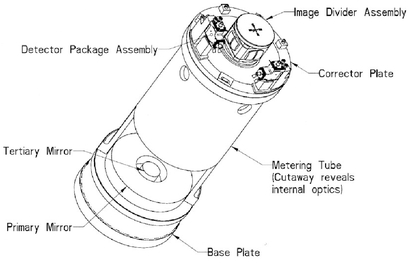
Fig. 1.— General view of the GP‐B telescope. Light enters at top right.
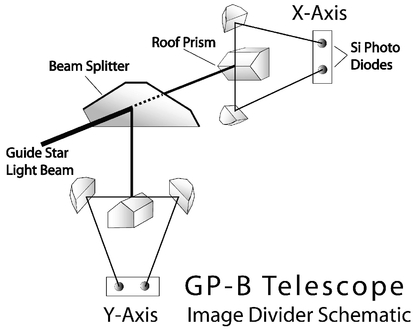
Fig. 2.— Schematic diagram of the image divider optical assembly. Not shown are the redundant X‐ and Y‐axis channels.
The GP‐B photometer consists of eight silicon diode detectors arranged in bicell pairs, with full redundancy, for the purpose of guide star tracking. That is, there are eight independently amplified detectors, with each quartet being redundant. Each bicell pair measures the light from half the field of view (FOV). The FOV is divided by knife‐edges (roof‐top mirrors) that are arranged orthogonally. This quadrant arrangement provides signals to the guidance system that are sensitive to deviations of the spacecraft body from fixed X‐ and Y‐coordinates. The detector modules are described in Demroff et al. (1998).
The GP‐B quadrant tracking system is similar, conceptually, to the HST fine guidance system (Kallinger et al. 2005), but with a 4 times slower readout rate. The software package is derived from HST. The HST data are corrected for proton hits in the South Atlantic Anomaly (SAA) by modeling the SAA flux and then subtracting from the observations. The slower readout rate for GP‐B does not permit an accurate use of the HST SAA correction model.
In order to understand the photometry method, a brief exposition of the telescope pointing system is necessary. The differential pointing design cancels the photocurrent from a pair of detectors, within the limits of design and manufacture. Thus, a companion star that is in the FOV and is displaced significantly beyond the diffraction disk of the main guide star will contribute a signal that is small compared with its relative brightness. A star well beyond the primary star's diffraction disk will produce a decreasingly small signal until it nears the perimeter of the FOV. In the case of ζ Peg, the companion star is at the FOV's perimeter. The rate at which the companion signal decreases with angle at the edge of the FOV is about 5 times slower at the knife‐edge in the FOV's center, where the main guide star image division takes place. The defocus of the FOV edge results from the displacement of the field stop plane from that of the knife‐edge. At the FOV edge, the decline is equivalent to 200 mas per unit normalized pointing, compared with about 800 mas per unit normalized pointing at the FOV center. This verbal description of the normalized pointing function can be visualized as the derivative of the transmission curves in Figure 3. Figure 4 displays the relative response of each optical channel derived from observations of ζ Peg.
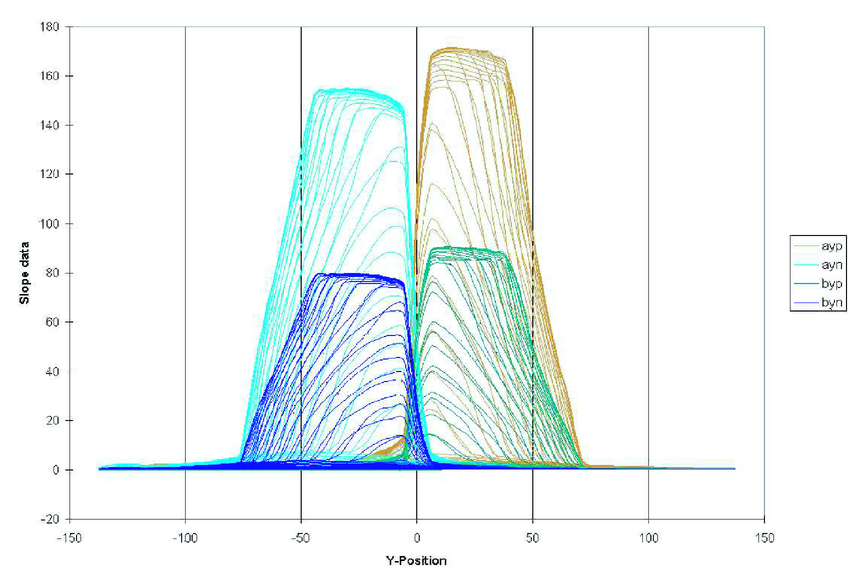
Fig. 3.— Y‐detector response scans from artificial star III and telescope III data X‐raster of the AS III spot. Sets of lines for a given detector result from stepping in the X‐position dimension.
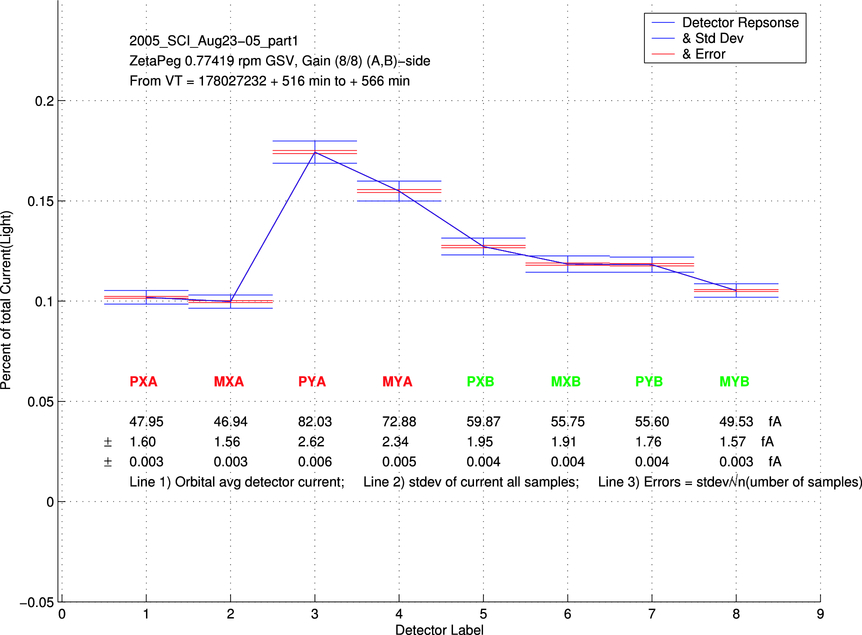
Fig. 4.— Distribution of light on each of the eight detectors during flight‐guiding operations. Nominally, the star, ζ Peg, is centered on the KEIDA (knife‐edge image divider assebly). Inner error bars are for precision, and outer error bars are for 1 σ. VT stands for elapsed vehicle time in 1/10th seconds from mission start.
Each silicon diode detector is sampled at a data rate of 10 Hz. All eight detectors are sampled simultaneously, and the data are recorded to a spacecraft computer and then transmitted during a ground pass. Occasionally (on average less than 0.7% of the time outside the SAA), a sample is corrupted by a proton hit. Data‐grading routines remove the corrupted sample, replacing it with an average of the values for adjacent sample times. SAA time periods are regularly rejected entirely, because during quiet solar epochs, the proton hit rate approaches 100% of the samples. Conscious of the potential for a false 24 hr signal at some low level, we have examined data from the other program stars for evidence of a 24 hr period and found no such signal down to the noise level.
Instrumental and environmental effects on the data quality are handled by filtering out those time periods corresponding to low‐quality data. For photometric reasons, roughly 37% of the detector readings are compromised in one fashion or another and are discarded. Most notably, the first 15 minutes of a guide star valid (GSV) period can be corrupted by thermal instabilities of the DPA, and the last 5 minutes by irregularities in atmospheric emission.
Here an observation consists of the mean value of all points during a given GSV and the statistical accuracy (standard deviation normalized by the square root of the number of samples) with which that mean value is reported. Hence, one observation is made every orbit, at a rate of 14.8 per day. During the course of the science phase of the mission, about 6000 observations of guide stars were performed, almost all of the main guide star IM Peg. Any chosen guide star is observed in staring mode as continuously as possible. A GSV period is typically 55 minutes of a 97 minute orbital period. The guide star invalid (GSiV) period is the remaining time when the telescope is pointed at the Earth. Every day, three to five orbits are usually affected by the SAA and require data filtering or censoring.
During the science phase of the mission, only one star, IM Peg, was observed. During the initial orbital checkout and the guide star calibration phase, a few other stars were observed. These other stars are the topic of this discussion. One was the photometric comparison star HD 216635 (mV = 6.612, B - V = 0.992, K0). Observations of this star are used to place the GP‐B photometry on a magnitude scale. Stellar characteristics are given in Table 1. Data are from the SIMBAD database.
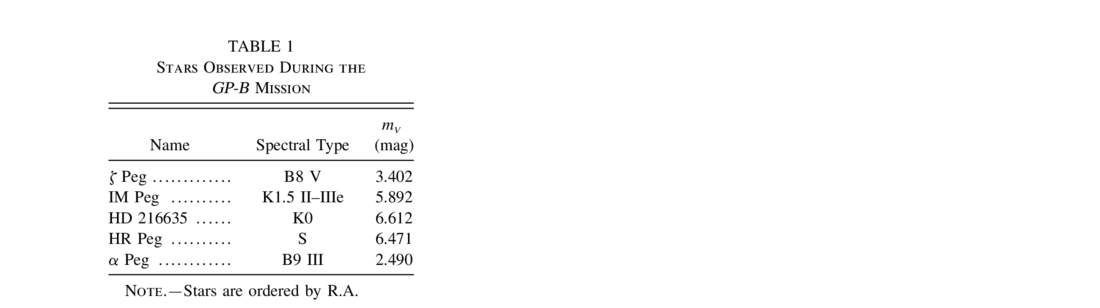 |
In the MK spectrophotometric system (Allen & Cox 2000), the color correction appropriate for HD 216635, which is of spectral type K0 V, is V - R = +0.64. Here the effective wavelength is approximately λGP‐B∼R. This color correction sets the accuracy limit of any quoted magnitude for GP‐B to about 10 mmag. Thus, we define the GP‐B standard HD 216635 to have a magnitude of 6.612 - 0.64 = 5.9720000000000 (zeros added to emphasize the definition). We recognize that a small offset in the GP‐B magnitude system remains unevaluated.
Eighty‐five observations of HD 216635 were made during the calibration portion of the mission. The observations are displayed in Figure 5 and summarized in Table 2. Note that the errors of the set of all observations (the standard deviation ΔmGP‐B) exceed those of any single observation by an order of magnitude. It has not yet been determined if there is any credible reason to doubt the brightness constancy of this star. There is no obvious pattern to the scatter in measured values, and there is no significant periodicity in the observation in the period range of 0.2 to 5 days (see Fig. 5). Furthermore, a frequency (Fourier) transform of that data reveals no periodicities.
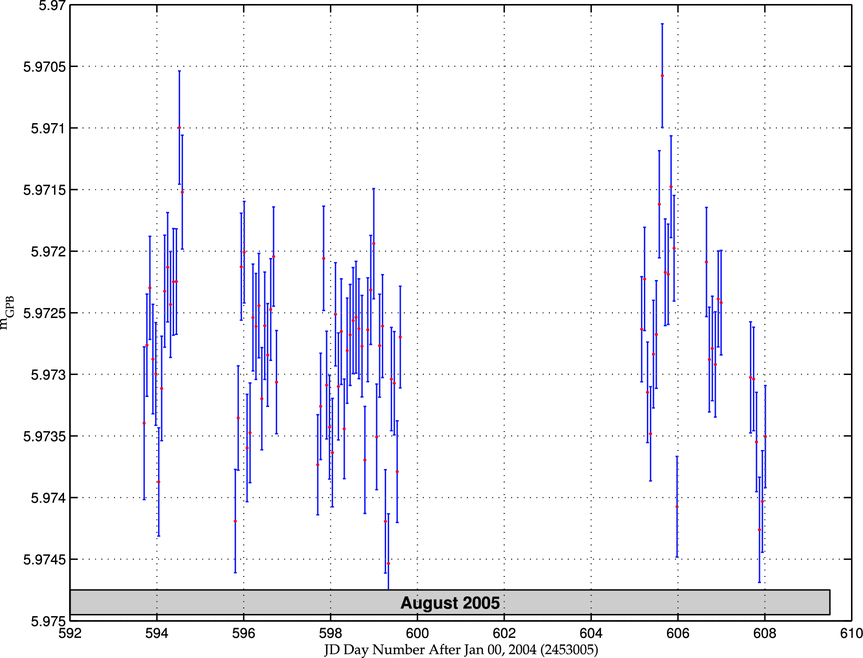
Fig. 5.— GP‐B main guide telescope observations of HD 216635. Each datum is for a single orbit. Gaps in time result from observing something else.
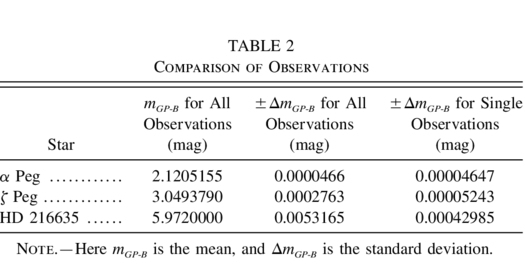 |
In Table 2, note that ± ΔmGP‐B is more than 10 times larger for the standard star than for ζ Peg. The noise sources present while making any measurement are the same; what is different is the brightness of the two stars. Electronic amplifier noise is significant for HD 216635 relative to the star brightness, resulting in a low signal‐to‐noise ratio (S/N). For ζ Peg, the S/N is higher. The same S/N issue is apparent in the results for α Peg, which is even brighter. For HD 216635, errors of the set of all observations are elevated above the errors of any single observation, which implies a source of low‐frequency instrumental drift (i.e., f- α noise). It does not greatly impair the instrumental performance, being a penalty of only 26%.
For α Peg, the standard deviation ΔmGP‐B of six observations shown in Figure 6 is 46.62 μmag, while that of all 2 s data points (1650) comprising any one observation is 46.47 μmag. So for a very bright star, there is no evidence of stellar variability or gross instability of the photometer on the timescale of 12 hr.
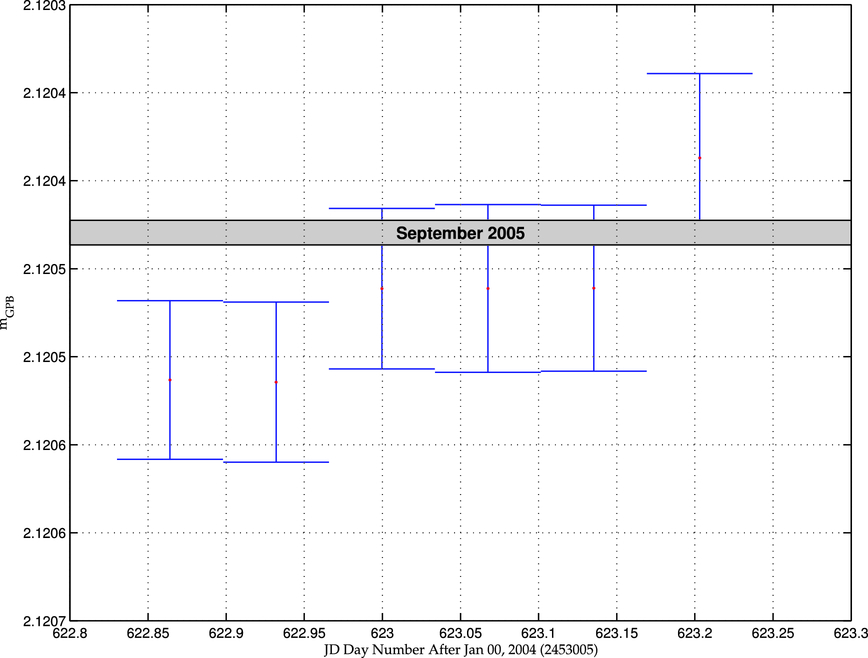
Fig. 6.— GP‐B main guide telescope observations of α Peg.
For ζ Peg, (B8 V, mV = 3.4; Hoffleit et al. 1982), 18 observations were made. Observations of ζ Peg also show elevated errors of the set of all observations compared with those of individual observations. Unlike HD 216635, ζ Peg displays a distinct pattern in Figure 7 that is even apparent in the data before averaging into an observation.
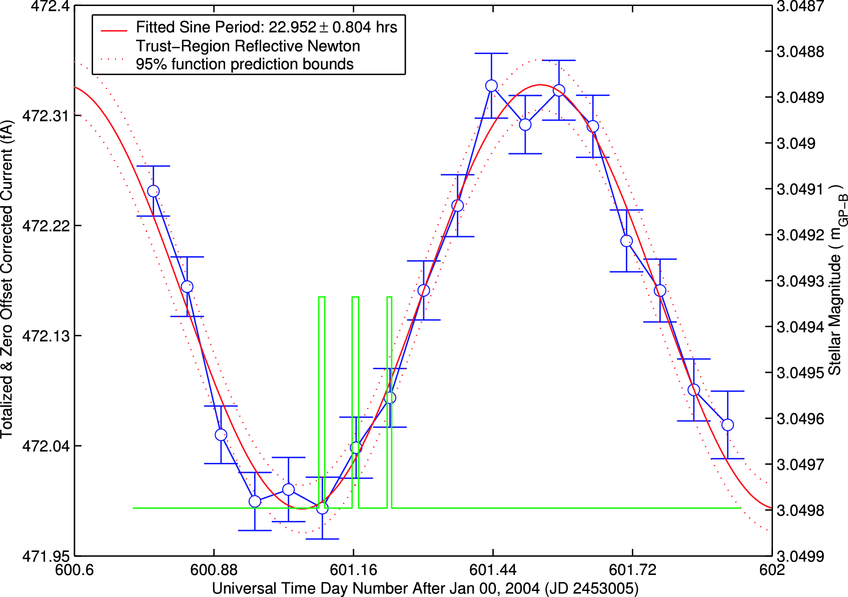
Fig. 7.— Comparison of the derived model with observations of ζ Peg. The dotted line forms the 95% confidence band. The line with three vertical bars identifies times of the most intense SAA passage.
From this comparison, it is seen that the errors (precision) of single and multiple observations decrease with increasing stellar brightness. There is a noise floor to the measurements, setting the detectability limit for a faint star. The limit is 8.4 mag fainter than HD 216635, or the equivalent of mGP‐B = 14.4 for a single observation.
The observations of ζ Peg are modeled with a single sinusoidal oscillation. The derived parameters of brightness mGP‐B, sinusoidal amplitude A0, period T, and Julian Date of phase zero JD(Φ0) are listed Table 3. Also listed are the derived 95% confidence intervals from the nonlinear least‐squares fit. Additional harmonics of this period were evaluated and found to be unjustified at the level of confidence demanded by the observations.
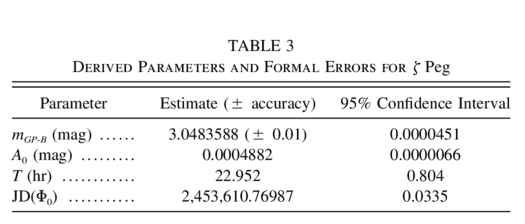 |
A comparison of the derived parameters and the observations is shown in Figure 7. The Julian Date is not corrected for heliocentricity, which introduces a correction of no more than 5.775 × 10⁻³ days (Budding 1993).
3. DISCUSSION
3.1. Sources of Variability
Zeta Peg is a double‐star system that is listed in the Washington Double Star Catalog (Hartkopf et al. 2001a, 2001b; Mason et al. 2001; Worley et al. 2001) and has a secondary or companion star that is 8.2 mag fainter than the primary, at the relative position of (68'', 139°) (Worley & Douglass 1997). Nominally, the guide telescope has an FOV = 60'' radius. This puts the secondary about two diffraction disks outside the nominal FOV, a bit too close to escape entanglement. From laboratory testing, the angular response at the FOV's perimeter declines slowly, starting at 40'' and decreasing somewhat linearly out to 75''. The perimeter rate is set by the field stop and is less than that at the center, where the full decline occurs in the span of 10'' (see Fig. 7). Consequently, a fraction of light from the companion is seen in the GP‐B observations and is estimated to include as much as 30% of the total light from the companion.
Evaluation of the possible confusion imposed by the companion hinges on two parameters. First is the component of detector signal at the spacecraft roll rate. This is the primary scientific sampling frequency, so the pointing system (attitude and translation control, ATC) was designed to eliminate or at worst minimize any telescope signal at that frequency (12.9 mHz). Because of the imbalances in the optical channels, modulation at the roll frequency could be expected to be of an order of 50% of the companion star intensity. Unfortunately, technical difficulties prevented the complete realization of the requirement that no pointing component at the roll frequency creep into the pointing and control system. No accurate measurement of the secondary star at roll frequency is possible. This is discussed here.
The ATC rate gyroscope, distinct from the science gyroscope, introduced a significant roll rate signal into the ATC subsystem. This had the undesirable side effect of introducing a roll component into the guide star telescope's detector signal. With the quadrant division of the FOV, one would expect to find a square wave modulation induced by the companion star crossing over the knife‐edge and at the period of roll in the totalized signal of all eight detectors. A 10 dB notch filter was introduced into the rate gyroscope signal line and was intended to block this false roll rate component from corrupting the guide star signals, but resulted in harmonics of roll frequency in the detector signals (and the motion of the spacecraft). For the science gyroscopes, this was an acceptable compromise. In spite of these efforts to remove the roll frequency from the guide star telescope signal, there is still an observable residual roll rate signal of sufficient magnitude to overwhelm any possible contribution by the companion star to ζ Peg's observations at roll frequency.
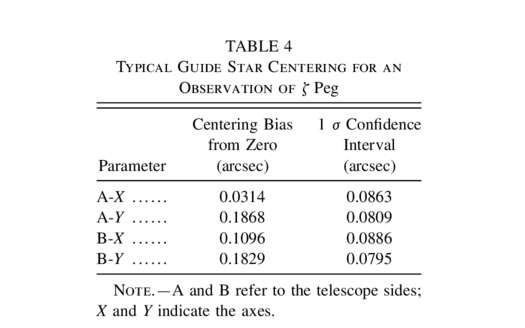
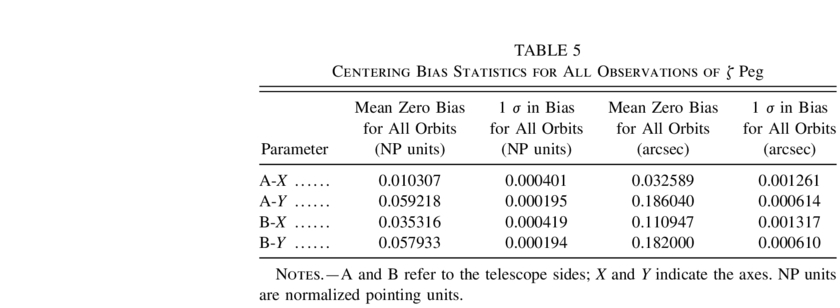
Second is the stability in the pointing position from observation to observation. The guide star tracking position centering bias and noise of the spacecraft at the observation epoch of ζ Peg was as good as at any other time during the mission. For a typical observation, the mean pointing position, or centering bias from numerical zero, relative to the FOV's center is shown in Table 4. A statistical summary of the set of all observations of ζ Peg is given in Table 5. A date of JD 2,453,606.3421348 is the average time of all ζ Peg observations.
 |
 |
For there to be an instrumental origin to ζ Peg's variation in brightness, the pointing position observations would have to demonstrate a monotonic angular time series progressing about the nominal pointing center, perhaps circularly; i.e., in proper sequence from one orbit to another, with the required period and amplitude. The time series of centering bias for the observations of ζ Peg remained stable and is shown in Figure 8. The excursions of the bias show no significant circular pattern in the pointing that is in excess of 1 mas. This is shown in Figure 9.
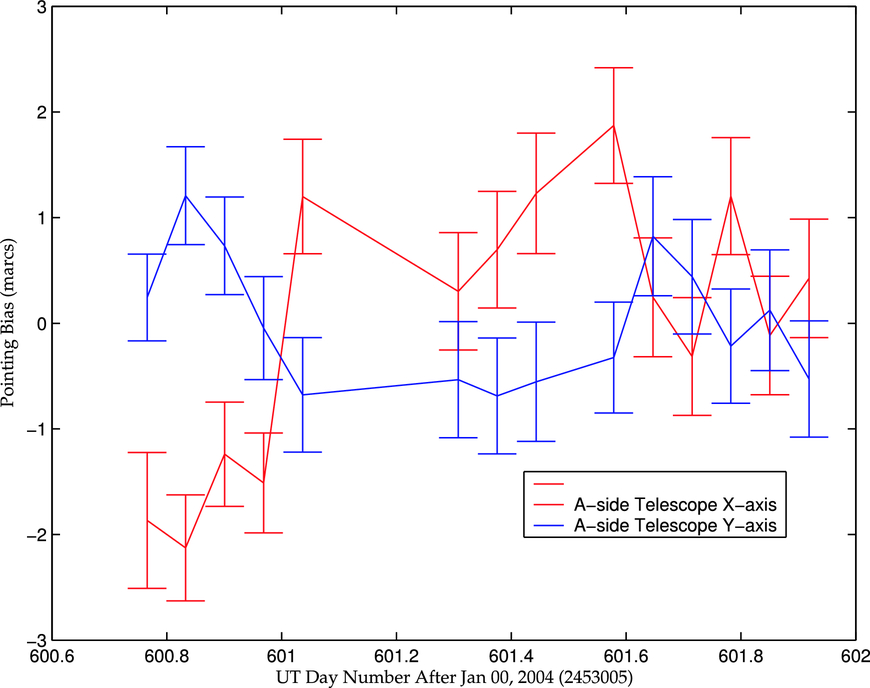
Fig. 8.— Mean GSV pointing bias from center (mas) during observations of ζ Peg (scale factor of π). One set of data is for the X‐axis, and the other for the Y‐axis, of the primary set of telescope detectors. Each datum is for an entire orbit, or observation.
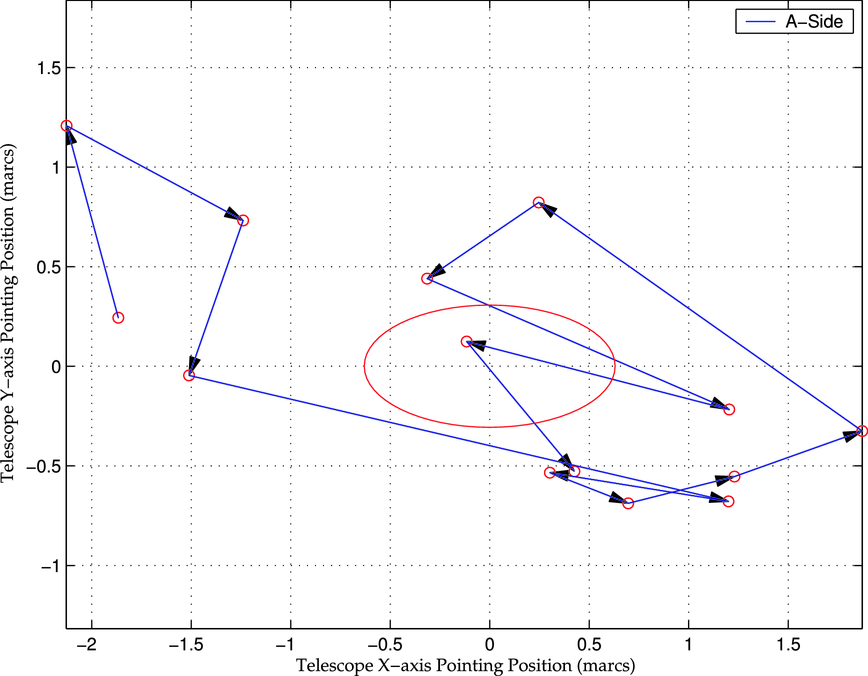
Fig. 9.— Relative pointing bias positions and sequence of excursions during observations of ζ Peg. Each point is an observation; the temporal sequence is indicated by arrows.
For any one of the detectors, typical signal modulation from displacement at the FOV edge is, in a relative sense, 100% per 30'', where 30'' is the angular region of declining response, which falls off approximately linearly (see Fig. 3). So the modulation is 3.3 × 10⁻³ percent per mas for the secondary star signal in that edge region. The companion brightness is 3.4 + 8.2 = 11.6 magV (Worley & Douglass 1997). For a perfectly balanced main guide star tracking signal, the secondary modulation would be 6.2 magV per mas equivalent. Relative to the main guide star, this is a modulation of 9.6 magV, which is comparable to the stellar brightness difference of 8.2 magV. In contrast, if the companion were the intrinsic source of variation, its amplitude would be −0.6 magV, and it would need to have a period of 22.9 hr. This is comparable to the observed the total emission modulation of 488 μmagV at 3.6 magV, which is equivalent to a secondary of 11.9 magV. Thus, at the mas pointing stability level, the secondary is bright enough to account for the modulated signal of ζ Peg. However, the pointing is somewhat more stable than 1 mas, being at the 0.1 mas level. This makes a stellar equivalent variation of 14.1 magV, taking the secondary contribution out of the realm of probability. To be sure, more information needs to be collected on the secondary. Later on, this will be seen to transfer the problem of intrinsic primary variation, which can easily be accounted for by the primary, to that of the secondary, which is shown here to be a more problematic proposition.
An evaluation of extraneous factors that potentially include a 24 hr signal yielded negative results. These included extravehicular exhaust plumes, scattered light from the Earth, Sun, and Moon, particle hits during SAA passage, and electronic sensitivity to the rotating Earth's magnetic field. These are fully discussed in an internal GP‐B document.
Hence, we conclude that the origin of the micromagnitude variability that is seen in the ζ Peg data is intrinsic to the star.
3.2. Classification of Variability Type
One possible source of stellar variability is starspots, which are known to produce a sinusoidal oscillation in the brightness (Sterken & Jaschek 1996) if the size, position, and darkness (brightness) parameters meet certain conditions. Based on current thinking, B‐type stars are not suspected of harboring starspots. This possibility cannot be eliminated by the present observations alone. If we are observing the fundamental rotational period of a cooler region, a substantial portion of the star's surface would be required for a sinusoidal light curve. Some SPB stars have been modeled with spots using spectral line profile variations (Briquet et al. 2004). Since ζ Peg is used as a spectrophotometric standard and the photometric variations reported here are relatively small, some more careful spectrophotometric analysis may be required. The stars of Briquet et al. (2004) have comparatively large variations.
With vsin i = 191 km s−1, ζ Peg is a faster rotator than most of the well‐known SPB stars (Aerts et al. 1999; De Cat & Aerts 2002). The brightness amplitude is much smaller than for slowly rotating SPB stars detected from the ground (De Cat & Aerts 2002), so the anticorrelation suggests SPB behavior paralleling that of δ Sct variables. The faster the rotation, the lower the brightness amplitude. Townsend (2003) stated that for δ Sct class stars, "g modes are excited, but that equatorial confinement by the Coriolis force may push their photometric signatures below typical observational detection thresholds." Here we present observations consistent with that hypothesis for the SPB class.
In the H‐R diagram, ζ Peg lies just above the Hyades zero‐age main sequence (ZAMS) line, indicating a slight degree of evolution off the main sequence. The observed low‐amplitude g‐mode oscillation is consistent with the current understanding of stellar evolution, and with observations of other SPB stars. The B − V color implies an age of about 2.1 × 10⁹ yr. For the location of the SPB variables in the H‐R diagram relative to other variable classes, see Kurtz (2006), from whom it is appropriate to quote:
- "There are three places in Fig. 11 [pulsational H‐R diagram] where there are p‐mode and g‐mode pulsators of similar structure: for the β Cep (p‐mode) and Slowly Pulsating B (SPB g‐mode) stars on the upper main sequence; for the δ Sct (p‐mode) and γ Dor (g‐mode) stars of the middle main sequence; and for the EC 14026 sub‐dwarf B variables (p‐mode) and the PG 1716+426 stars (g‐mode). Stars pulsating in both p‐modes and g‐modes promise particularly rich asteroseismic views of their interiors."
The topic of p‐modes is reviewed by Christensen‐Dalsgaard (2002) in an application to the Sun, under the term helioseismology. The p‐mode analysis has become an invaluable tool in the understanding of the neutrino problem. The acoustic oscillations measure properties of the solar interior, for which there is no other available observational method.
Acoustic spectra of a single orbit for each of α Peg and ζ Peg display essentially white noise at frequencies above the dither frequencies, 29 and 34.5 mHz, and the first, second, and third harmonics of roll (12.8, 25.8, and 39.7 mHz, respectively; see Fig. 10). The 10 Hz Nyquist sampling limit accounts for the spectral roll‐off between 1 and 5 Hz. On summation of all detectors, imperfect cancellation at these distinct frequencies leaves residuals at the strongest of discrete frequencies, which are seen in the individual detector spectra. At frequencies between roll (12.8 mHz) and the lowest frequency sampled (600 μHz), the spectra of both stars are indistinquishable within a possible 1/f rise in low‐frequency noise. In this low‐frequency range, any p‐mode signals are at or below the instrumentation noise level. Therefore, we cannot discern any indication of acoustic p‐modes in ζ Peg. Spectral resolution below 10 mHz is too coarse to obtain accurate frequency measurements there. We cannot say p‐modes are present or absent near the noise level.
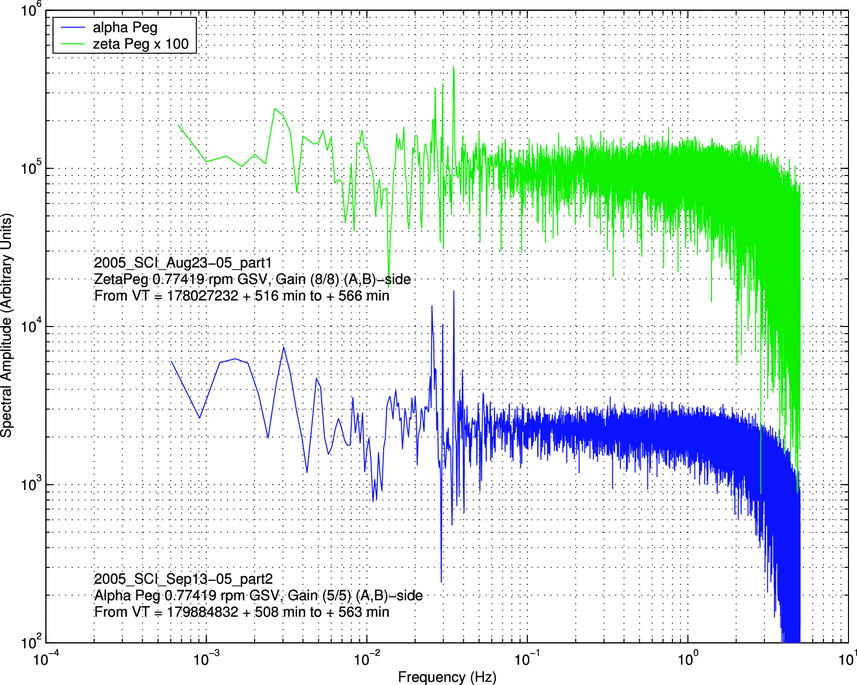
Fig. 10.— Full spectral range of acoustic frequencies of ζ Peg and α Peg (octet of A and B sides). Summed detector currents are cleaned of ionizing particles. The apparent peaks between 10 and 50 mHz are due to instrumental artifacts, not variations that are intrinsic to the star.
Because it is imprudent to attempt recovery of possible g‐modes in the GP‐B photometry, we will have to wait for the arrival of satellite observatories specifically designed for asteroseismology. The 488 μmag amplitude of ζ Peg is within the measurement capabilities of the WIRE spacecraft's guidance sensor (Buzasi et al. 2005). Further observations with GP‐B's main guidance telescope are not possible, due to the lack of precise positioning control, now that the liquid helium is exhausted.
4. IMPLICATIONS
As any star evolves, progressing off the main sequence, it grows in size, and its rotational velocity slows. As the star swells, the amplitude of oscillation may increase. Observations of a larger stellar sample are required to determine how frequently this phenomenon occurs, and when the onset occurs.
Within the class of B‐type stars, there may be a positive correlation of g‐mode amplitude with stellar rotational velocity, the measure of angular momentum. This suggestion raises the question of whether for any evolving B star, g‐mode oscillations, coupled with Coriolis force induced material transport, can produce enough frictional dissipation to act as a braking mechanism on stellar rotation. Heat circulation rising in the equatorial regions and descending at higher stellar latitudes are required for this mechanism to have any validity. Analysis of this problem is beyond the scope of this report.
Certainly, a larger spaced‐based study of the B stars can be used to test the definitional bounds of this group of mid B‐type photometric variables pulsating with periods on the order of days in high–radial‐order g‐modes (Waelkens 1991).
5. CONCLUSION
Based on photometric observations of ζ Peg from the GP‐B guide star telescope, we find that the star is an SPB variable with a period of 22.952 ± 0.804 hr (1.04566 cycles day−1) and an mGP‐B amplitude of 0.0004882. This period is identified as a g‐mode oscillation. No conclusive periods can be associated with p‐mode oscillations in the 0.6–10 mHz region of the asteroseismological spectrum. Future precision photometry is necessary to confirm the resulting classification. It seems likely that micromagnitude photometry will produce a great many variable star classifications and a more complete understanding of the precise evolutionary status of otherwise mundane stars. With future space missions, substantial advances can be anticipated.
I would like to thank Francis Everitt for his encouragement to strike out on this line of investigation, which is not centrally related to the gyroscope science. John Tuneaure and Mac Keiser have also provided encouragement and support. Bob Farley, Karl Stahl, and Suwen Wang provided notable support. Conny Aerts provided a critical reading of the manuscript, with valuable comments. This work was paid for by NASA Marshall Spaceflight Center contract NAS 8‐39225 and a cooperative agreement with NASA Ames Research Center that sponsored the author's association with GP‐B. This work was possible only because of efforts of the entire GP‐B team, spanning several decades in time.