
Abstract
Somatic growth is a critical biological trait for organismal, population, and ecosystem-level processes. Due to its direct link with energetic demands, growth also represents an important parameter to estimate energy and nutrient fluxes. For marine fishes, growth rate information is most frequently derived from sagittal otoliths, and most of the available data stems from studies on temperate species that are targeted by commercial fisheries. Although the analysis of otoliths is a powerful tool to estimate individual growth, the time-consuming nature of otolith processing is one barrier for collection of comprehensive datasets across multiple species. This is especially true for coral reef fishes, which are extremely diverse. Here, we provide back-calculated size-at-age estimates (including measures of uncertainty) based on sagittal otoliths from 710 individuals belonging to 45 coral reef fish species from French Polynesia. In addition, we provide Von Bertalanffy growth parameters which are useful to predict community level biomass production.
Measurement(s) | growth |
Technology Type(s) | otolithometry |
Sample Characteristic - Organism | Actinopterygii |
Sample Characteristic - Environment | coral reef |
Sample Characteristic - Location | French Polynesia |
Machine-accessible metadata file describing the reported data: https://doi.org/10.6084/m9.figshare.13027817
Background & Summary
Anthropogenic disturbances, such as resource exploitation, pollution, and climate change, can significantly alter the structure and function of marine ecosystems1,2,3. Species differ in their contributions to ecological processes4,5; thus, accurately gauging the susceptibility of ecosystems to disturbances requires high-resolution data on life history traits across a broad suite of species, especially in highly diverse ecosystems1,6,7. Somatic growth, the increase of size (and weight) over time, is a critical trait to gauge biological processes that range from individuals to entire ecosystems. For fishes, this trait is particularly important because it links past, present, and future population trajectories in the context of fisheries and stock management; thus, it directly pertains to the provision of ecosystem services. Moreover, somatic growth rate is directly correlated with the energetic demands of organisms. As such, it underlies bioenergetic models that quantify energetic fluxes from individuals to ecosystems8,9,10, such as biomass production11,12,13 and nutrient cycling14,15. Quantifying somatic growth offers an opportunity to examine ecosystem function based on rates of ecological processes rather than employing traditional variables such as abundance or standing biomass12,16. Numerous temperate species have been extensively studied due to their commercial importance, but less information exists for the majority of coral reef species17. Reef fishes are extremely diverse, display a wide range of life history strategies, and provide an invaluable food source to millions of people in the world’s tropics. Therefore, a detailed understanding of reef fish growth rates is critical.
Fish growth parameters can be estimated using several approaches, but those that link age to body size are the most common. Growth can be measured from features preserved in hard structures, such as scales, vertebrae, fin spines, cleithra, opercula, and otoliths18. For teleost fishes, the most commonly used and reliable approach to estimate age is the analysis of growth rings found on otoliths. Otoliths are calcified structures of the inner ear that grow with the deposition of successive calcium carbonate layers, which respond to both circadian and seasonal rhythms19,20,21,22. Fish growth parameters can then be obtained with various models such as Gompertz, Logistic, or Von Bertalanffy (with the latter being the most commonly used approach)23. Such growth models can only be fitted based on a large number of individuals that cover the complete size range of the study species. However, due to the required sample sizes and the need for lethal sampling, obtaining such datasets is time consuming. Further, the raw data that permit size-at-age estimates are often unpublished, available only from technical reports, and/or available for a limited suite of commercial species. Multi-species growth curve comparisons are particularly rare, especially across a wide range of environmental conditions that may influence individual growth rates. Therefore, a back-calculation model that estimates fish size across previous ages based on otoliths represents an alternative to model growth24.
Here, we provide a comprehensive dataset of raw otolith reads (51 species, 855 individuals) for corals reef fishes, collected across six islands in French Polynesia. Further, we provide the back-calculated size-at-age by species (45 species, 710 individuals); and by species across multiple locations (44 species, 669 individuals) using a Bayesian back-calculation model inspired by Vigliola and Meekan24. The inclusion of back-calculated size-at-age values alongside the raw data allows users to fit any regression model in line with their scientific question (Fig. 1). Finally, we provide Von Bertalanffy growth parameters estimated with Bayesian framework both by species and by species across multiple locations (when possible).

Illustration of the different steps that allowed the production of the dataset associated to this article.
Methods
Study locations
Extending over 2,500,000 km2, French Polynesia includes 118 islands spread across five archipelagos: the Society Islands, Tuamotus, Marquesas, Austral Islands and Gambiers. We collected data across four archipelagos, including six distinct islands: Mo’orea and Manuae (Society Islands), Hao and Mataiva (Tuamotus), Mangareva (Gambiers), and Nuku Hiva (Marquesas) (Fig. 2). All fishes were collected in the lagoon and/or reef slope, depending on the accessibility of the respective habitats. Sea surface temperatures (SST) substantially varies around these six islands distributed across French Polynesia (Table 1).

Map of sampling locations in French Polynesia.
Sampling design
Fishes were collected from Mo’orea (March 2016, March 2018, July 2018, and November 2018), Manuae (December 2014), and Nuku Hiva (August 2016 and March 2017) by spearfishing and clove oil, while fishes were collected from Hao (March 2017 and July 2017) and Mangareva (June 2018) only by spearfishing. Additional fishes from Mataiva were bought at the fish market in Tahiti. All applicable international, national, and/or institutional guidelines for the care and use of animals were followed.
Taxonomy and systematics
Fishes were identified using Bacchet et al.25 and Moore and Colas26.
Permits
Sample collection was permitted by the French Polynesian government (authorization number: 681MCE/ENV).
Research methods
Field/Laboratory
In the laboratory, total length (TL) was measured to the nearest millimeter, and fishes were weighed to the nearest 0.1 grams. Then, pairs of sagittae (the largest otoliths of the inner ear) were extracted, cleaned with distilled water, dried, and stored in microtubes.
For each species, otoliths were cut transversely, using a diamond disc saw (Presi Mecatome T210) to obtain a section of 500 µm. Sections were then fixed on a glass side with thermoplastic glue (Crystalbond TM). Small otoliths were directly embedded in the thermoplastic glue and polished to obtain a transversal section. Otoliths were sanded with abrasive discs of decreasing grain size (2,400 and 1,200 grains cm−2) and polished with a 0.25 µm diamond suspension to reach the nucleus. All sections were photographed under a Leica DM750 light microscope with a Leica ICC50 HD microscope camera and LAS software (Leica Microsystems). When sections were too large for a single photograph, multiple photographs were taken and assembled with the software Photostitch (Canon).
A standardized transect across the otoliths (from the nucleus to the edge) was chosen for each species. On this transect, fish age was estimated and distances between annual growth increments were measured using the software ImageJ (Supplementary File 1). The age estimation was performed twice by two independent researchers to prevent biases induced by a single observer. When the coefficient of variation between the two observers was greater than 5%, a common reading was assessed for each section21.
Back-calculation
We then used a back-calculation procedure24 to estimate fish length at previous ages, which we modified to also quantify the uncertainty around the obtained length estimates. This method requires an examination of the shape of the relationship between the length at capture (Lcpt) and the radius of the otolith at capture across all samples (Rcpt) as follows:
where L0p and R0p are the fish size and radius of the otolith at hatching. The regression parameters b and c were estimated by fitting Bayesian models with RStan27. We used informative priors for both parameters [b ~ normal (200, 200) and c ~ normal (1, 1)].
For some individuals, it was not possible to measure the R0p value. Nevertheless, these individuals were still included in the back-calculation model. To do so, we included all missing R0p values as parameters in the model that are estimated in the posterior28. Specifically, these missing R0p values were simultaneously modelled with the known R0p values, so that their prior distribution was defined by the distribution of the known R0p values. These prior distributions were then updated with the information provided by the aforementioned relationship (Eq. 1). Consequently, each missing R0p value had a unique posterior distribution.
For all 4,000 iterations used to fit the models, we used parameters b and c (Eq. 1), to then quantify another parameter, the parameter a, combining both (Eq. 2).
Next, the back-calculation with the Modified Fry (MF) model (Eq. 3)29 was applied to quantify fish lengths at all ages for each individual, using parameter a for each iteration.
where Li and Ri are the fish length and otolith radius at age i, L0p and R0p are the fish size and radius of otolith at hatching. L0p is provided for each species (Online-only Table 1).
We calculated Li for the species that had sufficient replicates, and when possible also per species in each location separately. The estimation of parameters b and c (Eq. 1) required at least two values of R0p, so the back-calculation was not carried out when only one R0p was available for a given species (or a given species in a certain location).
Individuals with estimated age at capture of one year where not used for back-calculation.
Finally, we reported the averages and standard deviations of those length estimates based on the 4,000 iterations. As such, the back-calculated estimates include a measure of uncertainty that can be integrated in the future applications.
Von bertalanffy growth curves
The Von Bertalanffy growth model (Eq. 4) is the most frequently used model to describe fish growth. This model is defined as:
where Lt is the average length at age i, L∞ is the asymptotic average length, K is the growth rate coefficient, and t0 is the age when the average length was zero. In order to validate the accuracy of our back-calculated size-at-age data, we compared growth curves fitted with raw data (total length at capture and estimated age at capture) to those fitted with back-calculated data. As back-calculated size-at-age data within individuals are highly auto-correlated, we designed a Bayesian hierarchical model that takes this auto-correlation into account by fitting individual growth curves as well as an average population-level growth curve. The model was applied on back-calculated data with at least five individuals and for individuals with an age at capture that was greater than two years.
We fitted models both for each species and for each species per location. In all models, we used informative priors for growth parameters extracted from FishBase (https://www.fishbase.se/search.php). We ran models with 2,000 iterations and a warmup of 1,000. When the \(\widehat{R}\) was above one, indicating non-convergence of the Markov Chains Monte Carlo (MCMC), we ran models again augmenting iterations to 4,000 with a warmup of 2,000. If despite that, model convergence was still not achieved, we use MCMC chain plots of the model parameters to remove the individual(s) responsible for non-convergence.
As a comparison, we also ran a general non-linear Bayesian model on the raw data (i.e. using size and age at capture only). Back-calculated data contains more points (multiple points for each individual) than raw data (one point by individual), so the comparison was limited to the species with a sufficient number of individuals (n > 10) and age range in the raw data. These models were run using the package brms30.
All analyses were done with the software R v.3.6.331 and the packages rstan (2.19.3), tidyverse (1.3.0)32, plyr (1.8.6)33, rfishbase (3.0.4)34, and brms (2.13.0)30.
Data Records
The dataset is publicly accessible in the permanent figshare repository (https://doi.org/10.6084/m9.figshare.12156159.v5)35. This dataset consists of:
-
1.
855 individuals from 51 fish species in 15 families collected across six locations in French Polynesia,
-
2.
Fish total length and weight (when measured) for each individual,
-
3.
Age estimations and back-calculated size-at-age for each individual, by species (45 species and 710 individuals) and by species across multiple locations (44 species, and 669 individuals).
Technical Validation
-
The validity of fish names and families were verified on the World Register of Marine Species (WoRMS; http://www.marinespecies.org/index.php) and FishBase (https://www.fishbase.in/search.php).
-
Each otolith was read twice by two readers to limit observer biases for age estimations. When the coefficient of variation between observers was greater than 5%, a common reading was assessed for each section21. Moreover, for each species, we provide a photograph of an otolith section with annual increments and reading axes (Supplementary File 1).
-
To validate the accuracy of back-calculated data, growth curves fitted on back-calculated size-at-age were compared to those from raw data (total length at capture and estimated age at capture) (Fig. 3). This comparison was not possible for a species when the number of collected individuals was too low to fit a growth curve. Comparisons were possible for fifteen species, and for each of them, the 95% credible intervals overlapped between growth curves fitted on back-calculated data versus raw data, suggesting negligible differences between the two approaches (Fig. 3). Moreover, for all species, the curves from back-calculated data were always below those from raw data, indicating no overestimation of L∞. Further, because the back-calculated lengths also include the lengths at age zero, the length at hatching is more realistically represented in the regression models from the back-calculated data. Consequently, when using back-calculation, estimates of K tend to be higher and L∞ tend to be lower. The Von Bertalanffy growth parameters from our back-calculated size-at-age data by species and species across multiple locations are available online (Online-Only Table 2).
Fig. 3 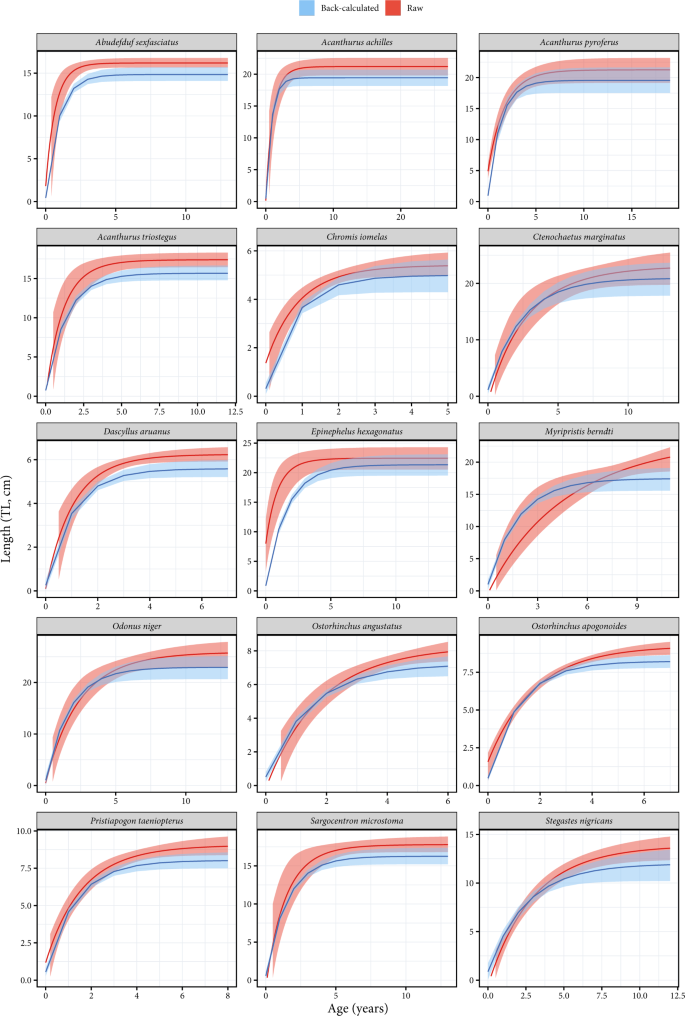
Comparison of Von Bertalanffy growth curves fitted on back-calculated size-at-age data (by species across multiple locations) to those fitted on raw data. The 15 species correspond to those with a sufficient number of individuals to fit the model on raw data.
-
Further, Von Bertalanffy growth parameters estimated from otoliths were extracted from published articles, book chapters, reports and Ph.D. theses and compared to back-calculated parameters from our study (Online-only Table 3). For most species, the growth parameters from our study were similar to those in the literature. Differences may stem from different geographical locations (different temperatures, primary productivity, etc.), the number of analyzed fishes, different length measurements (standard, fork, or total length), or variations in modeling approaches.
-
Finally, we compared our age estimates to the maximum ages reported in the literature (Online-only Table 3). Comparisons were possible for species with available data (seventeen species). Only five species were above the maximum reported age (Caranx melanpygus, Cephalopholis urodeta, Chlorurus spilurus, Epinephelus merra, Plectropomus laevis).

Usage Notes
The dataset is provided as a csv file, which can be directly used by most statistical software. It contains eighteen variables, as described in Table 2. Additional growth parameters can be obtained by fitting other growth models (e.g. Gompertz model) using the variables ‘Agei’ and ‘Li_sp_m’ (species across all locations) or ‘Li_sploc_m’ (species by location).
Back-calculated data are highly auto-correlated, so we recommend using a hierarchical structure to fit growth models.
Within the dataset, ‘NA’ indicates a missing value. Missing values are present for the variables ‘Ri’ (n = 387), ‘R0p’ (n = 2,811), ‘Li_sp_m’ (n = 410), ‘Li_sp_sd’ (n = 410), ‘Li_sploc_m’ (n = 757), ‘Lp_sploc_sd’ (n = 757), and ‘Weight’ (n = 603). For the variable ‘Ri’, missing values correspond to individuals for which it was impossible to estimate the radius at hatching from photographs. The ‘R0p’ values correspond to ‘Ri’ values where ‘Agei’ is equal to zero. Because the ‘R0p’ value is the same for all ‘Agei’ of a given individual (‘ID’), a large number of NAs arises as soon as the ‘Ri’ value is missing (where ‘Agei’ is equal to zero). For the variables ‘Li_sp_m’, ‘Li_sp_sd’, ‘Li_sploc_m’, and ‘Lp_sploc_sd’, missing values correspond to values with insufficient numbers of individuals or known ‘R0p’ measurements to accurately fit the Bayesian back-calculation model. The number of NAs for the variables ‘Li_sp_m’ and ‘Li_sp_sd’ (estimates by species) is lower than the number of NAs for the variables ‘Li_sploc_m’ and ‘Lp_sploc_sd’ (estimates for species by location). Finally, for the variable ‘Weight’, missing values are the result of missing sampling measurements.
Code availability
The code to generate the back-calculated size-at-age data is available at https://github.com/JWicquart/fish_growth.
References
Dulvy, N. K., Metcalfe, J. D., Glanville, J., Pawson, M. G. & Reynolds, J. D. Fishery stability, local extinctions, and shifts in community structure in skates. Conserv. Biol. 14, 283–293, https://doi.org/10.1046/j.1523-1739.2000.98540.x (2000).
Hoegh-Guldberg, O. & Bruno, J. F. The Impact of Climate Change on the World’s Marine Ecosystems. Science 328, 1523–1528, https://doi.org/10.1126/science.1189930 (2010).
Jackson, J. B. C. et al. Historical Overfishing and the Recent Collapse of Coastal Ecosystems. Science 293, 629–637, https://doi.org/10.1126/science.1059199 (2001).
William, W. L. C., Reg, W., Telmo, M., Tony, J. P. & Daniel, P. Intrinsic vulnerability in the global fish catch. Mar. Ecol. Prog. Ser. 333, 1–12 (2007).
Graham, N. A. J. et al. Extinction vulnerability of coral reef fishes. Ecol. Lett. 14, 341–348, https://doi.org/10.1111/j.1461-0248.2011.01592.x (2011).
Dulvy, N. K., Sadovy, Y. & Reynolds, J. D. Extinction vulnerability in marine populations. Fish. Fish. 4, 25–64 (2003).
Cheung, W. W., Pitcher, T. J. & Pauly, D. A fuzzy logic expert system to estimate intrinsic extinction vulnerabilities of marine fishes to fishing. Biol. Conserv. 124, 97–111 (2005).
Frost, P. C. et al. Threshold elemental ratios of carbon and phosphorus in aquatic consumers. Ecol. Lett. 9, 774–779 (2006).
Schindler, D. E. & Eby, L. A. Stoichiometry of fishes and their prey: implications for nutrient recycling. Ecology 78, 1816–1831 (1997).
Schreck, C. B. & Moyle, P. B. Methods for fish biology. Schreck, Carl B. & Moyle, Peter B. edn, (American fisheries society, 1990).
Brandl, S. J. et al. Demographic dynamics of the smallest marine vertebrates fuel coral reef ecosystem functioning. Science 364, 1189–1192 (2019).
Depczynski, M., Fulton, C. J., Marnane, M. J. & Bellwood, D. R. Life history patterns shape energy allocation among fishes on coral reefs. Oecologia 153, 111–120 (2007).
Morais, R. A. & Bellwood, D. R. Pelagic Subsidies Underpin Fish Productivity on a Degraded Coral Reef. Curr. Biol. 29, 1521–1527. e1526 (2019).
Barneche, D. R. & Allen, A. P. Embracing general theory and taxon-level idiosyncrasies to explain nutrient recycling. Proc. Natl. Acad. Sci. U. S. A. 112, 6248–6249 (2015).
Barneche, D. R. & Allen, A. P. The energetics of fish growth and how it constrains food‐web trophic structure. Ecol. Lett. 21, 836–844 (2018).
Brandl, S. J. et al. Coral reef ecosystem functioning: eight core processes and the role of biodiversity. Front. Ecol. Environ. 17, 445–454 (2019).
Taylor, B., Rhodes, K., Marshell, A. & McIlwain, J. Age‐based demographic and reproductive assessment of orangespine Naso lituratus and bluespine Naso unicornis unicornfishes. J. Fish. Biol. 85, 901–916, https://doi.org/10.1111/jfb.12479 (2014).
Campana, S. Accuracy, precision and quality control in age determination, including a review of the use and abuse of age validation methods. J. Fish. Biol. 59, 197–242 (2001).
Jolivet, A., Bardeau, J., Fablet, R., Paulet, Y. & de Pontual, H. Understanding otolith biomineralization processes: new insights into mircoscale spatial distribution of organic and mineral fractions from Raman microspectrometry. Anal. Bioanal. Chem. 392, 551–560 (2008).
Jolivet, A., Bardeau, J.-F., Fablet, R., Paulet, Y.-M. & de Pontual, H. How do the organic and mineral fractions drive the opacity of fish otoliths? Insights using Raman microspectrometry. Can. J. Fish. Aq. Sci. 70, 711–719, https://doi.org/10.1139/cjfas-2012-0298 (2013).
Panfili, J., de Pontual, H., Troadec, H. & Wright, P. J. Manuel de sclérochronologie des poissons. Coédition Ifremer-IRD, Panfili, J., de Pontual, H., Troadec, H. & Wright, P. J. (eds), France, 464 pp edn (2002).
Pannella, G. Fish otolith: daily growth layers and periodical patterns. Science 173, 1124–1126, https://doi.org/10.1126/science.173.4002.1124 (1971).
Katsanevakis, S. Modelling fish growth: model selection, multi-model inference and model selection uncertainty. Fish. Res. 81, 229–235 (2006).
Vigliola, L. & Meekan, M. G. In Tropical fish otoliths: information for assessment, management and ecology Methods and technologies in fish biology and fisheries Ch. The back-calculation of fish growth from otoliths., 174-211 (Spinger, 2009).
Bacchet, P., Zysman, T. & Lefèvre, Y. Guide des poissons de Tahiti et ses îles. (Au vent des îles, 2006).
Moore, B. & Colas, B. Identification guide to the common coastal food fishes of the Pacific Islands region. (2016).
RStan: the R interface to Stan. R package version 2.19.2. http://mc-stan.org/ (2018).
Stan Modeling Language Users Guide and Reference Manual, Version 2.18.0, http://mc-stan.org (2018).
Vigliola, L., Harmelin-Vivien, M. & Meekan, M. G. Comparison of techniques of back-calculation of growth and settlement marks from the otoliths of three species of Diplodus from the Mediterranean Sea. Can. J. Fish. Aq. Sci. 57, 1291–1299 (2000).
Bürkner, P.-C. brms: An R Package for Bayesian Multilevel Models Using Stan. J. Stat. Softw. 80, 28, https://doi.org/10.18637/jss.v080.i01 (2017).
R: a Language and environment for statistical computing. R Foundation for Statistical Computing (Austria, Vienna, 2019).
Wickham, H. et al. Welcome to the Tidyverse. J. Open Source Softw. 4, 1686, https://doi.org/10.21105/joss.01686 (2019).
Wickham, H. The split-apply-combine strategy for data analysis. J. Stat. Softw. 40, 1–29 (2011).
Boettiger, C., Lang, D. T. & Wainwright, P. rfishbase: exploring, manipulating and visualizing FishBase data from R. J. Fish. Biol. 81, 2030–2039, https://doi.org/10.1111/j.1095-8649.2012.03464.x (2012).
Morat, F. et al. Individual back-calculated size-at-age based on otoliths from Pacific coral reef fish species. figshare https://doi.org/10.6084/m9.figshare.12156159.v5 (2020).
Tyberghein, L. et al. Bio‐ORACLE: a global environmental dataset for marine species distribution modelling. Glob. Ecol. Biogeogr. 21, 272–281 (2012).
Shadrin, A. & Emel’yanova, N. Embryonic-larval development and some data on the reproductive biology of Abudefduf sexfasciatus (Pomacentridae: Perciformes). J. Ichthyol. 47, 67–80 (2007).
McCormick, M. I. Delayed metamorphosis of a tropical reef fish (Acanthurus triostegus): a field experiment. Mar. Ecol. Prog. Ser. 176, 25–38 (1999).
Leis, J. M. & Carson-Ewart, B. M. The larvae of Indo-Pacific coastal fishes: an identification guide to marine fish larvae. Vol. 2 (Brill, 2000).
Hutapea, J. H. & Slamet, B. Morphological development of Napoleon wrasse, Cheilinus undulatus larvae. Indonesian Aquaculture J. 1, 145–151 (2006).
Westneat, M. W. & Alfaro, M. E. Phylogenetic relationships and evolutionary history of the reef fish family Labridae. Mol. Phylogenet. Evol. 36, 370–390, https://doi.org/10.1016/j.ympev.2005.02.001 (2005).
Choat, J. H., Klanten, O. S., Van Herwerden, L., Robertson, D. R. & Clements, K. D. Patterns and processes in the evolutionary history of parrotfishes (Family Labridae). Biol. J. Linnean Soc. 107, 529–557, https://doi.org/10.1111/j.1095-8312.2012.01959.x (2012).
Emel’yanova, N., Pavlov, D. & Thuan, L. Hormonal stimulation of maturation and ovulation, gamete morphology, and raising of larvae in Dascyllus trimaculatus (Pomacentridae). J. Ichthyol. 49, 249–263 (2009).
Kawabe, K. & Kohno, H. Morphological development of larval and juvenile blacktip grouper, Epinephelus fasciatus. Fish. Sci. 75, 1239–1251 (2009).
Hussain, N. A. & Higuchi, M. Larval rearing and development of the brown spotted grouper, Epinephelus tauvina (Forskål). Aquaculture 19, 339–350 (1980).
Ukawa, M., Higuchi, M. & Mito, S. Spawning habits and early life history of a serranid fish, Epinephelus akaara (Temminck et Schlegel). Jpn. J. Ichthyol. 13, 156–161 (1966).
Lim, L. Larviculture of the greasy grouper Epinephelus tauvina F. and the brown‐marbled grouper E. fuscoguttatus F. in Singapore. J. World Aquacult. Soc. 24, 262–274 (1993).
Colin, P., Koenig, C. & Laroche, W. In Biology, fisheries and culture of tropical groupers and snappers. ICLARM Conf. Proc. Vol. 48 (eds F. Arreguin-Sãnchez, J.L. Munro, M.C. Baigos, & D. Pauly) 399-414 (1996).
Duray, M. N., Estudillo, C. B. & Alpasan, L. G. The effect of background color and rotifer density on rotifer intake, growth and survival of the grouper (Epinephelus suillus) larvae. Aquaculture 146, 217–224 (1996).
Duray, M. N., Estudillo, C. B. & Alpasan, L. G. Larval rearing of the grouper Epinephelus suillus under laboratory conditions. Aquaculture 150, 63–76 (1997).
James, C., Al‐Thobaiti, S., Rasem, B. & Carlos, M. Breeding and larval rearing of the camouflage grouper Epinephelus polyphekadion (Bleeker) in the hypersaline waters of the Red Sea coast of Saudi Arabia. Aquac. Res. 28, 671–681 (1997).
Glamuzina, B., Glavic, N., Tutman, P., Kozul, V. & Skaramuca, B. Egg and early larval development of laboratory reared goldblotch grouper, Epinephelus costae (Steindachner, 1878)(Pisces, Serranidae). Sci. Mar. 64, 341–345 (2000).
Glamuzina, B. et al. Egg and early larval development of laboratory reared dusky grouper, Epinephelus marginatus (Lowe, 1834)(Picies, Serranidae). Sci. Mar. 62, 373–378 (1998).
Leu, M.-Y., Liou, C.-H. & Fang, L.-S. Embryonic and larval development of the malabar grouper, Epinephelus malabaricus (Pisces: Serranidae). J. Mar. Biol. Assoc. U.K. 85, 1249 (2005).
Jagadis, I., Ignatius, B., Kandasami, D. & Khan, M. A. Embryonic and larval development of honeycomb grouper Epinephelus merra Bloch. Aquac. Res. 37, 1140–1145 (2006).
Yoseda, K. et al. Effects of temperature and delayed initial feeding on the growth of Malabar grouper (Epinephelus malabaricus) larvae. Aquaculture 256, 192–200 (2006).
Ma, Z., Guo, H., Zhang, N. & Bai, Z. State of art for larval rearing of grouper. Intern. J. Aquac. 3, 63–72, https://doi.org/10.5376/ija.2013.03.0013 (2013).
Kimura, S. & Kiriyama, T. Development of eggs, larvae and juveniles of the labrid fish, Halichoeres poecilopterus, reared in the laboratory. Jpn. J. Ichthyol. 39, 371–377 (1993).
Suzuki, K. & Hioki, S. Spawning behavior, eggs, and larvae of the lutjanid fish, Lutjanus kasmira, in an aquarium. Jpn. J. Ichthyol. 26, 161–166 (1979).
Pavlov, D., Emel’yanova, N., Thuan, L. T. B. & Ha, V. T. Reproduction and initial development of manybar goatfish Parupeneus multifasciatus (Mullidae). J. Ichthyol. 51, 604 (2011).
Masuma, S., Tezuka, N. & Teruya, K. Embryonic and morphological development of larval and juvenile coral trout, Plectropomus leopardus. Jpn. J. Ichthyol. 40, 333–342 (1993).
May, R. C., Popper, D. & McVEY, J. P. Rearing and larval development of Siganus canaliculatus (Park)(Pisces: Siganidae). Micronesica 10, 285–298 (1974).
Popper, D., May, R. & Lichatowich, T. An experiment in rearing larval Siganus vermiculatus (Valenciennes) and some observations on its spawning cycle. Aquaculture 7, 281–290 (1976).
Bryan, P. G. & Madraisau, B. B. Larval rearing and development of Siganus lineatus (Pisces: Siganidae) from hatching through metamorphosis. Aquaculture 10, 243–252 (1977).
Hara, S., Duray, M. N., Parazo, M. & Taki, Y. Year-round spawning and seed production of the rabbitfish, Siganus guttatus. Aquaculture 59, 259–272 (1986).
Choat, J. H. & Robertson, D. R. In Coral reef fishes: dynamics and diversity in a complex ecosystem. (ed Academic Press. San Diego. California. USA) Ch. 3: Age-based studies, 57–80 (2002).
Craig, P. C., Choat, J. H., Axe, L. M. & Saucerman, S. Population biology and harvest of the coral reef surgeonfish Acanthurus lineatus in American Samoa. Fish. Bull. 95, 680–693 (1997).
Gust, N., Choat, J. & Ackerman, J. Demographic plasticity in tropical reef fishes. Mar. Biol. 140, 1039–1051, https://doi.org/10.1007/s00227-001-0773-6 (2002).
Ralston, S. & Williams, H. A. Age and growth of Lutjanus kasmira, Lethrinus rubrioperculatus, Acanthurus lineatus, and Ctenochaetus striatus from American Samoa. (Southwest Fisheries Center, Honolulu Laboratory, National Marine Fisheries, 1988).
Sudekum, A. E., Parrish, J. D., Radtke, R. L. & Ralston, S. Life history and ecology of large jacks in undisturbed, shallow, oceanic communities*. Fish. Bull. 89, 493–513 (1991).
Donovan, M. K., Friedlander, A. M., DeMartini, E. E., Donahue, M. J. & Williams, I. D. Demographic patterns in the peacock grouper (Cephalopholis argus), an introduced Hawaiian reef fish. Environ. Biol. Fishes 96, 981–994, https://doi.org/10.1007/s10641-012-0095-1 (2013).
Mapleston, A. et al. Comparative biology of key inter-reefal serranid species on the Great Barrier Reef. Project Milestone Report to the Marine and Tropical Sciences Research Facility. 55 pp (Reef and Rainforest Research Centre Limited, Cairns 2009).
Mehanna, S. F., Osman, Y. A. A., Khalil, M. T. & Hassan, A. Age and growth, mortality and exploitation ratio of Epinephelus summana (Forsskål, 1775) and Cephalopholis argus (Schneider, 1801) from the Egyptian Red Sea coast, Hurghada fishing area. Egypt. J. Aquat. Biol. Fish. 23, 65–75, https://doi.org/10.21608/ejabf.2019.52050 (2019).
Pears, R. J. Comparative demography and assemblage structure of serranid fishes: implications for conservation and fisheries management Ph.D thesis, James Cook University, (2005).
Moore, B. et al. Monitoring the Vulnerability and Adaptation of Coastal Fisheries to Climate Change: Pohnpei, Federated States of Micronesia. Report No. Assement Report N°2, February-March 2014, 116 (2015).
Payet, S. D. et al. Hybridisation among groupers (genus Cephalopholis) at the eastern Indian Ocean suture zone: taxonomic and evolutionary implications. Coral Reefs 35, 1157–1169, https://doi.org/10.1007/s00338-016-1482-4 (2016).
Fry, G., Brewer, D. & Venables, W. Vulnerability of deepwater demersal fishes to commercial fishing: Evidence from a study around a tropical volcanic seamount in Papua New Guinea. Fish. Res. 81, 126–141, https://doi.org/10.1016/j.fishres.2006.08.002 (2006).
DeMartini, E. E. et al. Comparative growth, age at maturity and sex change, and longevity of Hawaiian parrotfishes, with bomb radiocarbon validation. Can. J. Fish. Aq. Sci. 75, 580–589, https://doi.org/10.1139/cjfas-2016-0523 (2018).
Taylor, B. M. & Choat, J. H. Comparative demography of commercially important parrotfish species from Micronesia. J. Fish. Biol. 84, 383–402, https://doi.org/10.1111/jfb.12294 (2014).
Trip, E. L., Choat, J. H., Wilson, D. T. & Robertson, D. R. Inter-oceanic analysis of demographic variation in a widely distributed Indo-Pacific coral reef fish. Mar. Ecol. Prog. Ser. 373, 97–109, https://doi.org/10.3354/meps07755 (2008).
Fidler, R. Y., Carroll, J., Rynerson, K. W., Matthews, D. F. & Turingan, R. G. Coral reef fishes exhibit beneficial phenotypes inside marine protected areas. PLoS ONE 13, e0193426, https://doi.org/10.1371/journal.pone.0193426 (2018).
Ochavillo, D., Tofaeono, S., Sabater, M. & Trip, E. L. Population structure of Ctenochaetus striatus (Acanthuridae) in Tutuila, American Samoa: The use of size-at-age data in multi-scale population size surveys. Fish. Res. 107, 14–21, https://doi.org/10.1016/j.fishres.2010.10.001 (2011).
Moore, B., Alefaio, S. & Siaosi, F. Monitoring the Vulnerability and Adaptation of Coastal Fisheries to Climate Change: Funafuti Atoll, Tuvalu. Report No. Assessment Report N°2, April-May 2013, 100 (2014).
Moore, B. et al. Monitoring the Vulnerability and Adaptation of Coastal Fisheries to Climate Change: Majuro Atoll, Republic of the Marshall Islands. Report No. Assement Report N°2, July-August 2013, 112 (2014).
Moore, B. et al. Monitoring the Vulnerability and Adaptation of Coastal Fisheries to Climate Change: Northern Manus Outer Islands, Papua New Guinea. Report No. Assessment Report N°2, April-June 2014, 119 (2015).
Hubble, M. The ecological significance of body size in tropical wrasses (Pisces: Labridae), James Cook University, (2003).
Pothin, K., Letourneur, Y. & Lecomte-Finiger, R. Age, growth and mortality of the tropical grouper Epinephelus merra (Pisces, Serranidae) on Réunion Island, SW Indian ocean. VIe Milieu 54, 193–202 (2004).
Rhodes, K. L., Taylor, B. M. & McIlwain, J. L. Detailed demographic analysis of an Epinephelus polyphekadion spawning aggregation and fishery. Mar. Ecol. Prog. Ser. 421, 183–198, https://doi.org/10.3354/meps08904 (2011).
Grandcourt, E. Demographic characteristics of selected epinepheline groupers (family: Serranidae; subfamily: Epinephelinae) from Aldabra Atoll, Seychelles. Atoll Res. Bull., https://doi.org/10.5479/si.00775630.539.199 (2005).
Ohta, I., Akita, Y., Uehara, M. & Ebisawa, A. Age-based demography and reproductive biology of three Epinephelus groupers, E. polyphekadion, E. tauvina, and E. howlandi (Serranidae), inhabiting coral reefs in Okinawa. Environ. Biol. Fishes 100, 1451–1467, https://doi.org/10.1007/s10641-017-0655-5 (2017).
Shimose, T. & Nanami, A. Age, growth, and reproductive biology of blacktail snapper, Lutjanus fulvus, around the Yaeyama Islands, Okinawa, Japan. Ichthyol. Res. 61, 322–331, https://doi.org/10.1007/s10228-014-0401-3 (2014).
Mehanna, S., Osman, A., Farrag, M. & Osman, Y. Age and growth of three common species of goatfish exploited by artisanal fishery in Hurghada fishing area, Egypt. J. Appl. Ichthyol. 34, 917–921, https://doi.org/10.1111/jai.13590 (2018).
Heupel, M. R. et al. Demography of a large exploited grouper, Plectropomus laevis: Implications for fisheries management. Mar. Freshw. Res. 61, 184–195, https://doi.org/10.1071/MF09056 (2010).
Taylor, B. M., Gourley, J. & Trianni, M. S. Age, growth, reproductive biology and spawning periodicity of the forktail rabbitfish (Siganus argenteus) from the Mariana Islands. Mar. Freshw. Res. 68, 1088–1097, https://doi.org/10.1071/MF16169 (2017).
Acknowledgements
We thank the French Polynesian Urban Planning Department for providing the GIS shape files for the Polynesian coastline. The project was supported by the BNP Paribas Foundation (REEF SERVICES project), the Agence Nationale de la Recherche (ANR-17-CE32-006), the Fondation de France, a Make Our Planet Great Again Postdoctoral Grant (mopga-pdf-0000000144), and “Direction des ressources marines” (convention number 09419).
Author information
Authors and Affiliations
Contributions
This study was designed by F.M., J.W. and V.P. Field collections were made by F.M., S.J.B., J.C., J.M.C., S.D., P.F., R.G., A.M., Y.L., P.S., N.M.D.S. and V.P. Otolith analyses were conducted by F.M., J.W., G.D.S. and J.B. Funds were obtained by V.P., P.S., Y.L. and J.M.C. Statistical analyses were conducted by J.W. and N.M.D.S. Temperature data were compiled by J.V. (http://www.bio-oracle.org/).
Corresponding authors
Ethics declarations
Competing interests
The authors declare no competing interests.
Additional information
Publisher’s note Springer Nature remains neutral with regard to jurisdictional claims in published maps and institutional affiliations.
Supplementary information
Online-only Tables
Rights and permissions
Open Access This article is licensed under a Creative Commons Attribution 4.0 International License, which permits use, sharing, adaptation, distribution and reproduction in any medium or format, as long as you give appropriate credit to the original author(s) and the source, provide a link to the Creative Commons license, and indicate if changes were made. The images or other third party material in this article are included in the article’s Creative Commons license, unless indicated otherwise in a credit line to the material. If material is not included in the article’s Creative Commons license and your intended use is not permitted by statutory regulation or exceeds the permitted use, you will need to obtain permission directly from the copyright holder. To view a copy of this license, visit http://creativecommons.org/licenses/by/4.0/.
The Creative Commons Public Domain Dedication waiver http://creativecommons.org/publicdomain/zero/1.0/ applies to the metadata files associated with this article.
About this article

Cite this article
Morat, F., Wicquart, J., Schiettekatte, N.M.D. et al. Individual back-calculated size-at-age based on otoliths from Pacific coral reef fish species. Sci Data 7, 370 (2020). https://doi.org/10.1038/s41597-020-00711-y
Received:
Accepted:
Published:
DOI: https://doi.org/10.1038/s41597-020-00711-y
