


Childhood and adolescent obesity has become an important public health problem, as its prevalence has increased significantly over the past years in several countries(Reference Wang and Lobstein1). In Portugal, about a third of children and adolescents are overweight or obese(Reference Sardinha, Santos and Vale2).
There are some sophisticated methods to accurately measure body fat, such as computed axial tomography or dual-energy X-ray absorptiometric densitometry; however, such techniques are not feasible to apply in large epidemiological studies or even in clinical settings because they are complex, time consuming and expensive. Therefore, several anthropometric measures and indices have been proposed for screening overweight and obesity.
The BMI, an indicator of general adiposity, has been commonly used to identify overweight and obese children and adolescents. BMI is an index (weight/height2) that is simple to measure and is a valuable tool to monitor trends in obesity prevalence. Therefore, the Centers for Disease Control(3), the International Obesity Taskforce(Reference Cole, Bellizzi and Flegal4) and WHO(5) have developed sex- and age-specific BMI cut-off values for children and adolescents. However, BMI is a suboptimal marker of body fat because it does not distinguish fat from lean tissue or bone, and therefore classifying people as overweight or obese based on their BMI may lead to significant misclassification. Moreover, BMI is not a suitable method to assess body fat distribution(Reference Brambilla, Bedogni and Moreno6) and it has been suggested that BMI may be a less sensitive indicator of fat in children and adolescents than waist circumference (WC) or waist-to-height ratio (WHtR)(Reference Brambilla, Bedogni and Moreno6, Reference Cattaneo, Monasta and Stamatakis7).
Abdominal obesity seems to reflect intra-abdominal fat, including visceral adipose tissue(Reference Clasey, Bouchard and Teates8–Reference Schreiner, Terry and Evans10), and it is known that increased visceral adipose tissue is strongly correlated with CVD risk factors(Reference Soto Gonzalez, Bellido and Buno11). During childhood and adolescence, it is known that abdominal obesity is an important predictor for several CVD risk factors(Reference Freedman, Serdula and Srinivasan12–Reference Ruiz, Rizzo and Hurtig-Wennlof15); therefore it is considered a critical component of the paediatric metabolic syndrome definition proposed by the International Diabetes Federation(Reference Zimmet, Alberti and Kaufman16).
WC is a simple, effective and inexpensive anthropometric tool to measure abdominal adiposity and related metabolic risks in children of different ethnicities(Reference Brambilla, Bedogni and Moreno6, Reference Weiss, Dufour and Taksali17–Reference Lee, Bacha and Gungor21). For children and adolescents, there are no internationally accepted cut-off values; however, WC centile charts have been developed for children and adolescents in some countries(Reference Katzmarzyk22–Reference Zannolli and Morgese36).
WHtR has been proposed as a convenient alternative measurement to assess central fatness in children(Reference Savva, Tornaritis and Savva13). Similar to WC, WHtR has been shown to be strongly correlated with abdominal fat measured using imaging techniques(Reference Soto Gonzalez, Bellido and Buno11, Reference Ashwell, Cole and Dixon37). Correcting WC to height may obviate the need for age-, sex- and ethnic-related reference values(Reference Ashwell and Hsieh38), while WC requires population-specific cut-off values(39). Recently, in a systematic review, Browning et al.(Reference Browning, Hsieh and Ashwell40) showed that the area under the curve in a receiver-operating curve analysis provides good evidence that a WHtR of 0·5 is a good boundary value for men and women across many ethnic groups. However, some studies are required in order to understand if WHtR may allow the same boundary values for children and adults in different ethnic groups.
Centile reference charts are commonly used in paediatrics and are useful to understand how a child's parameter can be compared with the expected parameters of children of the same age and sex in order to determine whether the child is growing appropriately. To the best of our knowledge, there are no references charts for BMI, WC and WHtR for adolescents living in the Portuguese Archipelago of Azores with which to monitor obesity trends or assess abdominal obesity. Therefore, the purpose of the present study was to develop age- and sex-specific BMI, WC and WHtR percentile curves for Azorean adolescents aged 15–18 years, and to compare them with those from other countries.
Methods
Study design and sampling
Data for the present study were derived from a school-based study, the Azorean Physical Activity and Health Study II (APAHS II), which aimed to examine the relationships between physical activity, physical fitness, overweight/obesity prevalence, health-related quality of life and other factors. The study was carried out in six of the nine Azorean Islands, where 95 % of the population lives: São Miguel, Terceira, Faial, Pico, São Jorge and Graciosa(41).
The sample was selected by means of a proportionate stratified random sampling, taking into account the location (island) and the number of students, by age and sex, in each school. Schools were randomly selected within each island until the established number of students by island was attained. All selected schools participated in the study. The established number of students was 1422, but the sample was oversized in order to prevent loss of information and because, technically, it was necessary to do the fieldwork in complete classrooms. Therefore, data were collected for 1525 adolescents aged 15–18 years.
Twenty-five students aged <14·5 or >18·4 years, and/or having a health condition that did not allow for participation in physical education classes, and/or having missing information on the variables of interest were excluded, resulting in a total of 1500 participants (892 girls and 698 boys). Finally, the sample was adjusted by a weight factor in order to balance the sample in accordance to the distribution of the Azorean population in the schools and to guarantee the real representativeness of each of the groups (age and sex).
All participants were informed about the objectives of the study and parents or guardians of each participant provided written informed consent. The study was approved by the Faculty and the Portuguese Foundation for Science and Technology ethics committees, and was conducted in accordance to the Declaration of Helsinki for Human Studies of the World Medical Association(42).
Measurements took place during autumn 2008. Participants were evaluated during school physical education classes by physical education teachers specially trained for the data collection.
Measures
Body height, body weight and waist circumference
Body height was measured to the nearest millimeter in bare or stocking feet with the adolescent standing upright against a stadiometer (Holtain Ltd, Crymych, UK). Body weight was measured to the nearest 0·10 kg, with the adolescent lightly dressed and without shoes, using a portable electronic weight scale (model Inner Scan BC 532; Tanita, Tokyo, Japan). BMI was calculated as weight divided by the square of height (kg/m2).
WC was measured twice, with a non-elastic metal anthropometric tape, midway between the lower rib margin and the iliac crest at the end of normal expiration(Reference Lohman, Roche and Martorell43) and the average of the two measures was used for analysis. If the two measurements differed by > 1 cm, a third measurement was taken and the two closest measurements were averaged.
WHtR was calculated as the ratio WC (cm)/height (cm).
Statistical analysis
Decimal age was calculated as the difference between date of birth and date of the data collection. Each age group was categorized by the midpoint of an age range. For example, the group of adolescents categorized as 15 years of age included all adolescents between 14·50 years and 15·49 years, and so forth. The 5th, 10th, 25th, 50th, 75th, 85th, 90th and 95th percentiles were chosen as reference values.
Smoothed percentile curves were estimated using Cole's LMS method(Reference Cole and Green44). The LMS method involves summarizing percentiles at each age based on the power of age-specific Box–Cox power transformations that which are used to normalize the data.
Data management and a descriptive analysis were performed using the SPSS for Windows statistical software package version 17·0 (SPSS Inc., Chicago, IL, USA), whereas the LMS regressions were performed using LMS Pro software (The Institute of Child Health, London, UK). All analyses were weighted to be representative of the Azorean population.
Results
Descriptive characteristics by age and sex are presented in Table 1. The prevalence of overweight and obesity was respectively 25·3 % and 6·3 % in girls and 20·1 % and 9 % in boys. Table 2 presents smoothed age- and sex-specific percentile values for weight and height BMI, WC and WHtR. Figures 1, 2 and 3 present the sex- and age-specific smoothed BMI, WC and WHtR percentile curves, respectively. There were some sex differences in the shape of the BMI curves. In girls, the upper percentile values tended to decrease by the age of 16 and 17 years; whereas, in boys, the upper percentiles tended to be flat between 15 and 16 years and then increase until the age of 18 years. In both sexes, the upper percentile values of both WC and WHtR decreased slightly by the age of 16 years and then increased steeply.
Table 1 Sample size for weight, height, BMI, waist circumference (WC) and waist-to-height ratio (WHtR), by sex and age, among a proportionate stratified random sample of 1500 adolescents, aged 15–18 years, Azores, Portugal

Table 2 Smoothed age- and sex-specific percentile values for weight, height, BMI, waist circumference (WC) and waist-to-height ratio (WHtR), by sex and age, among a proportionate stratified random sample of 1500 adolescents, aged 15–18 years, Azores, Portugal
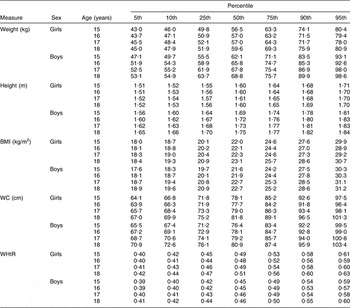
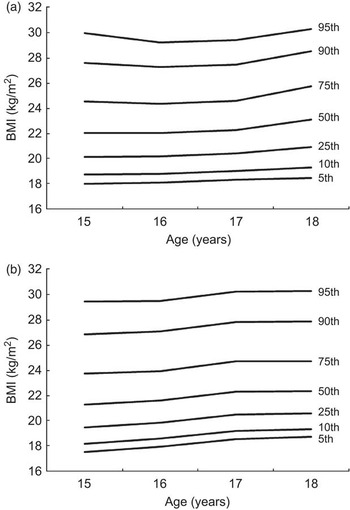
Fig. 1 Sex- and age-specific smoothed BMI percentile curves for adolescents aged 15–18 years, Azores, Portugal: (a) girls; (b) boys
Fig. 2 Sex- and age-specific smoothed waist circumference (WC) percentile curves for adolescents aged 15–18 years, Azores, Portugal: (a) girls; (b) boys

Fig. 3 Sex- and age-specific smoothed waist-to-height ratio (WHtR) percentile curves for adolescents aged 15–18 years, Azores, Portugal: (a) girls; (b) boys
Figures 4 and 5 compare the age- and sex-specific 50th and 90th WC percentiles of Azorean girls and boys, respectively, with those of adolescents from other countries. In both sexes the values for the 50th percentile are higher than those reported for adolescents from Great Britain, Hong Kong, Bulgaria, Turkey and China (Han Chinese) and similar to those reported for Kuwait. The 90th percentile of the Azorean girls and boys are also higher than those from Great Britain, Hong Kong, Bulgaria, Turkey and China (Han Chinese) but lower than those reported for Kuwait.

Fig. 4 Comparison of the age-specific waist circumference (WC) percentiles of Azorean girls (——) with those of adolescent girls from other countries (![]() , Turkey;
, Turkey; ![]() , Great Britain;
, Great Britain; ![]() , China (Han Chinese);
, China (Han Chinese); ![]() , Bulgaria;
, Bulgaria; ![]() , Hong Kong;
, Hong Kong; ![]() , Kuwait): (a) 50th percentile; (b) 95th percentile
, Kuwait): (a) 50th percentile; (b) 95th percentile

Fig. 5 Comparison of the age-specific waist circumference (WC) percentiles of Azorean boys (——) with those of adolescent boys from other countries (![]() , Turkey;
, Turkey; ![]() , Great Britain;
, Great Britain; ![]() , China (Han Chinese);
, China (Han Chinese); ![]() , Bulgaria;
, Bulgaria; ![]() , Hong Kong;
, Hong Kong; ![]() , Kuwait): (a) 50th percentile; (b) 95th percentile
, Kuwait): (a) 50th percentile; (b) 95th percentile
Discussion
The current study is the first one presenting reference data for BMI, WC and WHtR for Azorean adolescents aged 15–18 years. The current curves may be used as baseline data for long-term obesity surveillance among Azorean adolescents. WC and WHtR curves may also be added to the existing international values.
Comparisons of WC data between different studies require caution since WC may be measured at different sites. Although the literature has demonstrated that WC correlates with percentage fat in the trunk region irrespective of the WC measurement site(Reference Wang, Thornton and Bari45), it is also known that WC mean values(Reference Wang, Thornton and Bari45) and percentile values(Reference Inokuchi, Matsuo and Anzo33) differ between measurement sites. Since WC can be measured at a variety of different sites, this may also affect the comparisons of WHtR values between studies. Therefore, international agreement about the measurement site in children and adolescents is required in order to facilitate comparisons between percentile values from different populations.
In the present study, we compared the 50th and 90th percentiles only with other studies that also used the same WC measurement protocol, and we found that Azorean adolescents have higher 50th and 90th percentile values than adolescents from other countries, except from Kuwait. Nevertheless, it is important to notice that the British and the Kuwaiti data were collected more than 20 and 12 years ago, respectively, whereas data for other studies were collected in the last 6 years.
The prevalence of overweight and obese children and adolescents has increased in several countries in the last decades(Reference Lobstein and Frelut46), and consequently it is possible that WC values may also have changed(Reference Li, Ford and Mokdad47, Reference McCarthy, Jarrett and Emmett48). In the UK, for example, the secular increase in WC exceeded that of BMI, suggesting that assessing overweight and obesity trends only by BMI can mask the true obesity-related risk in children and adolescents(Reference McCarthy, Jarrett and Emmett48). Indeed, it is known that WC and WHtR are better predictors of CVD risk factors in children than is BMI(Reference Savva, Tornaritis and Savva13), and prospective and case–control studies have shown that even within a normal BMI, those with elevated WC are at increased risk of CVD and premature death(Reference Lear, James and Ko49). Nevertheless, Schwandt et al.(Reference Schwandt, Kelishadi and Haas50) did not find significant mean differences for WC values in a 10-year trend study of German children.
The high WC percentile values observed in our sample are of concern and may be partially explained by environmental and biological factors or their interaction. Indeed, the Azores is one of the seven ‘outermost regions’ of the European Union. Those regions are distinguished by their low population density, their considerable distance from mainland Europe, and their considerable structural backwardness for which they have received extra funding from the European Union to improve living conditions and promote economic and social development. The population has European ancestry and the economic activity is mainly based on tourism, fishing and agriculture. Azores has some unique social and geographical features and an urban design that differs from the mainland. All of the islands have volcanic origins and numerous landscapes with virgin forest and green fields. Most of the urban areas are small and located on the coast. Unfortunately, there are no percentile curves for BMI, WC or WHtR available for Portuguese children and adolescents, and therefore no comparisons between Azorean youth and mainland Portuguese youth can be done. In this context, future studies observing obesity trends in children and adolescents should also consider WC as well as WHtR as screening instruments.
Conclusions
The reference curves presented in the current study provide baseline data for the long-term surveillance of Azorean children and adolescents, as well as for national and international comparisons.
Acknowledgments
The present study was supported by grants from the Fundação para a Ciência e Tecnologia – Ministério da Ciência, Tecnologia e Ensino Superior (FCT-MCTES; BD/44422/2008, BPD/65180/2009, BSAB/1025/2010 and PTDC/DES/098309/2008); by the Azorean Government; and by the Spanish Ministry of Science and Innovation (RYC-2010-05957). There are no conflicts of interest. R.S., P.M. and J.M. conceived the study design, performed statistical analyses and wrote the paper; S.V., J.R.R., C.M., L.S.-M., L.L. and M.J.C.-S., wrote the paper; A.I.M., A.O.-T., P.C.S. and S.A. collected the data and performed statistical analyses. The authors are grateful to all teachers and technical staff who were involved in data collection procedures.


