


Introduction
Income inequality has occupied a central place in a large strand of scholarly inquiry in the study of public policy (Smeeding Reference Smeeding2005; Kelly and Enns Reference Kelly and Enns2010; Johnston and Newman Reference Johnston and Newman2016; Epp and Borghetto Reference Epp and Borghetto2020). One of the received wisdoms in this literature is that affluent Americans enjoy greater influence over various stages of the policymaking process than less-well-off citizens do (Gilens Reference Gilens2012; Flavin and Franko Reference Flavin and Franko2017). Scholars further argue that the observation that the policy preferences and priorities of lower-income citizens are underrepresented in policymaking processes may translate into undemocratic policy outcomes, further exacerbating political and economic inequalities (Jacobs and Page Reference Jacobs and Page2005; Bartels Reference Bartels2006; Gilens Reference Gilens2009).
In a rather distinct field of scholarly inquiry, scholars of political behaviour turned their attention to socio-economic differences in political engagement to advance our understanding of differential outcomes in democratic processes (Verba and Nie Reference Verba and Nie1987; Leighley Reference Leighley1995; Verba et al. Reference Verba, Schlozman and Brady1995; Schlozman et al. Reference Schlozman, Verba and Brady2012). Specifically, this body of research showed that lower-income people are less likely to vote (Brady et al. Reference Brady, Verba and Schlozman1995; Lijphart Reference Lijphart1999; Jusko and Shively Reference Jusko and Shively2005; Gallego Reference Gallego2009), less likely to participate in political processes by contacting elected officials or making campaign contributions (Bartels 2016), and more likely to withhold their policy preferences in opinion polls (Laurison Reference Laurison2015).
While the relationship between social class and political engagement has received considerable scholarly attention in the study of representation over the past several decades, much less attention has been paid to the link between social class and opinion expression. Instead, income differences in voting and campaign donations have received the lion’s share of the scholarly interest in the study of political engagement (Leighley Reference Leighley1995). Whereas this is hardly surprising, as elections produce some of the more important outcomes in democratic processes, it is critical to investigate the effect of social class on arguably the most basic and essential act of democratic politics, opinion expression. For one thing, if lower-income individuals are less likely to voice their policy priorities and preferences, this would be indicative of political alienation and disenchantment with the political system (Bogart Reference Bogart1967; Althaus Reference Althaus2003), which is of great normative importance. As Laurison (Reference Laurison2015, 926) convincingly put it, “Reducing external barriers or even ‘cognitive costs’ will have little democratizing effect if lower-income people are nonetheless reluctant to even express political opinions”.
Despite being one of the few survey items that has been asked consistently since the 1940s (Cavari and Freedman Reference Cavari, Freedman, Baumgartner, Breunig and Grossman2019), representational quality in the most important problem (MIP) questions has received relatively little attention. In fact, individual-level determinants of “don’t know” (DK) and “no opinion” responses to policy priority questions (such as the MIP or issue questions) have gone mostly unexamined in a longitudinal manner, and this lack of attention constitutes a considerable knowledge gap in the literature for two important reasons. First, scholars in various fields of study, from opinion formation to policy responsiveness, relied heavily on the MIP question to examine numerous political phenomena at the aggregate level (Smith Reference Smith1980, Reference Smith1985; Jones Reference Jones1994; Jones and Baumgartner Reference Jones and Baumgartner2004, Reference Jones and Baumgartner2005; McCombs Reference McCombs2004; Jennings and John Reference Jennings and John2009; Jones et al. Reference Jones, Larsen-Price and Wilkerson2009; Enos and Hersch Reference Enos and Hersh2015; Bevan et al. Reference Bevan, Jennings and Wlezien2016; Oldendick and Hendren 2017; Gruszczynski Reference Gruszczynski2020), where little to no attention has been paid to the individual-level dynamics of opinion expression gaps among socio-demographic groups. Second, although research on policy responsiveness tends to be inconclusive in regard to the role of public opinion in the policymaking process, recent experimental studies document strong evidence that exposure to public opinion research leads to important changes in politicians’ legislative behaviour (Hager and Hilbig, Reference Hager and Hilbig2020; Tomz et al. Reference Tomz, Weeks and Yarhi-Milo2020)Footnote 1 ; therefore, misrepresentation of policy priorities at the aggregate level may have normatively important implications for democracy and its “signal detection system” (Jones and Baumgartner Reference Jones and Baumgartner2005; Ura and Ellis Reference Ura and Ellis2008).
The present study makes a comprehensive attempt to examine the characteristics of opinion givers by utilising a recently constructed dataset of open-ended MIP responses from every survey conducted in the past 75 years that asked the MIP question (Heffington et al. Reference Heffington, Park and Williams2019). Building on a large body of research that establishes a link between political agency and efficacy, and political engagement (Verba et al. Reference Verba, Schlozman and Brady1995; Almond and Verba Reference Almond and Verba1963; Morrell, Reference Morrell2003; Beaumont, Reference Beaumont2011), we argue that higher-income individuals, relative to the less affluent, are more likely to express their policy concerns. Furthermore, we show that the income gap in the expression of policy concerns cross cuts racial, gender, and partisan gaps. Interestingly, while the opinion expression gap between the lowest and the highest income groups diminishes among the better educated, it does not disappear. Finally, we show that accounting for missing responses via multiple imputation (MI) leads to considerable changes in policy prioritisation patterns at the aggregate level, especially for some of the traditionally salient policy categories. These results lend support to the contention that political inequalities in American politics are present even in the basic act of political expression and engagement.
The rest of the article proceeds as follows. First, we review the literature on income inequality and political opinionation and develop our theoretical expectations. We then estimate a series of logistic regression models that predict “DK/no opinion” responses to the MIP question over several decades.Footnote 2 Using MI procedures, we then account for missing responses and compare our imputed results with original policy prioritisation models. We conclude by discussing the implications of our findings for the study of representation of interests and political opinionation.
Theorising income inequality and political expression
Background
Since the last two decades, there has been a renewed interest in various aspects of political inequality in the United States (US) and elsewhere. Unlike earlier studies, this new line of research highlighted the unequal nature of policy responsiveness in the US by focusing on the link between the substantive policy preferences of the average American and actual policy outputs (Monroe Reference Monroe1979, Reference Monroe1998; Erikson et al. Reference Erikson, MacKuen and Stimson2002; Burstein Reference Burstein2003; Winters and Page Reference Winters and Page2009; Hacker and Pierson Reference Hacker and Pierson2010; Gilens Reference Gilens2012; Epp Reference Epp2018; Epp and Borghetto Reference Epp and Borghetto2020). Specifically, this body of research has been primarily interested in the extent to which government officials respond to changes in mass opinion in regard to a particular policy (Canes-Wrone, Reference Canes-Wrone2015, 149), where “mass opinion” is typically “assumed to refer to the aggregated responses of individuals as reflected in opinion polls” (Manza and Cook Reference Manza and Cook2002, 631). While this literature has advanced our understanding of the opinion-policy nexus, we believe there is great value in taking a step back and scrutinising those who refrain from joining the pool of opinion givers when asked about the MIPs facing the country.
Although the use of opinion polls in democratic processes has been a hotly debated question (Burstein Reference Burstein2003), a widely accepted view is that descriptive representation in collective preferences is of great normative importance for various reasons, according to both the delegate and the trustee models of democracy (Herbst Reference Herbst1995; Althaus Reference Althaus2003). In fact, as Althaus (Reference Althaus2003, 259) highlights in his influential work, there are various descriptive uses of opinion polls in democratic processes, from gauging public reactions to political events, helping the public hold politicians accountable to the policy preferences of citizens, influencing policy formulation, to pinpointing winning political issues in election periods (see also Gallup and Rae Reference Gallup and Rae1940; Key Reference Key1961; Nacos et al. Reference Nacos, Shapiro and Isernia2000; Sobel Reference Sobel2001; Belot Reference Belot2019). For this reason, distortions in collective preferences due to the underrepresentation of particular groups in the pool of opinion givers may have the potential to undermine the quality of democratic processes. In Althaus’ (Reference Althaus2003, 252) words, “the possibility that some group members may fail to give an opinion reinforces the potential for political inequality in the relative influence of group preferences”. While we proceed with caution in interpreting the importance of descriptive representation in collective preferences for actual representational outcomes in democracies, we join a growing body of research examining systematic distortions in collective preferences and make a comprehensive attempt to understand income-related differences in reluctance to express perceived policy priorities.
Income inequality, policy prioritisation, and opinion-expression gap
Past scholarship has theorised about economic hardship and income inequality as having negative effects on various forms of political participation, although the causal relationship is fairly complex (Finkel Reference Finkel1985; Marx and Nguyen Reference Marx and Nguyen2018). While several potential mechanisms have been proposed as to how income level can shape one’s political engagement, a large line of scholarly inquiry highlights the role of material resources in political processes (Burns et al. Reference Burns, Schlozman and Verba2001). Reviewing prior research, Beaumont (Reference Beaumont2011, 217) contends that “one’s position in the social hierarchy provides valuable material resources, shapes the political norms around us, and influences invitations into politically active groups”. Building on this contention, the author shows that civic resources, which tend to overlap with socio-economic status (SES), explain diminished political engagement among lower SES individuals. Lending empirical support to the idea that individuals facing economic hardship tend to have lower levels of civic participation, Lim and Sander (Reference Lim and Sander2013) also report that income inequality leads to declines in both political and nonpolitical types of civic engagement. Others argued that those facing economic hardship are so preoccupied with financial difficulties that they have little time for and interest in political matters (Brody and Sniderman Reference Brody and Sniderman1977; Rosenstone Reference Rosenstone1982). In short, studies focusing on the relationship between one’s material well-being and political engagement suggested that economic hardship may dampen political engagement directly or indirectly by diminishing the material resources and social capital that are known to foster active political engagement (Verba et al. Reference Verba, Schlozman and Brady1995).
A related body of research turned to the concepts of internal and external political efficacy to explain disparities in political engagement among the public (Abramson and Aldrich Reference Abramson and Aldrich1982; Bowler and Donovan Reference Bowler and Donovan2002; Marx and Nguyen Reference Marx and Nguyen2016). One established finding in this research is that lower-income individuals often have diminished internal political efficacy (Almond and Verba Reference Almond and Verba1963; Pateman Reference Pateman1970; Verba et al. Reference Verba, Schlozman and Brady1995; Morrell Reference Morrell2003), namely “feelings of personal political effectiveness, or the perception that the self is capable of influencing government and politics” (Finkel Reference Finkel1985, 892), which helps explain their withdrawal from politics at greater rates. Marx and Nguyen (Reference Marx and Nguyen2018, 921) draw on the literature on the psychology of poverty to argue that economic hardship depresses internal political efficacy by reducing cognitive and emotional sources: “Besides a shortage of time to acquire political information, social problems also trigger cognitive and emotional processes that are likely to impede the processing and retrieval of information”. That is, cognitive limitations imposed by the psychology of poverty may further diminish one’s civic skills and confidence in one’s ability to participate in politics. In the context of answering survey questions about the most pressing problems of the country, this implies that the poor, compared to higher-income citizens, may be less likely to provide opinions about the most pressing problems facing the country due to reduced cognitive and emotional resources.
Studies also show that external efficacy, the belief that political elites and institutions are responsive to the needs and policy priorities of the public, fosters participatory habits in political processes (Finkel Reference Finkel1985; Valentino et al. Reference Valentino, Gregorowicz and Groenendyk2009). Feeling excluded from political decision-making processes, lower-income individuals may withhold their opinions when asked about the problems facing their country, as they may think it is not worthwhile to provide an opinion on macro political phenomena in an unresponsive political system. Francis and Busch (Reference Francis and Busch1975, 208), for instance, argue that survey nonresponse is not random “because persons on the periphery feel excluded, become alienated, and express this by non-response or refusing to be interviewed”. Similarly, Bourdieu (Reference Bourdieu and Nice1984, Reference Bourdieu and Thompson1991) highlights that income and its correlates, such as education and occupation, do not only increase political participation by improving people’s technical ability to understand and engage in politics but also create a subjective sense of their place in the world (i.e. habitus), which leads them to feel entitled and expected to have political opinions. Seen in this vein, Bourdieu argues, class-related dispositions towards politics dominate much of individual behaviour in socio-political life. Consequently, as Laurison (Reference Laurison2015, 928) summarises, “lower-income and less-educated people report being less interested in politics, feeling alienated from politics, feeling that other people understand politics better (internal efficacy), and believing that they can have little impact on politics (external efficacy)…[which are] manifestations of the perception that many relatively disadvantaged people have that political debates, much like art galleries and opera houses, are dominated by and intended for other, better-off kinds of people”. Indeed, the author’s study demonstrates that lower-income people are more likely to give DK answers to political questions even after controlling for differences in resources, knowledge, cognitive capacities and skills, leading him to conclude that class-based differences in political participation do not only stem from differences in cultural capital, education or cognitive skills but also from widespread differences in the willingness of the poor to express political opinions.
Berinsky’s (Reference Berinsky2002) study of public opinion on social welfare policy controversies documents that less-well-off individuals are less likely to offer opinions on social welfare policy questions. According to the author, the broader political culture surrounding the social welfare policy in the US interacts with significant resource differentials (e.g. political interest, knowledge) to create disproportionately high DK responses among the disadvantaged, and this tendency results in overrepresentation of conservative policy positions regarding the social welfare policy. Extending this research in a book-length study, Berinsky (Reference Berinsky2004) has shown that controversies surrounding particular policies such as racial policy led the poor to withhold their opinions at greater rates, which has important implications for collective preferences.
To recap, different strands of research attribute the relatively low levels of political involvement among the poor to reduced material, cognitive and emotional resources that are known to influence the sense of civic duty and political efficacy. While past research recognises the complexity of the causal relationship, thanks to the considerable overlap among civic skills, and material and cognitive resources, the contention that the poor withdraw from politics at greater rates has received substantial empirical evidence. Based on this discussion, we argue that lower-income individuals withhold their opinion when asked about the MIPs facing the country and suggest three potential explanations based on past studies: Compared to affluent citizens, the poor (i) are more likely to think that it is not worthwhile to provide their opinion on a macro political problem due to limited government responsiveness (i.e. external efficacy), (ii) have less confidence in understanding and participating effectively in politics (i.e. internal efficacy), and (iii) have less material and emotional resources (e.g. time, money, social and political networks) that can help sustain their political interest and motivation. Using Schlozman et al. (Reference Schlozman, Verba and Brady2012, 181) words, “position in the socio-economic hierarchy… affects the acquisition of such participatory factors as psychological orientations to politics like political interest, knowledge, and efficacy and the civic skills developed in school and adult institutional settings”. Following this line of reasoning, we expect lower-income individuals to withhold their policy priorities at greater rates than higher-income individuals due to diminished political efficacy and sense of civic duty (Hypothesis 1).
Prior research has also shown that formal education strengthens one’s sense of competence to participate effectively in political processes (Verba and Nie Reference Verba and Nie1987; Verba et al. Reference Verba, Schlozman and Brady1995; Delli Carpini and Keeter Reference Delli Carpini and Keeter1996; Morrell Reference Morrell2003). Formal education also provides individuals with material resources and stronger political networks, which in turn enhance their external efficacy (Rasmussen and Nørgaard Reference Rasmussen and Nørgaard2018). As Beaumont (Reference Beaumont2011, 216) argues, “education yields valuable political assets, but often intersects with status and civic resources, providing the greatest benefits to those who need them least”. Empirical evidence supporting this view is abundant (Laurison Reference Laurison2015). For instance, Schlozman et al. (Reference Schlozman, Verba and Brady2012) show that college graduates are far more politically active than high school graduates. Furthermore, Finkel’s (Reference Finkel1985) analysis shows that the effect of political participation on internal and external efficacy is lowest among the better educated, implying that there is relatively little room for improvement in internal and external efficacy among the better educated. Following this research, we argue that formal education reduces the negative effect of economic hardship on opinion expression by enhancing internal and external efficacy (Hypothesis 2).
Empirical approach
Previous scholarship on nonresponse focused almost exclusively on questions of policy preferences and political knowledge (Krosnick and Milburn Reference Krosnick and Milburn1990, Reference Krosnick1991; Delli Carpini and Keeter Reference Delli Carpini and Keeter1993; Nadeau and Niemi Reference Nadeau and Niemi1995; Berinsky Reference Berinsky2005; Page and Shapiro Reference Page and Shapiro2010), whereas little attention has been devoted to item nonresponse in policy priority questions, such as the most important “problem” or “issue” surveys. In an attempt to shift empirical focus from nonresponse in policy preferences to that in policy priorities, we make the first large-scale attempt to examine DK/no opinion answers to the MIP question. To that end, we make use of a recently constructed dataset of policy priorities that covers the period of 1939–2015. This dataset, arguably the most comprehensive of its kind, has various advantages. First of all, unlike most other datasets used in studies of item nonresponse, this dataset contains open-ended questions. As Luskin and Bullock (Reference Luskin and Bullock2011, 549) wrote, “on closed-ended items, guessing is a snap, lucky guessing a reasonable chance, and retrieval not a factor… the vast majority of those saying ‘‘don’t know’’ really don’t know”. That is to say, reluctance in expressing opinions is likely driven by political knowledge on closed-ended items. This is arguably less so with open-ended questions of policy priorities, which provide additional opportunities to explore the sources of DK answers other than education and knowledge.
There has been considerable variation in how survey organisations measured nonresponse in MIP questions in the past decades. The great majority of surveys in the MIP dataset utilised either “don’t know”, or “no opinion” or both items to code nonresponse. In the context of MIPs, we believe that the items “don’t know” and “no opinion” are conceptually very similar. This is because open-ended policy priority questions in MIP surveys do not measure political knowledge but instead measure perceived priorities. For this reason, we believe that both “don’t know” and “no opinion” are good measures of policy inattention.Footnote 3
The dataset at our disposal constitutes a significant improvement over most existing datasets of public opinion in an important way in the context of the study of item nonresponse. Studies exploring various questions about policy responsiveness and representation of interests relied heavily on datasets of individual policy preferences for the most salient issues of the day, leaving numerous issues that fail to make it onto the government and the public agenda largely unexamined (Page Reference Page, Manza, Cook and Page2002; Burstein Reference Burstein2006). Accordingly, scholars argue that preference data often used by such studies lead researchers to overstate the importance of their findings (Gilens Reference Gilens2012). Gilens suggests that one way to overcome this issue is to encourage the use of individual-level attitude data for nonsalient issues. With its open-ended structure and unusually long period of coverage, the MIP dataset includes both salient and nonsalient issues and allows for a more fine-grained analysis of DK answers. By shifting our empirical focus from closed-ended preference questions about salient issues to open-ended priority questions, we seek to go beyond preferences to examine whether such income gaps are also present in policy priorities.
This recently constructed dataset codes nearly a million Americans’ responses to the MIP question from around 700 opinion surveys conducted in the past seven decades (Heffington et al. Reference Heffington, Park and Williams2019). However, since data about the respondent’s income level are not available from before 1960, we restrict our analysis to the period of 1960–2015, which leaves us with 596 opinion surveys and nearly 700,000 respondents. This dataset categorises open-ended MIP responses into topic codes based on three coding schemes, the Comparative Agendas Project (CAP), Singer, and the Manifesto Research on Political Representation (MARPOR), and therefore, allows for comparisons across time. The dataset also codes the discrete categories of income into quartiles based on the distribution of household income within each survey. While not ideal, income quartiles were widely used in previous scholarship dealing with the respondent’s socio-economic characteristics (e.g. Ura and Ellis Reference Ura and Ellis2008), and the use of quartiles enables comparison across a large number of different surveys.
Since we report additional analyses using the content-coded MIP answers (specifically CAP-coded answers) to supplement our main analysis, it is worth discussing the three coding schemes utilised in the MIP dataset. The MIP dataset coded responses into a wide variety of problem categories that match issue classifications provided by Matthew Singer (Singer Reference Singer2011), MARPOR (Volkens et al. Reference Volkens, Bara, Budge and McDonald2014), and the CAP (Baumgartner and Jones Reference Baumgartner and Jones2002). The MARPOR coding scheme is the least comprehensive among the three, providing seven broad topic categories such as the economy, external affairs, and welfare and quality of life. The CAP and Singer coding schemes provide much more specific topic codes, with the Singer scheme having a larger number of topic categories. Although these two coding schemes differ in the coding of some specific categories, there is significant overlap in many of the salient policy areas. Heffington and collaborators (Reference Heffington, Park and Williams2019, 19) note that “we can see that while there is some loss of data in translating the Singer scheme into the CAP scheme, these losses are very minor and do not amount to significant incompatibilities because the omitted categories are so rarely used”.
We estimate a series of logistic regression models that predict nonresponse at the individual level, where our dependent variable measures whether the respondent said “don’t know” (or “no opinion”) when asked about the MIP facing the country. Around 11% of respondents (nearly 100,000 individuals) gave DK/no opinion responses to open-ended MIP questions over the past decades. Our main independent variables of interest include income level, formal education, and copartisanship (coded as 1 if the respondent identifies strongly/weakly with the same party as the incumbent president). The variable income level measures household’s income as a quartile in a given survey and therefore takes into account the distribution of income in the sample. As the MIP dataset does not provide raw income data, we are unable to use alternative, recoded income measures. The variable education measures the respondent’s highest completed level of schooling using an ordinal scale: no high school, some high school, high school, college, and postgraduate.
Research shows that various socio-economic and demographic factors are correlated with policy priorities and political knowledge and therefore need to be controlled for in our empirical models (Althaus Reference Althaus2003; Jerit et al. Reference Jerit, Barabas and Bolsen2006). For example, past research showed that women are significantly less likely than men to express attitudes in surveys (Atkeson and Rapoport Reference Atkeson and Rapoport2003). Similarly, studies show that people of colour are more likely to abstain from providing opinions in polls (McDonald and Thornburg Reference McDonald and Thornburg2012). As for age, Berinsky (Reference Berinsky, Donsbach and Traugott2008) found that middle-aged respondents were much less cooperative than younger and older respondents. For these reasons, we control for race (White = 1), gender (Female = 1), and age, as well as place of residence (south = 1; urban = 1). Additionally, given that partisanship plays an important role in shaping policy priorities (Zaller Reference Zaller1992; Lupia et al. Reference Lupia, McCubbins and Arthur1998), it may well be the case that those identifying with the same party as the incumbent president are less likely to mention policy areas when asked about the MIPs facing the country. Finally, we employed year fixed effects.Footnote 4
A large portion of respondents come from surveys conducted by Gallup (37%, with 286,000 respondents), CBS News/NYT (19%, with 149,000 respondents), CBS News (10%, with 77,000 respondents), ABC News/Washington Post (6%, with 46,000 respondents), Pew (5%, with 41,000 respondents), Los Angeles Times (5%, with 38,000 respondents), and ANES (3%, with 23,000 respondents) between 1960 and 2015. The sample size in individual surveys ranges from 450 to 5,800, with the average being around 1,600. These surveys are highly representative of the US population. Specifically, 52% of the respondents are female, and 15% are racial minorities (i.e. non-White), which is greatly in line with the US census data. While 45% of the respondents identified as Democrats, nearly 30% were Republican. Around 21% of the respondents fall within the lower quartile, 27% within the second quartile, 26% within the third quartile, and 25% within the highest quartiles.Footnote 5 More than half of all respondents are high school graduates (54%), whereas those with a postgrad diploma and those with no high school education constitute around 15% of our sample.Footnote 6 Summary statistics are reported in the supplementary file (see Table A.1).
Before we present our empirical results, it is worth illustrating DK answers by year to put nonresponse in surveys into context. In Figure 1, we provide a comparison of the proportion of respondents stating three most popular policy areas, the economy, defence and international affairs, as the MIP versus that of nonresponse.Footnote 7 While the proportion of nonresponse by year fluctuated considerably over time, it is clear from the figure that DK answers constituted an important portion of MIP answers. The economy was the most frequently mentioned MIP in the great majority of surveys in the MIP dataset. For much of the past several decades, the proportion of nonresponse was often as high as the proportion of respondents stating “defence” and “international affairs” as the MIP facing the country. This implies that DK/no opinion answers in the MIP surveys, which constitute 10.5% of the observations in the dataset, were much more common than mentions of various important policy areas including “health care” (3.5%), “education” (2%), “civil rights” (3.8%), and “social welfare” (4%).
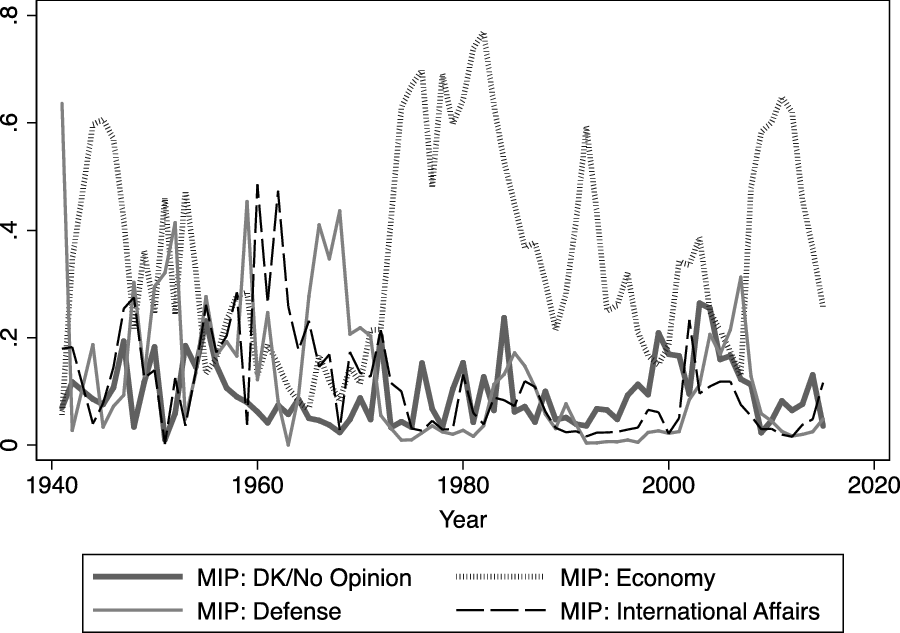
Figure 1. The proportion of nonresponse in the MIP dataset by year.
Results
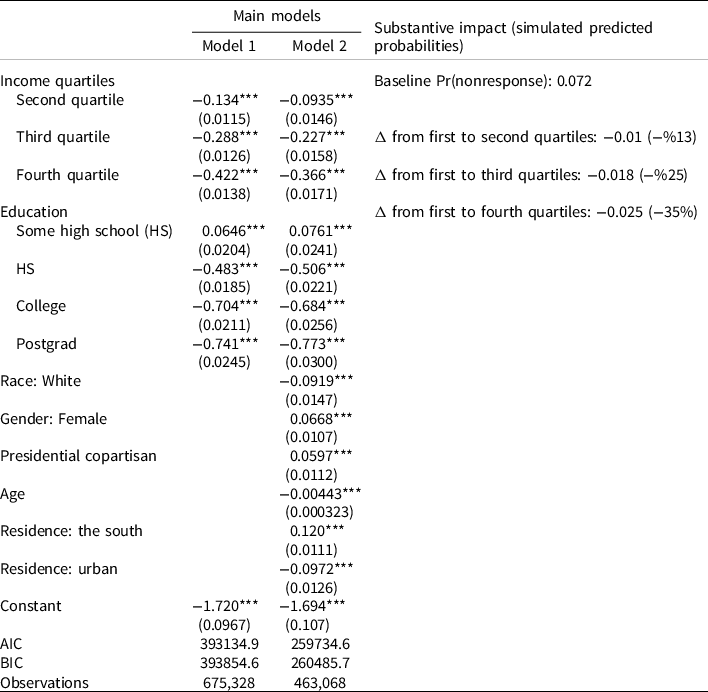
Reviewing different strands of research on the link between income level and opinion expression, we hypothesise that lower-income individuals are more likely to give DK answers when asked about the MIPs facing the country (H1), and that increasing formal education alleviates income-related gaps in opinion expression (H2). To that end, we estimate a series of logistic regressions with year fixed effects that predict nonresponse in MIP surveys and report these results in Table 1. As coefficients from logistic regressions are difficult to interpret, we also provide simulated predicted probabilities based on hypothetical scenarios. We then report our interactive models in Table 2 and illustrate marginal effects drawn from our interactive models in Figure 2.
Table 1. Determinants of DK responses to the MIP question, 1960–2015
Standard errors in parentheses.
***p < 0.01, **p < 0.05, *p < 0.1.
Table 2. Interactive effects of education and income level
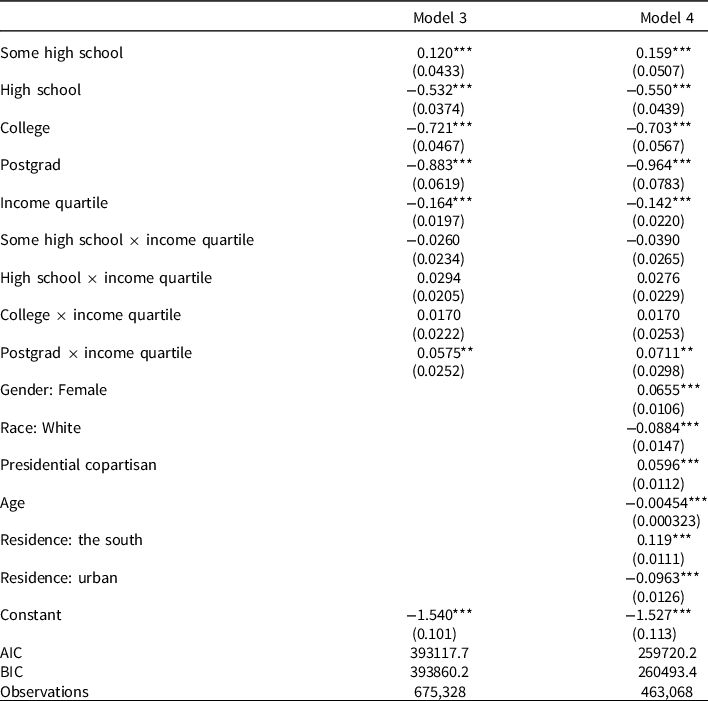
Note: Income quartile is treated as a continuous variable in the interaction for brevity in reporting. Standard errors in parentheses.
***p < 0.01, **p < 0.05, *p < 0.1.
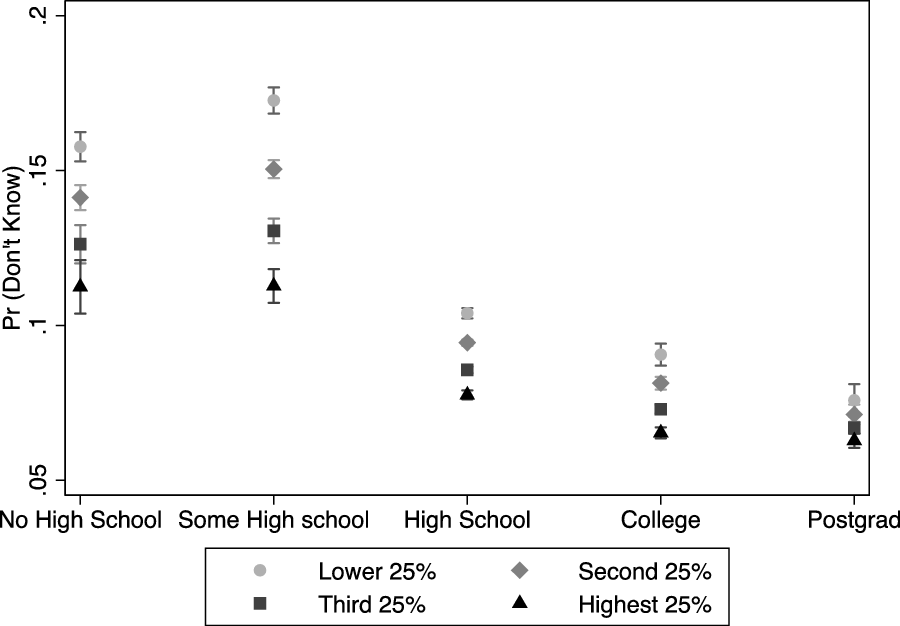
Figure 2. The effect of income level on policy prioritisation across education categories.
To begin with Table 1, Model 1 presents our baseline model with no control variables, whereas Model 2 includes our theoretically relevant controls. It is important to note that we lose about one-third of our observations when including the control variables, as many of the MIP surveys in the past did not include questions about residence (e.g. urban/rural) and racial background. As seen in the table, a relatively large number of factors seem to play a role in shaping policy prioritisation at the individual level. Income level is negatively associated with nonresponse, and it reaches statistical significance at the p < 0.001 level in both models. That is, lower-income individuals are more likely to give DK/no opinion responses to the MIP question, even after controlling for various important factors such as formal education. In substantive terms, a hypothetical change from the lowest income quartile to the highest income quartile leads to a 35% decrease in the probability of nonresponse, holding other variables constant at their means. Notably, a change from the lowest to the 2nd income quartile results in a 13% decrease in nonresponse probabilities. These changes in predicted probabilities are statistically significant at the p < 0.05 level.Footnote 8 These results lend empirical support to the hypothesis that income level is negatively associated with nonresponse.
Similarly, education level is negatively associated with item nonresponse (statistically significant at p < 0.001). Specifically, having completed high school education or above substantially decreases the likelihood of nonresponse in the MIP question. Table 1 also shows that various demographic characteristics predict nonresponse. White respondents are less likely, and women are more likely to say DK/no opinion when asked about the MIP facing the country, where the racial gap appears to be larger than the gender gap. Also, the likelihood of giving DK/no opinion responses to the MIP decreases as the age of the respondent increases. While we are unable to explain why this is the case given the nature of our data, such factors as social desirability bias may help us understand this particular finding (Karp and Brockington Reference Karp and Brockington2005). Respondents from southern regions are more likely and respondents residing in urban areas are less likely to give DK responses to the MIP. This particular finding points to the centre-periphery dynamics behind policy prioritisation and opinion expression.
Although the results reported in Table 1 provide insight into the various demographic and socio-economic factors that predict DK responses to the MIP question across decades, they do not tell us much about how income level interacts with education level to shape nonresponse. For example, the vast literature on political opinionation has shown that educational attainment and political sophistication are some of the most important predictors of DK/no opinion responses to policy attitude and preference questions. Accordingly, it may be the case that the income gap in opinion expression exists mostly among those at the bottom of the formal education scale. We test this proposition by estimating interactive models, which we report in Table 2. The table shows that the interactions between individual education categories and income level do not reach statistical significance at any conventional significance level (except for the postgraduate group).
To ease the interpretation of interactive effects, we also graphically illustrate the effect of income level across the categories of education level in Figure 2. As seen in the figure, the largest income-related gaps in opinion expression are among the least educated respondents (i.e. no high school and some high school), whereas the income-related gaps narrow as one goes from “no high school” to “post graduate”. However, the opinion expression gap between the lower 25% and the highest 25% is negligible only at the postgraduate level, which constitutes a small fraction of the respondents in the dataset. The fact that nearly three-quarters of the respondents fall within the “no high school”, “some high school” and “high school” categories suggests the prevalence of income-related differences in opinion expression in the broader public. To be more specific, the opinion-expression gap between the lower 25% and the highest 25% is similar among high school graduates and college graduates, and only marginally smaller among those with postgraduate degrees. All in all, the lack of statistical and substantive significance in the interactive effects reported in Table 2 and Figure 2 suggests that although the likelihood of giving DK answers in MIP questions is smaller among the better-educated groups, income-related gaps in DK answers are not mitigated by increasing formal education. This means that we do not find support for our second hypothesis, namely that increasing formal education alleviates the negative effect of economic hardship on opinion expression.
In addition to educational attainment, various other factors help explain DK responses to the MIP. Specifically, the results reported in Table 1 demonstrated that gender, race, the respondent’s residence, and copartisanship appear to be important explanatory factors. In the online appendix, we report additional interactive models that illustrate the effect of income level on DK responses across the values of these four variables. Figure A.4 shows that income gaps in opinion expression are consistent across both gender, racial and partisan groups, as well as across place of residence. More specifically, White and non-White respondents, men and women, those living in small towns and major cities, those identifying with the same party as the incumbent president and those identifying with the other party are not statistically distinguishable from one another. This implies that the documented income gaps cross cut other socio-economic and demographic divisions in opinion expression.Footnote 9
The MIP dataset also allows us to explore whether income gaps in DK answers have changed over time. In Figure A.1 in the Online Appendix, we illustrate the average marginal effects of the lowest and highest income levels on DK responses over time. The figure shows that the gap between the lowest and highest income quartiles in DK answers remained fairly constant for nearly 40 years for the period of 1960–2000. Starting from the late 1990s, the gap between the income levels has begun to shrink in size, primarily due to sharp increases in the highest income quartile’s DK answers. Importantly, the figure also shows that the likelihood of giving DK answers has tripled for both income quartiles. This is rather surprising, as one could expect to find decreasing rates of DK answers to MIP questions, thanks to easier access to information channels (e.g. social media), as well as increasing levels of education. While we are unable to delve further into this finding in the absence of additional data, we will touch upon some potential implications of this finding in the following section.Footnote 10
In the analysis above, we argued and showed that there are considerable income-related gaps in responses to the MIP questions, which have important implications for political science research. One way to demonstrate the effect of nonresponse bias on inferences about the public’s priorities is to account for item nonresponse in the analysis of the prioritisation of traditionally salient policy categories within the public.Footnote 11 By doing so, we will be able to show whether accounting for item nonresponse changes policy prioritisation patterns. However, it is worth discussing some of the assumptions that govern MI procedures. Although MI is increasingly used in political science research and is known to be superior to alternative solutions to missing data (King et al. Reference King, Honaker, Joseph and Scheve2001; Lall Reference Lall2016), it may be biased under certain circumstances. Given that missingness in our case can be predicted by observed data (e.g. income and education, among other variables), we assume that our data are missing at random (MAR), and it is therefore appropriate to utilise MI. Although it is no easy task to determine the mechanism of missingness and put its assumptions to test, Lall’s (Reference Lall2016, 419) recent observation strengthens our confidence in MI even under weaker MAR assumptions: “if the dataset contains one or more variables that are highly correlated with missingness, it is reasonable to assume that multiple imputation will perform almost as well as under (pure) MAR”.
Following insights from prior research (Allison Reference Allison2001; Enders 2010; White et al. Reference White, Royston and Wood2011), we employed MI and repeated the process of imputation 10 times (i.e. m = 10), based on which multiple datasets were created to reflect the uncertainty around the true value and then were combined for inference.Footnote 12 We followed this procedure for five policy categories (civil liberties, crime, welfare, health policy, education policy) separately, where we reported two models for each policy area, one original and one using MI, that predicted the prioritisation of given policy categories. If lower-income individuals, who tend to differ from higher-income individuals in priorities, are underrepresented in MIP responses, then accounting for missing values in MIP responses might change policy prioritisation patterns.
The results from imputed and original models are reported in Tables 3 and 4.Footnote 13 As seen in the tables, there are considerable differences in the coefficients of the income variable across models. As demonstrated in the tables, while the statistical association between income level and the prioritisation of given issues as the MIP was either relatively weak or nonexistent, the empirical models with MI demonstrate that the link is much stronger when missing responses are accounted for. Especially in the issues of civil liberties, education, and health policy, differences between the original and MI models are noteworthy. These results imply that the lack of statistically significant differences between income groups in the prioritisation of civil liberties, crime, welfare, education, and health policies in the original models may have been driven partly by nonresponse bias. In other words, if all lower-income individuals gave a response to the MIP question, we would find that lower-income individuals prioritise these issues at greater rates than higher-income individuals.
Table 3. Comparison of original results with multiple imputation (MI) results – civil liberties, crime and welfare
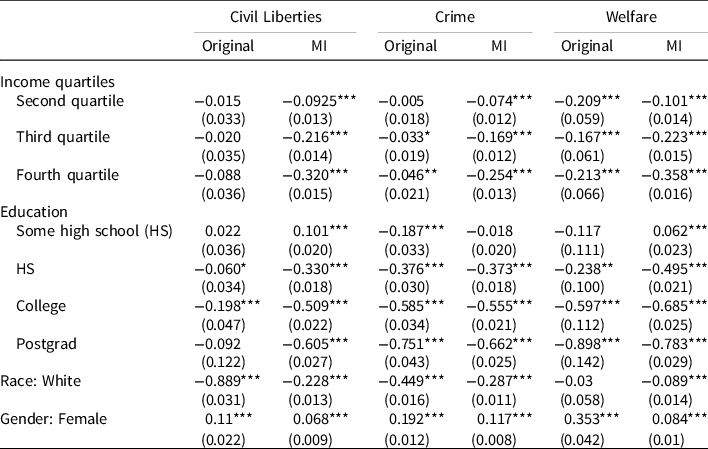
Note: We report only the key demographic and socio-economic variables for brevity. Standard errors in parentheses.
***p < 0.01, **p < 0.05, *p < 0.1.
Table 4. Comparison of original results with multiple imputation (MI) results: health policy and education policy
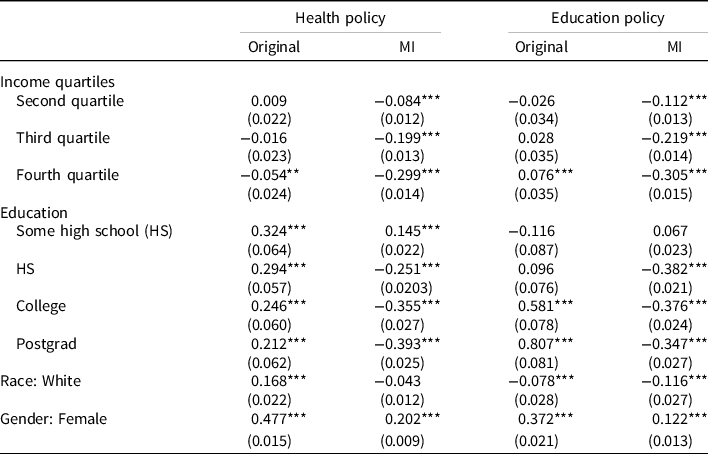
Note: We report only the key demographic and socio-economic variables for brevity. Standard errors in parentheses.
***p < 0.01, **p < 0.05, *p < 0.1.
Discussion
Berinsky (Reference Berinsky2004, 133) concludes his work on political participation with a powerful message: “In order truly to foster equality in participation – be it an opinion poll or writing to one’s member of Congress – we need to ensure that when citizens do speak, they speak with their interest in mind”. In the absence of descriptive representation in collective preferences, an essential component of representative democracy, what Jones and Baumgartner (Reference Jones and Baumgartner2005, 249) called the “signal detection system”, would work inefficiently, leaving the true needs and demands of politically disadvantaged groups unheard (Althaus Reference Althaus2003). Althaus (Reference Althaus1996, 18) once suggested that “representation problems may be as germane to opinion surveys as they are to elections… [as] public opinion polling elevates the clear wishes of the informed few over the muted, fragmented, and ill-communicated desires of the many”. Motivated by this observation, the present study shows that the poor diverge considerably from the affluent in the expression of policy priorities. While an examination of the potential implications of this particular finding for the quality of democratic processes goes beyond the scope of this study, we argue that the documented differences in opinion expression shed light on the extent of political engagement among lower-income people.
Nonresponse constitutes nearly 15.5% of all the MIP answers among the low-education and low-income respondents, compared with 8% among their high-education and high-income counterparts. This gap amounts to thousands of respondents in a dataset of several hundred thousands. To put it into context, DK/no opinion answers constituted the second most frequently mentioned category among the low-education and low-income group, dwarfing many of the traditionally salient policy categories including health care, agriculture, immigration, education, social welfare, international affairs, among others. In contrast, “DK/no opinion” was the fifth most commonly mentioned answer among the high-education and high-income group. This implies that we know little about the policy agendas of traditionally disadvantaged groups in society, and that accounting for nonresponse would change the ranking of policy categories substantially. Furthermore, the results from our imputed models imply that our understanding of socio-economic differences in policy priorities would change considerably if low-income and high-income individuals were equally likely to say DK/no opinion to the MIP question. This suggests important informational effects for the policymaking process, from the agenda setting to policy design stages.
Our findings call for a more nuanced treatment of item nonresponse in aggregate-level analyses of the public’s policy agenda. Most importantly, our results imply that discouraging DK/no opinion responses in preference and priority questions would hide a lot of information regarding the public’s true preferences and attitudes (Luskin and Bullock Reference Luskin and Bullock2011). If the lack of political awareness and interest constitutes an important challenge for the quality of representative democracy, then scholars of democracy need to extract as much information as they can from DK responses to better understand the factors that make particular groups of individuals hesitant to express their political opinion.
Our study is not without limitations. Most importantly, the research design employed in the present study does not allow us to delve further into causal mechanism behind nonresponse in MIP questions. We acknowledge that we are unable to distinguish between motivational reasons (e.g. interest in macro politics) and reasons related to efficacy (e.g. internal/external efficacy) behind nonresponse. Relatedly, while the MIP dataset allowed for a comprehensive analysis of DK/no opinion responses over a very long period of time, it required us to focus on only a handful of factors that are known to be associated with nonresponse due to lack of common variables across surveys. Finally, we are aware that our findings are drawn from a single case, which begs the question as to how far our findings can travel beyond the US case. Future research complementing the insights provided in the present study could focus on other political contexts where income inequality is less severe.
Supplementary material
To view supplementary material for this article, please visit https://doi.org/10.1017/S0143814X22000253
Data availability statement
Replication materials are available in the Journal of Public Policy Dataverse at https://doi.org/10.7910/DVN/CNWBMY.
Acknowledgements
We are grateful to the editor and three anonymous referees for their insightful and constructive comments. We also thank Ersin Kalaycioglu, Gulnur Kocapinar, Mert Moral, Brandon Beomseob Park, Laron K. William, and Oya Yegen, as well as seminar participants at University of Reading (UK) and Sabanci University (Turkey).
Financial support
There are no financial commitments to disclose.
Conflict of interests
The author(s) declare none.


 Open access