


Introduction
Immigration has changed the makeup of the United States population from having a predominantly white to a more ethnically diverse population. For example, according to the 2019 Current Population Survey (CPS), immigrants and their U.S.-born children now number approximately 90 million people, or 28 percent of the overall population (Zong and Batalova Reference Zong and Batalova2020). Between 2014 and 2060, the population is projected to increase from 319 to 417 million (Colby and Ortman Reference Colby and Ortman2015). While the native-born population is expected to increase by 62 million people, reaching 339 million in 2060, the foreign-born population is expected to grow from 42 to 78 million in the same period. People with different ethnic backgrounds have different diets, and this growing diversity of the population is likely to cause diet-related health issues (Hiza et al. Reference Hiza, Casavale, Guenther and Davis2013; Dunn, Sharkey, and Horel Reference Dunn, Sharkey and Horel2012; Lin et al. Reference Lin, Buzby, Anekwe and Bentley2016; Tichenor and Conrad Reference Tichenor and Conrad2016).
Few studies have investigated the effects of time of residency on different ethnic groups of immigrants’ food consumption. Satia-Abouta et al. (Reference Satia-Abouta, Patterson, Neuhouser and Elder2002) found that immigrants to the United States gradually adopted U.S. dietary patterns, which tend to be high in fat and low in fruits and vegetables, as the time of residency in the U.S. increased. Similarly, Goel et al. (Reference Goel, McCarthy, Phillips and Wee2004) found that after being in the U.S. for 10 years, the Body Mass Index (BMI) increased across the immigrant subgroups, and the prevalence of obesity among immigrants living in the U.S. for at least 15 years approached that of native-born adults. Hence, they suggested that early intervention with diet and physical activity represents an opportunity to prevent obesity and obesity-related chronic illnesses. For Spain, Marin-Guerrero et al. (Reference Marín-Guerrero, Rodríguez-Artalejo, Guallar-Castillón, López-García and Gutiérrez-Fisac2015) examined the length of residency effect on Latin American immigrants, reaching the conclusion that a longer duration of residence was associated with both healthy and unhealthy changes in eating habits. Specifically, the intake of sugary beverages decreased, while the intake of saturated fat, fiber, olive oil, vegetables, and fish increased.
To effectively combat detrimental food choices and related health nutrition problems, policy makers and nutrition educators with food assistance programs need detailed knowledge about the specific food behaviors of different ethnic groups. Understanding of healthy habits particular groups of immigrants already have and are at risk of losing through acculturation can inform development of targeted educational and food assistance programs, such as food packages for The Special Supplemental Nutrition Program for Women, Infants, and Children (WIC) (USDA 2019) and the school lunch menus for The National School Lunch Program (NSLP) to meet the different nutrition needs of the different ethnic groups of immigrants.
We have three research objectives. First, the differences in the consumption of five selected food groups: (1) milk, (2) meat, (3) processed meat, (4) fruits, and (5) vegetables among people who are born in the U.S. and immigrants are investigated. According to the National Health and Nutrition Examination Survey (NHANES), the five food groups account for more than 50 percent of all the foods consumed in the U.S. and are widely consumed among all ethnic groups. Consumption changes in the five food groups could provide information on immigrants’ acculturation and dietary changes across ethnic groups.
Second, we investigate the differences in diets among Asians, blacks, Hispanics, and non-Hispanic whites who are born in the U.S. and the corresponding immigrant groups. Third, the effects of the time of residency in the U.S. on the diets among ethnic groups of immigrants are investigated. A censored gamma regression model was developed to control for key covariates, which frequently are not controlled for in studies of immigrants’ food choices (Satia-Abouta et al. Reference Satia-Abouta, Patterson, Neuhouser and Elder2002; Goel et al. Reference Goel, McCarthy, Phillips and Wee2004). The model was used to simulate the expected probability of consumption and the expected daily consumption of five food groups.
Data
NHANES is an ongoing nationally representative survey of the noninstitutionalized civilian resident population in the 50 states and the District of Columbia of the United States. The survey uses multiyear sampling strategies and publishes the data every two years. In addition to information on individuals’ health and nutrition status, the survey includes a dietary intake module known as What We Eat in America (WWEIA). Individuals participating in this module complete two 24-hour dietary recalls on nonconsecutive days. They recall a detailed description of each food and beverage consumed and the consumption amounts. This information can be further matched with an individual's age, ethnicity (race), household income, education, and other demographic characteristics as captured in the broader NHANES.
Multiple cycles of NHANES were used to estimate the model conditional on the covariates shown in Table 1. The covariates assumed to influence diets were the following: log of age, age squared, log of years in the U.S., log of individual income, and indicator variables for marital status, gender, education, and ethnicity. Our data sample consists of adults from 20 to 80 years of age. Table 1 shows that the average (weighted) age is 42.94 years. To construct an income variable which is comparable between households of different size in different years the following procedure was used: The original survey question consisted of 15 different intervals of household income. First, we set household income to the midpoint value of each interval. Then, for each individual, we divided the household income by the square root of the number of people in the household (OECD 2008). Finally, the income variable was deflated by the national consumer price index for the survey year. The income variable may then be interpreted as (an index of) the log of real individual income. Further, in our data, 64 percent are married, 48 percent are male, 18 percent have less than high school education, 24 percent has finished high school, and 58 percent has college education. Eighty-five percent of our sample was born in the United States.
Table 1. Summary Statistics
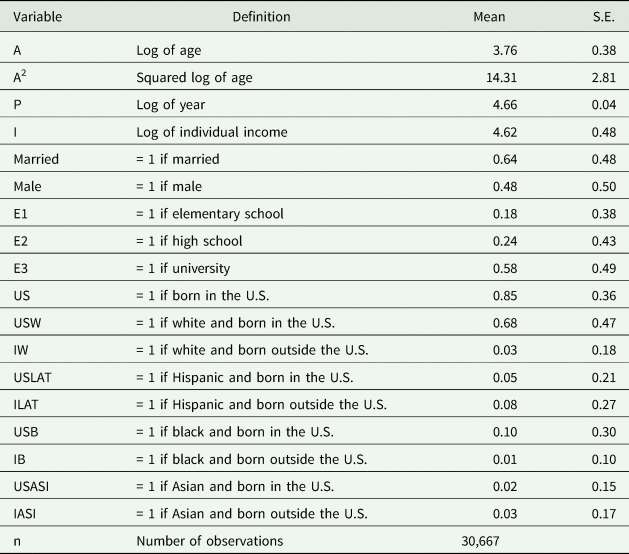
Note: Included participants are 20 years or older. The mean and the standard errors are weighted with the NHANES sampling weights.
Each year about 5,000 individuals participated in the NHANES. A total of 30,667 respondents who were 20 years or older were included to estimate the association between ethnicity and diets using seven cycles from the NHANES surveys: 1999–2000, 2001–2002, 2003–2004, 2005–2006, 2007–2008, 2009–2010, and 2011–2012. More details of the NHANES database are described in the National Center for Health Statistics (2013).
Histograms (Figure 1) of daily per capita consumption of milk, meat, processed meat, fruits, and vegetables show that, in our data, large shares of respondents did not consume each of the food types on the days of the survey, i.e., there are mixtures of two distributions: one for the consumed quantities of a food and another for non-consumption of the food. In addition, all the histograms are skewed to the right. This indicates that the daily food consumption is censored gamma distributed. From Table 1 we note that 85 percent of our sample was born in the United States, and the largest group born in the U.S. is whites. The largest immigrant group is Hispanics, comprising about 8 percent of the sample.

Figure 1. Histograms of Daily per Capita Consumption
The (weighted) shares of respondents who consumed the different food groups on a daily basis are shown in Table 2. About half the U.S.-born (51 percent) drank milk every day, while 56 percent of the immigrants did so. More people born in the U.S. (81 percent) than immigrants (75 percent) consumed meat every day. The consumption rate of processed meat was also higher among U.S.-born people (45 percent) than immigrants (40 percent). The rates were lowest among Hispanic immigrants (36 percent) and black immigrants (40 percent). A larger share of immigrants (74 percent) than U.S.-born (62 percent) consumed fruits every day. The rate of daily vegetable consumption of all respondents was between 82 percent and 89 percent.
Table 2. Share of Respondents who Consumed the Food Groups on a Daily Basis
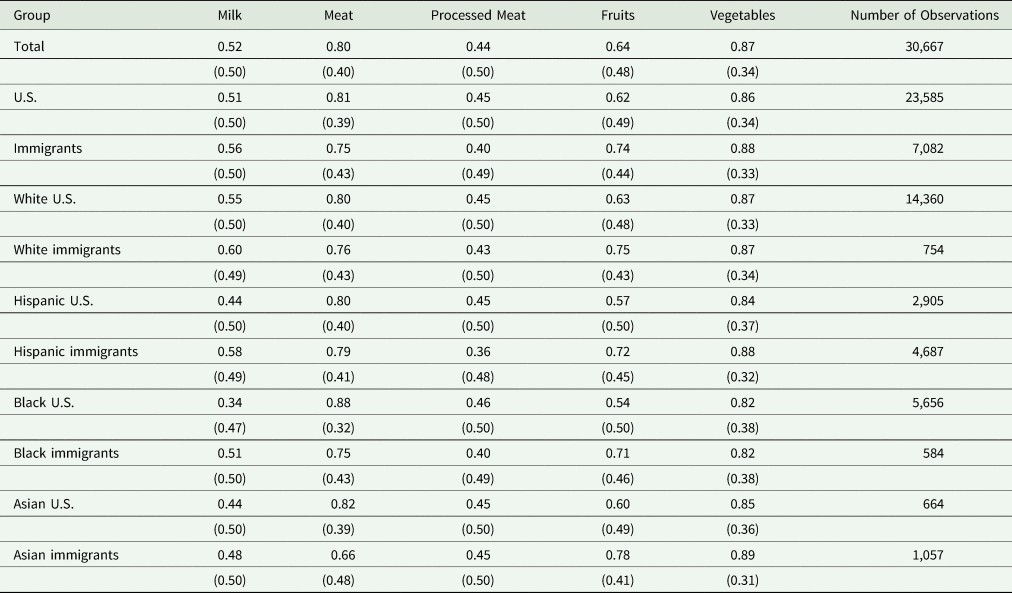
Note: The standard deviations are printed in the parentheses. The mean and the standard deviations are weighted with the NHANES sampling weights. These weights incorporate adjustments for unequal selection probability, non-responses, and corrections for age, sex, and ethnicity categories.
There were also many substantial differences in the consumption between U.S.-born and immigrants for many ethnic groups. For example, the rate of daily consumption of milk was 17 percentage points higher among blacks immigrants than among blacks born in the U.S., daily meat consumption was 13 percentage points higher among blacks born in the U.S. than among black immigrants, daily processed meat consumption was 11 percentage points higher among Hispanics born in the U.S. than among Hispanic immigrants, and daily fruit consumption was 18 percentage points higher among Asian immigrants than Asians born in the U.S. Such differences indicate that several immigrant groups are at risk of getting a less healthy diet.
The daily (weighted) average consumption of each food category by each ethnic group is shown in Table 3. The consumption of milk was higher among U.S.-born (144 grams) than immigrants (132 grams). U.S.-born whites had the highest milk consumption (157 grams), while U.S.-born blacks had the lowest (70 grams). Meat consumption was also higher among U.S.-born (93 grams) than immigrants (82 grams). blacks born in the U.S. had the highest consumption (120 grams), while Asian immigrants consumed the least (62 grams). Immigrants consumed less processed meat (76 grams) than U.S.-born (86 grams). However, Asian immigrants had the highest consumption of processed meat (92 grams), while Hispanic immigrants had the lowest (66 grams). Fruit consumption was substantially higher among immigrants (192 grams) than U.S.-born (132 grams). White immigrants consumed more than twice as much fruit (234 grams) as Hispanics born in the U.S. (113 grams). The consumption of vegetables was also higher among immigrants (155 grams) than U.S.-born (134 grams). White immigrants had the highest vegetable consumption (173 grams), while blacks (107 grams) and Asians (108 grams) born in the U.S. had the lowest consumption.
Table 3. Daily Average Consumption of Food Groups Across Ethnic Groups
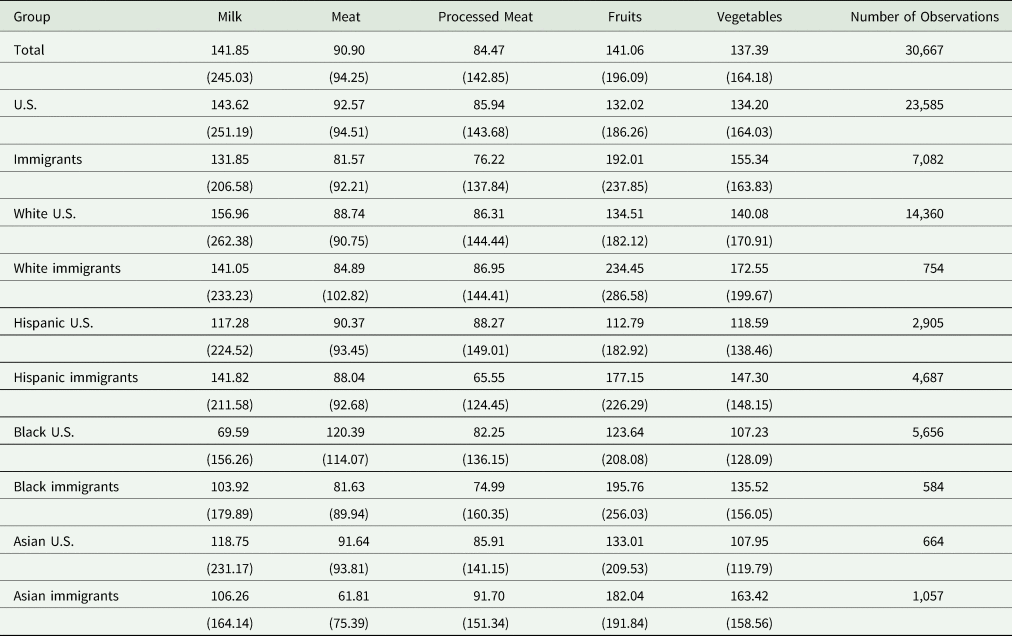
Note: Consumption is measured in grams. The standard deviations are printed in the parentheses. The mean and the standard deviations are weighted with the NHANES sampling weights. These weights incorporate adjustments for unequal selection probability, non-responses, and corrections for age, sex, and ethnicity categories.
Several immigrant groups seem to be at risk of getting a less healthy diet after some time of residency in the U.S. For example, the consumption of milk was 34 grams higher among black immigrants than among blacks born in the U.S., meat consumption was 39 grams higher among blacks born in the U.S. than among black immigrants, processed meat consumption was 23 grams higher among Hispanics born in the U.S. than among Hispanic immigrants, fruit consumption was 100 grams higher among white immigrants than whites born in the U.S., and vegetable consumption was 32 grams higher among white immigrants than among whites born in the U.S.
Econometric Model
For each food group, we estimated the probability of consumption and the daily consumption. As discussed above, the distribution of the daily consumption of each food group is skewed to the right and censored at zero. Hence, the daily consumption of each group is not normally distributed, and the use of Tobit type censored regression models could produce inconsistent results (Pagan and Vella Reference Pagan and Vella1989; Lee Reference Lee1996). Consequently, we estimated a generalized linear model with a zero-adjusted gamma distribution (Rigby and Stasinopoulos Reference Rigby and Stasinopoulos2005; Tong, Mues, and Thomas Reference Tong, Mues and Thomas2013). The gamma distribution is part of the exponential family of probability distributions, which typically are used to construct generalized linear models (GLM).Footnote 1
Our response variable, y is assumed to follow a gamma distribution when it is positive. The gamma distribution is given by:

where the parameters α > 0 and β > 0, and Γ(α) is the gamma function. The mean of y is given by:

and the variance of y is given by:

Equations (1), (2), and (3) are used to reparametrize the gamma distribution to be a function of μ and σ 2, such that:

We assume a log link function, which ensures non-negative predictions:

where ${x}^{\prime}_1\beta _1$ is the linear predictor in the gamma regression model.
To take account of the censoring in our data, we include a probability term, π, defined as the cumulative of a logistic distribution:

For 0 ≤ y < ∞ the model is given by:

Equations (5) to (7) are the GLM model with the zero adjusted gamma (ZAGA) distribution. The associated likelihood function is given by:

The conditional expectation of the outcome variable of Equation (2) becomes:

To investigate the effects of time of stay since immigration to the U.S, we calculate the expected difference in probability and consumption level between an immigrant who has been in the U.S. for less than a year, and an immigrant who has been in the U.S. for five years. We chose a five-year time span given that this would generally be considered enough amount of time to adjust to the U.S. food culture. Let $\hat{{\it π} }_{ij5} = \lsqb {1-{\hat{{\it π} }}_{ij}\lpar {{\bar{x}}^{\prime}}_{\! 2}{\hat{\beta }}_2\vert {\rm time}\, = 5\;{\rm years}\rpar } \rsqb$ and $\hat{{\it π} }_{ij1} = \lsqb {1-{\hat{{\it π} }}_{ij}\lpar {{\bar{x}}^{\prime}}_ {\! 2}{\hat{\beta }}_2\vert {\rm time}\;\lt 1\,{\rm year}\rpar } \rsqb$
 . Then, for each food and ethnic group, we calculate the difference in the predicted probability, $\Delta \hat{{\it π} }$
 , and consumption level, $\Delta \hat{\mu }$
 , as:
, as:

and

where $\bar{x}_1\;{\rm and}\;\bar{x}_2$ are the vectors of mean values of the regressors in Equations (5) and (6) and the ethnic dummy variables are set to either zero or one.
The model was estimated by using the covariates in Table 1 and the R package GAMLSS. To calculate the standard errors, we used a nonparametric bootstrap. In each bootstrap repetition, the probability of positive consumption and consumption level were predicted. This procedure was repeated 500 times, and the covariance matrix between the predictions was used to create the standard errors and t-statistics of the expected probabilities and consumption levels.
Results
Differences between Immigrant Groups and Their U.S.-Born Counterparts
Food consumption is likely to vary among ethnic groups before immigration to the United States. These differences may reflect differences in dietary needs as well as differences in food culture and habits in their originating countries. To investigate such differences, we tested for significant differences in the expected probabilities and consumption levels among ethnic groups born in the U.S., among ethnic groups of immigrants, and between immigrant groups and their U.S.-born counterparts. The results are shown in Table 4. More than half of the 104 tested differences among the ethnic groups born in the U.S. were significant. There were many significant differences for milk but few for processed meat. For immigrants, more than half of the differences were significant, and there were many significant differences for each group of food. Food consumptions were also significantly different between immigrants and their U.S.-born counterparts across all ethnic groups.
Table 4. T–Values for Tests of No Difference in the Expected Probabilities of Consumption and Consumption Levels
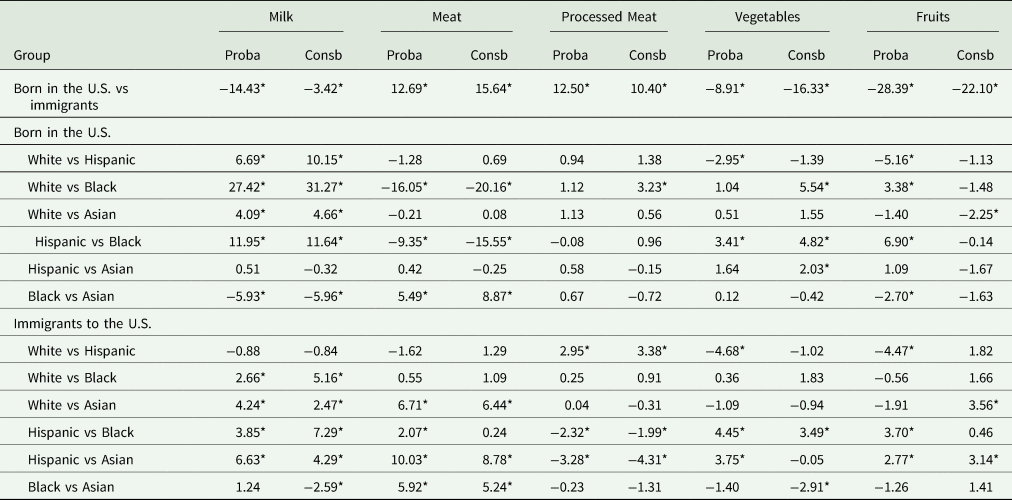
Note: An asterisk indicates a significant value at the 5% level of significance.
a T–values for tests of no difference in the expected probability of a positive consumption for various ethnic groups.
b T–values for tests of no difference in the expected consumption for various ethnic groups.
To further compare the differences, the expected probabilities of daily consumption and the per capita expected consumption in grams per day are calculated and presented in Table 5. It appears that immigrants had a healthier diet than the U.S.-born population, with a lower consumption of meat and processed meat and a higher consumption of milk, fruits, and vegetables. In many cases, the differences between the unconditional values reported in Tables 2 and 3 and the expected values are small. However, there were several notable differences between these values. For example, immigrants had higher milk consumption than people born in the U.S., the highest probability of milk consumption was among Hispanic immigrants, the highest consumption of processed meat was among whites born in the U.S., the highest probability of vegetable consumption was among Hispanic immigrants, the highest vegetable consumption was among Asian immigrants, and the highest probability of consumption of fruits was among Hispanic immigrants.
Table 5. Expected Probabilities of Consumption and Expected Consumption Levels of Food Groups Across Ethnic Groups
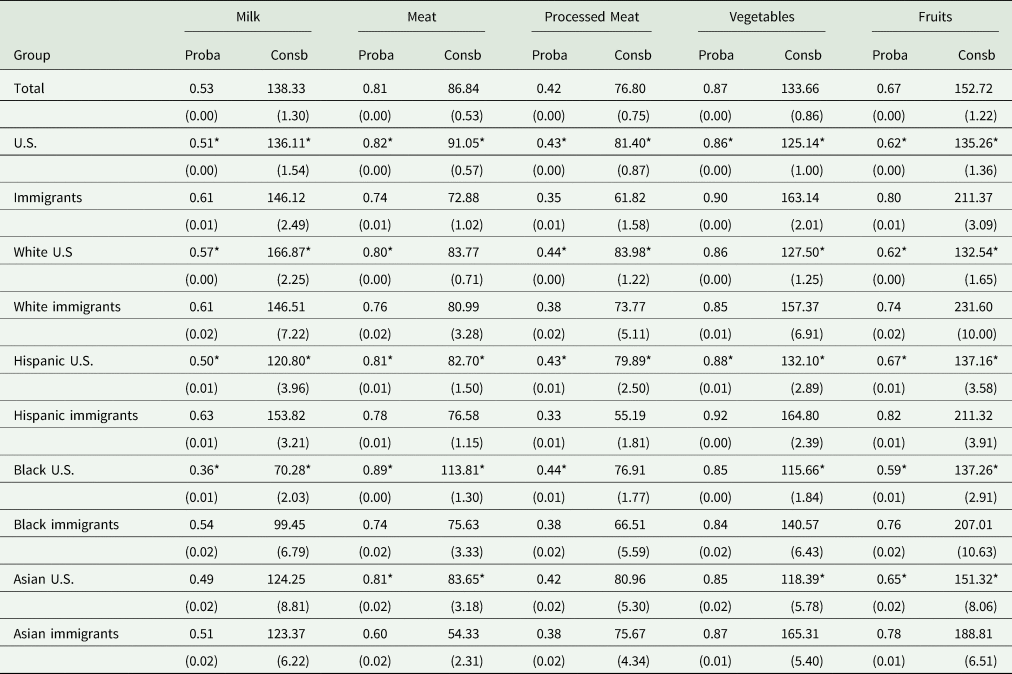
Notes: Standard errors are printed in the parentheses. An asterisk denotes that a t-test either for the hypothesis: “H0: There is no difference in the probability of consumption within the group among those born in the U.S. and those born outside the U.S.” or the hypothesis: “H0: There is no difference in the consumption level within the group among those born in the U.S. and those born outside the U.S.” is rejected at the 5% level of significance.
a The expected probability of a positive consumption.
b The expected consumption in grams per day.
Each immigrant group had a higher probability of fruit consumption and higher average consumption of fruits and vegetables than the corresponding groups born in the U.S. Identical probability of vegetable consumption was rejected for Hispanics but not for the other groups, and Hispanic immigrants had a higher probability of consuming vegetables than Hispanics born in the U.S. Asian immigrants and Hispanic immigrants had the highest expected consumption of vegetables. U.S.-born blacks had the lowest vegetable consumption. Interestingly, white immigrants had the highest expected fruit consumption, but whites born in the U.S. had the lowest expected consumption of fruit. Except for Asians, each of the immigrant groups had a higher probability of milk consumption than the corresponding groups born in the U.S. Hispanics and blacks had higher expected milk consumption among immigrants than among those who were born in the U.S.; however, the expected milk consumption among U.S.-born whites was significantly higher than among white immigrants. For all ethnic groups except Asians, people who were born in the U.S. had higher expected probabilities to eat meat and processed meat than immigrants in the corresponding ethnic group. Asian immigrants had a lower probability of eating meat but not of eating processed meat. Hispanics, blacks, and Asians born in the U.S. also had significantly higher consumption levels of meat than the corresponding immigrant groups. Finally, U.S.-born whites and Hispanics had higher consumption levels of processed meat than the corresponding immigrant groups.
The Effects of Time of Residency in the U.S. on Diets of Immigrant Groups
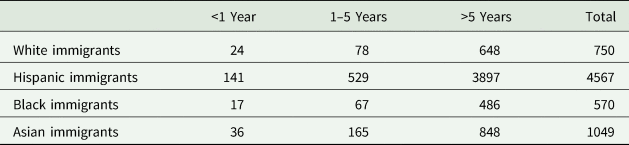
The log of the number of years since arrival in the U.S. was included as a control variable, and the probabilities and consumption levels as functions of the time of residency were predicted. The expected differences in probabilities and consumption levels between immigrants who had been in the U.S. for less than one year and immigrants who had been in the U.S. for five years are summarized in Table 6. Information on the number of people for “<1 year residency”, “≥5 years residency”, and the remaining within each ethnicity group and within the total is also provided in Table 7. The results show significant differences in the expected probabilities of consumption of meat, vegetables, and fruits and in the consumption levels of meat and fruits for immigrants as a group.
Table 6. Differences in Expected Probabilities of Consumption and Expected Consumption Levels Between Immigrants with Less Than One and Five Years of Residency
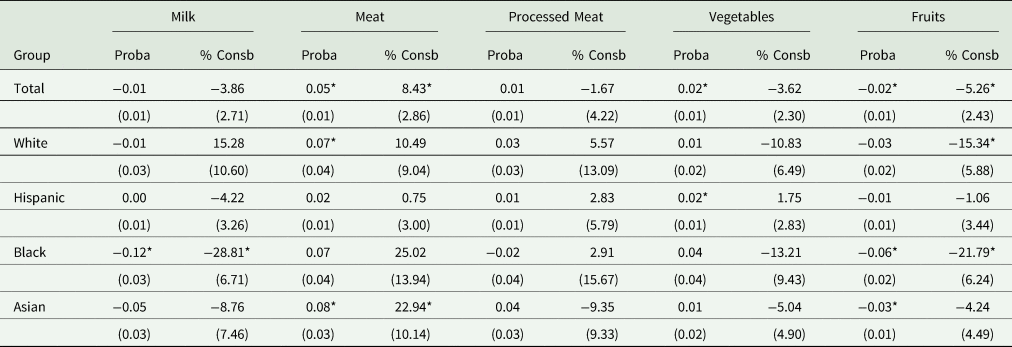
Notes: Standard errors are printed in the parentheses. An asterisk denotes that a t-test either for the hypothesis: “H0: There is no difference in the probability of consumption between immigrants with less than one year and with five years of residency” or the hypothesis: “H0: there is no difference in the consumption level between immigrants with less than one year and with five years of residency” is rejected at the 5% level of significance.
a The difference in expected probability of a positive consumption between immigrants who have been in the U.S. for less than one year and immigrants who have been in the U.S. for five years.
b The expected percentage difference in consumption between immigrants who have been in the U.S. for less than one year and immigrants who have been in the U.S. for five years.
Table 7. The Number of Immigrants by Ethnicity and Length of Stay in the U.S.
The annual effects of one to ten years of residency relative to a newly arrived immigrant are shown in Figure 2. The top-row panels show results for milk. The probabilities of milk consumption and the consumption levels were declining over time for blacks and Asians, were stable for Hispanics, and were increasing for whites. Given the reported differences in Table 5, these results indicate a convergence for whites and blacks, staggering for Hispanics, and a small divergence for Asians. As shown in Table 6, the differences between recent black immigrants and black immigrants with five years of residency were significant and quite substantial. blacks reduced their probability of consuming milk by 12 percentage points and reduced their milk consumption by nearly 30 percentage points over the five-year period. Given the relatively low milk consumption among blacks in the U.S., these reductions may be less healthy.
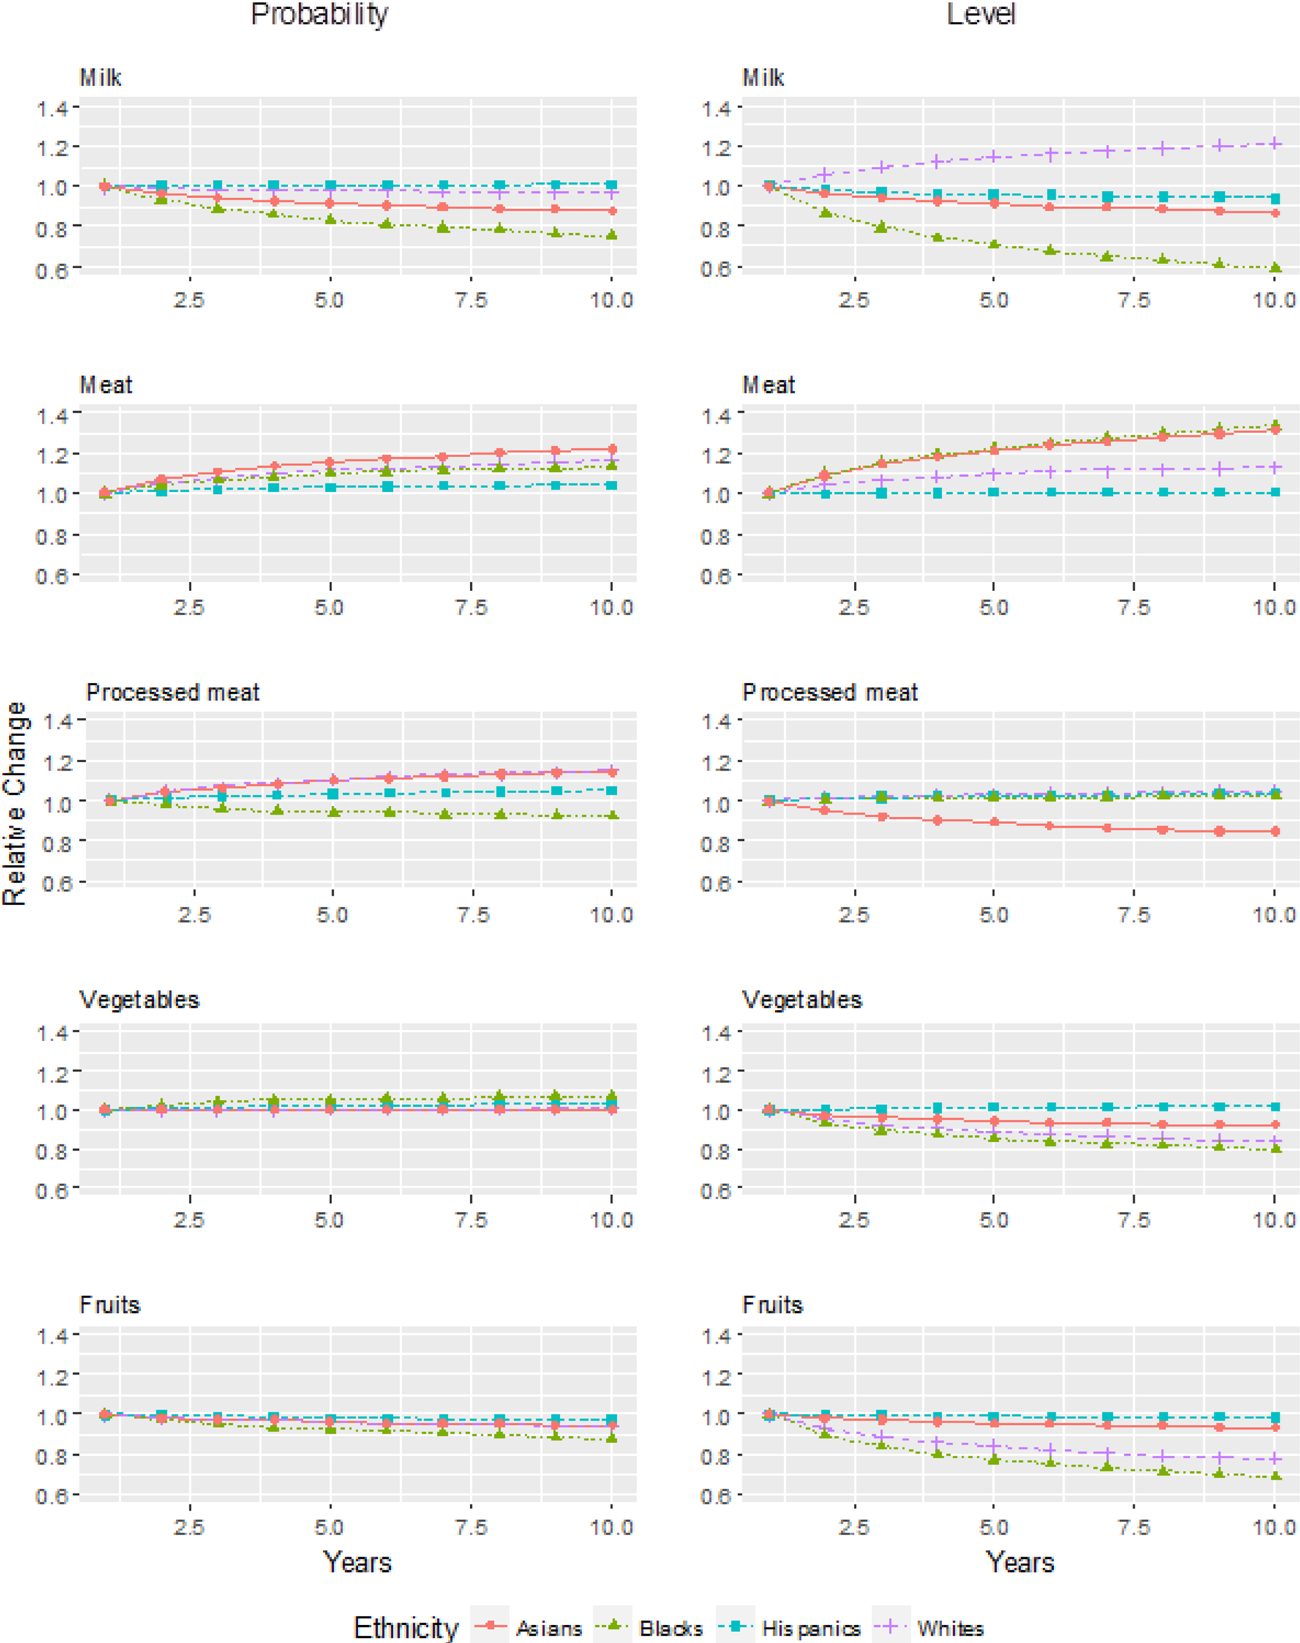
Figure 2: Effects of Time in the U.S. on Probabilities and Consumption Levels Relative to an Immigrant Who Has Recently Arrived in the U.S.
The second-row panels of Figure 2 show that the probabilities of meat consumption and the consumption levels increased over the time for all groups except Hispanics. Given the differences between immigrants and U.S.-born reported in Table 5, these increases indicate a convergence in meat consumption for all groups except Hispanics. Table 6 shows that whites increased their probability of meat consumption by 7 percentage points and Asians by 8 percentage points. Asians increased the level of meat consumption with 23 percentage points. Given the high meat consumption among U.S.-born, these increases are not healthy.
The third-row panels of Figure 2 indicate relatively minor changes for processed meat. The probabilities were slightly increasing for Asians and whites. However, the increased probability of consuming processed meat among Asians was offset by a reduced level. Unlike Asians, whites kept the same consumption level over time. So, an increase of consumption probability given an already high consumption of processed meat among whites is unhealthy.
The fourth-row panels of Figure 2 show relatively stable probabilities of vegetable consumption and decreased consumption levels for all groups except Hispanics. Hispanics kept their consumption level stable over time. Given the differences between immigrants and U.S.-born reported in Table 5, the reduced vegetable consumption indicates a convergence for all immigrant groups except Hispanics. As shown in Table 6, there was a 2-percentage point increase in the probability of vegetable consumption among Hispanics after five years. This is a healthy increase; however, the reduced levels among all immigrant groups may give cause for some concern, even though the differences were not significant after five years.
As shown in the bottom-row panels of Figure 2, the probabilities and levels of fruit consumption were declining for all groups. The declines in the level of consumption among blacks and whites were large. Given the reported differences in Table 5, these results indicate a convergence in fruit consumption among all groups, possibly except for Hispanic. As shown in Table 6, the probabilities of fruit consumption decreased by 6 percentage points among blacks and 3 percentage points among Asians. Whites and blacks reduced their consumption level by 15 and 22 percentage points, respectively.
Discussion and Conclusions
The United States has frequently been described as a country of immigrants, given its historically and ethnically diverse population. With this diversity comes heterogeneity in dietary behaviors and consequences in terms of health disparities. Knowledge about differences in diets across different ethnic groups and between those born in the U.S. and immigrants provides insight into understanding health disparities between ethnic groups and also in the design of nutritional education and food assistance programs for more vulnerable groups of the population.
Several key results emerge. First, there are significant differences in the expected probability of daily consumption and the average daily consumption for all the five selected food groups among immigrants and people born in the U.S. Immigrants consume less meat and processed meat and more milk, fruits, and vegetables than U.S.-born, which indicates a relatively healthier diet among immigrants.
Second, there are many differences in the diets among the four ethnic immigrant groups and the corresponding groups born in the U.S. These differences suggest that it is fruitful to divide the population into broader ethnic groups to highlight differences regarding healthy and less healthy diets. For example, there is a relatively high probability of daily consumption and a relatively high consumption level among blacks born in the U.S. for meat. For processed meat, there is a relatively high consumption level among whites born in the U.S. and among Asian immigrants, while for fruits, there is a relatively low probability of consumption among blacks born in the U.S., and the consumption level is relatively low among Hispanics born in the U.S. For vegetables, the consumption levels are relatively low among blacks and Asians born in the U.S.
Third, there are significant differences in the expected probability of consuming meat, vegetables, and fruits and in the consumption levels of meat and fruits between immigrants who have been in the U.S. for less than one year and immigrants who have been in the country for five years. There is an increased probability of meat consumption and an increased meat consumption, while the probability of consuming fruits and the fruit consumption are reduced. The directions of these changes indicate that immigrants gradually adopt a U.S. dietary pattern as their time in the U.S. increases and correspond well with an acculturation hypothesis as discussed in Satia-Abouta et al. (Reference Satia-Abouta, Patterson, Neuhouser and Elder2002).
Fourth, there are different effects of the time of residency on the different ethnic groups who have been in the U.S. for less than one year and immigrants who have been in the country for five years, which may indicate less healthy convergences in consumption. Whites have an increased probability of meat consumption and a reduced fruit consumption, blacks have reduced probabilities of milk and fruit consumption and reduced consumption of milk and fruits, and Asians have an increased probability of meat consumption and an increased meat consumption.
Our findings have some implications for food and health policies, given that the diets of U.S.-born respondents are generally correlated with high obesity rates. For example, unhealthy convergences of immigrants’ diets could be reversed with some interventions during the first few years of immigrants’ stay in the U.S. These interventions, for instance, could be reflected in school and food assistance programs, such as NSLP and WIC, which are utilized by many new immigrants. This may give nutrition educators working with food assistance programs an opportunity to work with immigrants during their first few years in the U.S., before they change their diets and adopt less healthy ones, mitigating or even reversing the convergence of their diets towards those of their U.S.-born counterparts.
We have examined dietary variation among immigrant ethnic groups and their U.S.-born counterparts. However, dietary variation may also exist across residential areas in the U.S. where immigrants choose to stay. Given limited data accessibility, we were not able to examine the influences of community and neighborhood environment on diets and acculturation of immigrants. Immigrants may choose a community to live according to their ethnicity, which can impact their lifestyle, including food consumption. Future research may examine the influence of variables such as neighborhood environment, social network, food-away-from-home accessibility, grocery shopping environment on the dietary changes and the outcome of acculturation of immigrants. Such research may help explain how the food environment affects dietary changes among immigrant ethnic groups after they move to the U.S. Future research should also test the robustness of our findings by including the more recent years of the NHANES data in the analysis.
Disclaimer
The findings and conclusions in this article are those of the authors and should not be construed to represent any official USDA or U.S. Government determination or policy.
Funding Statement
This research was supported by the intramural research program of the U.S. Department of Agriculture, Economic Research Service and by the Norwegian Research Council, grant 233800/E50.


 Open access