


Chronic non-communicable chronic diseases (NCD) are the leading cause of death globally and present a major health and development challenges(1). Dietary factors are responsible for a large share of non-communicable diseases, including CVD, obesity, type 2 diabetes mellitus and cancers(Reference He, Li and Yang2–Reference Chlebowski, Aragaki and Anderson5). In China, suboptimal diet is one of the major contributors to mortality and chronic diseases in China, highlighting the necessity of public health nutrition and policy strategies to improve diet quality(Reference He, Li and Yang2,Reference Nakamura, Okuda and Okamura6) .
The energy demands of the human body are mainly provided by three macronutrients (protein, fat and carbohydrates); a balanced energy percentage of these macronutrients is essential to good health. There is evidence that various macronutrient compositions in diets, particularly in terms of food sources and macronutrient types, have been documented to affect total daily energy intake and human health(Reference Mazidi, Kengne and Vatanparast7). Over the past few decades, the rapid development of China’s economy and food processing sectors has also resulted in quick changes in diet structure in the Chinese population. Evidence has shown the industrial food era which encouraged the increased consumption of animal foods, processed foods, sugar-sweetened beverages, and ultra-processed foods high in energy, fat, sugar, and salt (HEFSS)(Reference Li and Shi8–Reference Batis, Sotres-Alvarez and Gordon-Larsen10). Additionally, switching from a very high carbohydrate diet to one that is relatively high fat when adopting a Western diet has significantly altered the macronutrient composition of Chinese diets(Reference Adair, Gordon-Larsen and Du11,Reference Batis, Sotres-Alvarez and Gordon-Larsen12) . However, studies on trends in macronutrient composition over time are still limited in China, particularly their subtypes and food sources of macronutrients.
In order to examine trends in the percentage of energy derived from macronutrients, the main food sources are carbohydrate, protein and fat, and the overall dietary quality for Chinese adults ranges from 1991 to 2015. This study makes use of longitudinal data from the China Health and Nutrition Survey (CHNS, 1991, 2000, 2009, 2015).
Material and method
Study design and population
The CHNS, an ongoing large-scale study aimed at determining the relationship between China’s social and economic development and its consequences on the country’s population’s health and nutritional status, provided all of the data used in this study. The study used a multistage, random cluster process to draw the sample from the original eight provinces (Jiangsu, Hubei, Hunan, Guangxi, Guizhou, Liaoning, Shandong and Henan), and communities were selected randomly as the primary sampling units. It used a weighted sampling scheme to select four counties and two cities in each province randomly, and villages, urban areas and suburban areas were also selected randomly. Twenty households were randomly selected within each community, and all household members were interviewed. The CHNS rounds were completed in 1989, 1991, 1993, 1997, 2000, 2004, 2006, 2009, 2011, 2015 and 2018. Beginning in 2011, the CHNS included the additional provinces of Beijing, Shanghai and Chongqing, and in 2015 it included additional provinces of Shanxi, Yunnan and Zhejiang. These provinces vary in demography, geography, economic development and public resources. The procedure has been described in detail elsewhere(Reference Popkin, Du and Zhai13).
Data from each round of the survey were examined cross-sectionally. However, the primary purpose of this study is to track the trends in Chinese residents’ consumption of macronutrient intake in Chinese resident every almost 10 years. As the processing of the 2018 data is still ongoing, we chose the 2015 most recent data for analysis. The study population included adults aged 18 years or older (10 440, 12 601, 10 255 and 17 161) with complete data on three consecutive 24-h dietary recalls in each wave survey, which were conducted in 1991, 2000, 2009 and 2015 (9287, 10 509, 9925 and 14 689). Due to the significant changes that occur during pregnancy and lactation, we have decided to exclude pregnant and nursing women. 44 203 participants were included in the analysis of the primary outcome as a result (9251, 10 491, 9912 and 14 549). The CHNS study protocol was approved by the Institutional Review Committees of the University of North Carolina at Chapel Hill, the National Institute for Nutrition and Health, and the Chinese Center for Disease Control and Prevention (No. 201524-1). All participants gave their written informed consent before taking the survey.
Dietary assessment
In each wave of the CHNS, we evaluated food consumption at the individual level using three consecutive 24-h dietary recalls in each wave of the CHNS. The dietary recalls primarily recorded the type and amount of intake, type of meal, and location for all food items consumed at the individual level. It also gathered data on home cooking oil and condiment consumption of all family members using a household food inventory weighing method over the course of the same 3 d. Based on the sum of the dietary data and the categorisation of the foods obtained from the dietary recalls using the food codes in the China Food Composition Table, we calculated the mean daily intake for each food group based on this information. The percentage of oil and condiments was calculated from the household inventory for each member as the ratio of their individual energy intake and to the energy intake of all members combined. Before interviewing the participants, all health workers underwent a thorough training.
On the basis of the China Food Composition Table(Reference Yuexin and Xingchang14), we estimated the major food groups and nutrients and calculated the mean of total energy intake and nutrients intake (dietary carbohydrate, protein and fat) from all the food items consumed over the course of 3 d.
Outcomes
Energy intake from total carbohydrate, protein, and fat and their subtypes as well as food sources of carbohydrate, protein, and fat were the study’s main findings. High-quality and low-quality carbohydrates, high-quality and incomplete proteins, and high-quality and low-quality fat were among the subtypes of carbohydrates, protein and fat. Food sources constituting these subtypes are shown in Table 1 (Reference Shan, Rehm and Rogers15).
Table 1 Dietary components classified as food sources of carbohydrate, protein and fats

* All other carbohydrate not included refined grain and added sugars.
† All other protein not included in grain, tuber and nuts.
‡ All other fat not included in livestock and poultry, animal oil and grain.
Assessment of diet quality
The China Dietary Guideline Index 2018 (CDGI-2018), which is based on the Chinese Dietary Guidelines (2016) and the Dietary Reference Intakes for Chinese (2013), evaluated the overall quality of diets(16,17) . It is composed of seven adequate components (including other grains and beans, the percentage energy from carbohydrate, vegetables, dark-coloured vegetables, fruit, soyabeans and nuts, and dairy products), three moderate components (including seafood, eggs and red meat and poultry) and three limited components (including edible oil, salt and alcohol). The scoring method is described in Table S1 in the Supplement. Dietary and nutrient recommendations for moderately physically active adults aged 18–65 years were used as reference values. The whole CDGI-2018 score ranges from 0 to 110, which measures adherence to the key recommendations in Chinese Dietary Guideline 2016 (Table 2)(16).
Table 2 Balanced dietary patterns and amounts of food at different energy levels (g/d)

* The energy range of Chinese Food Guide Pagoda is 6694–10 042 kJ.
† Potatoes are fresh raw weight.
Other variables
Standard questionnaires were used to collect information on sociodemographic characteristics, such as age, gender, educational attainment, annual household income and community information among other sociodemographic factors. Educational attainment was classified into primary/illiterate, middle school and high/above. Age-related divisions of the participants were made into three groups: 18–49 years, 50–64 years and 65-years. Dividing annual household income by the size of the household, per capita annual household income was determined and divided into tertiles (low, medium and high)(Reference Su, Zhao and Wu18). The community urbanicity index, a sophisticated indicator of urbanisation, is based on twelve multidimensional components that reflect the diversity of a community’s economy, society, population and infrastructure(Reference Jones-Smith and Popkin19). To reflect the degree of urbanicity for each community in the current study, we divided the urbanicity score into tertiles (low, medium and high). A higher urbanicity score indicated that the community has a higher degree of urbanicity.
Statistical analysis
Total energy intake was estimated as the sum of energy from carbohydrate, protein and fat. Its results were expressed as means and 95 % CI. To determine whether sociodemographic characteristics had an impact on the observed trends, we adjusted for age, gender, education level, region, household income and urbanicity index. General linear regression was used to estimate the trends in total macronutrients, subtypes, food sources and CDGI-2018 score. All of the statistical analyses were conducted using SAS 9.4 (SAS Institute, Inc.), and statistical significance was set at P < 0·05 for all analyses.
Results
Participant characteristics
Table 3 displays the characteristics of population subgroups in the CHNS between 1991 and 2015. In the current study, the sample size for the analysis was 9251 in 1991, 10 491 in 2000, 9912 in 2009 and 14 549 in 2015, respectively. Over the course of the survey years, there were significant trends in age and education attainment (P < 0·001). From 1991 to 2015, the proportion of older adults (aged ≥ 65 years) increased from 9·2 % to 21·4 %, whereas the percentage of younger adults (aged 18–49 years) declined from 71·9 % to 43·8 %. The proportion whose education attainment was primary/illiterate declined from 58·3 % to 33·1 %, and the percentage of high school/above education increased from 15·1 % to 35·1 %.
Table 3 Sociodemographic characteristics of the analysis sample of the China Health and Nutrition Survey

Data are expressed as n (%).
Trends in percentage of energy from total and subtypes of carbohydrates, protein and fat
From 1991 to 2015, the percentage of mean energy intake from total carbohydrates declined from 62·6 % to 50·6 % (P < 0·001 for trend). The percentage of mean energy from high-quality carbohydrates was relatively stable, only declining from 8·9 % to 8·6 %, whereas that from low-quality carbohydrates decreased from 53·6 % to 41·7 %, but its contribution has been the largest for over time. The percentage of mean energy from total protein was relatively stable, increased from 12·6 % to just 13·1 %. The increase in total protein intake was mainly from high-quality protein from 3·3 % to 5·5 %; incomplete protein declined from 9·3 % to 7·5 %. The increases in the average percentage of mean energy intake from total fat were substantially significant from 24·0 % to 35·8 %. The percentage of mean energy intake from both high-quality fat and low-quality fat increased from 9·1 % to 16·7 % and 14·9 % to 19·0 %, respectively (Fig. 1 and Table S2 in the Supplement). Similar trends were found in evaluating the intake of carbohydrates, protein and fat from various food sources (Table S3 in the Supplement). The trends in the percentage of mean energy intake from total and subtypes of carbohydrates, protein and fat did not change the findings after controlling for the confounding factors (Table S3 in the Supplement).

Fig. 1 Trends in percentage of energy from total and subtypes of carbohydrates, protein and fat, from 1991 to 2015
Trends in percentage of energy intake from carbohydrates, protein and fat from food sources
The percentage of mean energy intake from high-quality carbohydrates, which mostly come from coarse grains, declined from 3·9 % to 1·9 % between 1991 and 2015 (P < 0·001 for trend), whereas energy intake from high-quality carbohydrates from fruit grew from 0·2 % to 1·1 % (Table 4). Decreases in the mean energy intake from low-quality carbohydrates were associated with declines in consumption of refined grains (from 52·2 % to 36·2 %); nevertheless, consumption of added sugar (from 0·5 % to 1·7 %) and other low-quality carbohydrates increased (from 0·9 % to 3·8 %). Increases in the mean energy intake from high-quality protein were associated with increased protein derived from consumption of white meat (from 1·4 % to 2·3 %) and fresh red meat (from 0·8 % to 1·7 %). Declines in the mean energy intake from incomplete protein were associated with decreases in protein intake from grain (from 7·2 % to 4·4 %). Increases in the mean energy intake from high-quality fat were mainly increased in fat intake from plant oil (from 8·5 % to 15·7 %). The increase in the mean energy intake from low-quality fat were associated with increased fat intake from livestock and poultry (from 6·3 % to 10·7 %) and others (from 2·2 % to 5·1 %). Similar trends were found in evaluating the intake of carbohydrates, protein and fat from different food sources (Table S4 in the Supplement).
Table 4 Trend in percentage of energy intake from carbohydrate, protein and fat from different food sources, from 1991 to 2015

* All other carbohydrate not included refined grain and added sugars.
† All other protein not included in grain, tuber and nuts.
‡ All other fat not included in livestock and poultry, animal oil and grain.
China Dietary Guideline Index 2018
The estimated mean of the CDGI-2018 increased from 41·7 to 52·4 between 1991 and 2015 (P < 0·01 for trend). The largest increase in the estimated component scores was observed for limited components (from 20·4 to 27·4, P < 0·01 for trend), indicating reduced consumption of salt. The decreased components included vegetables, soyabeans and nuts, and alcohol (P < 0·01 for trend; Table 5).
Table 5 Trends in estimated the CDGI (2018) total and component scores among adults, from 1991 to 2015
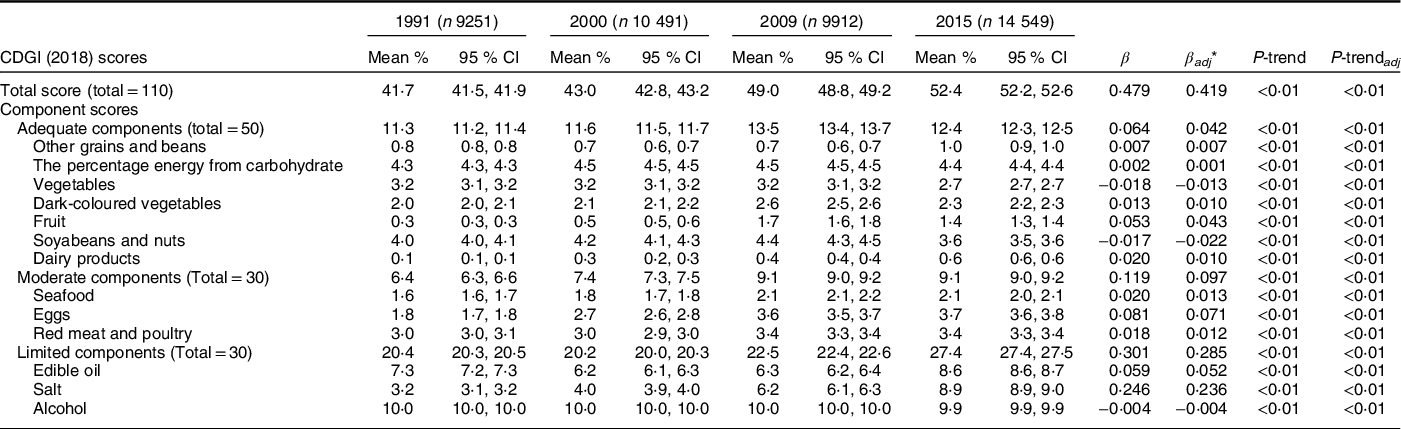
CDGI, China Dietary Guidelines Index.
* Adjusted gender, age, region and education level.
For the CDGI-2018, the increases in estimated total score of females was higher than for males (P < 0·01 for interaction for all). As education level increased, the quality of diet became higher. Those who had middle household income had the highest diet quality (Table 6).
Table 6 Trend in estimated the China Dietary Guidelines Index (2018) total and component scores according to sample characteristics, from 1991 to 2015

Discussion
The macronutrient composition of Chinese adults’ diets remained unsatisfactory from 1991 to 2015, with significant decreases in the percentage of mean energy intake from carbohydrates (mainly a decrease in refined grains with low-quality carbohydrates and coarse grains for high-quality carbohydrates) and significant increases in the percentage of mean energy intake from total fat (mainly an increase in plant oil with high-quality fat and livestock and poultry with low-quality fat). Although the overall diet quality had improvements by CDGI-2018, the proportion of mean energy intake from low-quality carbohydrates was still large; meanwhile, the total fat intake increased above the recommended value, especially the low-quality fat for a large proportion.
Evidence from the China National Nutrition Surveys (CNNS) also indicated that the total carbohydrate intake was 80·8 % of total energy in 1982 and decrease to 55·9 % in 2012, and total fat intake increased from 12·0 % to 32·3 %(Reference He, Li and Yang2). The Japan National Health and Nutrition Survey also showed that the energy intake from fat increased in both genders from 1995 to 2016, whereas there were inverse trends in energy intake from protein among Japanese adults(Reference Saito, Imai and Htun20). Similar findings, including an increase in energy intake from fat increased and a reduction in energy intake from protein were seen in a report from Korea(Reference Yun, Kim and Oh21). The trends were consistent with the results of the present study.
Several reasons might potentially explain these trends. The vigorous development of the food economy and processing industry has diversified food choices, especially ultra-processed foods. More importantly, it has led to the classic Chinese diet (including cereals and, vegetables with few animal foods), which was considered with to have high-quality carbohydrate and low fat being gradually replaced by a westernisation of dietary patterns (including decreased intake of coarse grains and increased intake of red meat, processed meat, sugary beverages, and saturated fat, a diet high in low-quality carbohydrate and fat)(Reference Ezzati and Riboli22,Reference Ovaskainen, Reinivuo and Tapanainen23) . In many areas, rural residents have also seen increases in wealth, and their diets have also shifted to include more animal products (reduced carbohydrates and increased edible oils and total fat)(Reference Zhai, Wang and Wang24). Additionally, these underlying trends in macronutrient composition show essentially a decrease in energy intake, which mostly reflects a marked decline in levels of physical activity that is concurrent with rising urbanisation(Reference He, Li and Yang2). Moreover, these trends could be due to the changes in recommendations of the Chinese Dietary Guideline (CDG): the recommendation was to eat properly in 1989, an intake of 300–500 g of cereals was recommended in 1997 and an intake of 250–400 g cereals was recommended in 2007(25–27). Evidence indicates that away-from-home food consumption is associated with high intake of low-quality fat(Reference Bezerra, Junior and Pereira28–Reference Lachat, Nago and Verstraeten30). Since 2000, away-from-home foods consumption had increased substantially from 14·7 % to 20·6 %. Such changes in lifestyle and dietary behaviour may have contributed to change in these trends(Reference Dong and Hu31).
The improvement of diet quality was largely due to a change in consumption of moderate and limited components. For the moderate components, there are two reasons for such changes. The first is the increase of income level and purchasing power. The Engel’s coefficient of urban households decreased from 38·2 % in 2001 to 36·2 % in 2012, and that of rural households decreased from 47·7 % in 2001 to 39·3 % in 2012(32). The second is the increase in food production and accessibility. Aquatic products are taken as an example. The total output of aquatic products in China was 37·9592 million tons in 2001, 51·164 million tons in 2009 and 62·1097 million tons in 2015(32). For the limited components, there may also be two reasons for the higher score. One is the effect of policy implementation. Since 2016, China Healthy Lifestyle for All has been carried out under the theme of reducing salt, oil and sugar(33). The Healthy China Initiative (2019–2030) and National Nutrition Plan (2017–2030) also advocate limiting salt intake(34,35) . The second is the increase in residents eating out and pre-packaged foods that has led to inaccurate salt intake in dietary surveys. In addition, after adjusting for gender, age, region and education level, the absolute value of β decreases, indicating that demographic changes improve the dietary quality of the investigated population to a certain extent. The latest dietary guidelines were used to assess dietary quality in the hope of looking at past dietary problems from a modern perspective and making annual dietary quality comparable, but this inevitably underestimates the dietary quality in the past.
During the same time period, there are some modest improvements in macronutrient subtypes and foods source intake. CDG began to promote milk, legume and seafood intake in 1997, which might be associated with an increased intake of high-quality protein, such as dairy products, eggs and white meat(25,26,36) . The evidence from CNNS showed that egg, dairy products, soyabean and seafood intake had an improvement(Reference He, Li and Yang2). At the same time, the dairy industry and fishing industry developed rapidly. The increase in high-quality protein intake and the decrease in incomplete protein intake may be due to the effect of nutrition and health education, which makes consumers consciously change their food choices (choosing high-quality protein foods) and intake. These factors can increase the intake of high-quality protein. Otherwise, low-quality fat mainly animal fat had a significant decrease and high-quality fat such as nuts and plant oil had a modest increase. From 1982 to 2012, the total intake of edible oil for Chinese adults was gradually increasing with plant oil intake and animal oil intake decreasing(Reference Fang, He and Yu37). This is consistent with scientific evidence, and the CDG advocated that it was healthier to replace low-quality fat with high-quality fat(Reference Schwingshackl and Hoffmann38–Reference Nyquist, Rodbotten and Thomassen40).
Despite some modest improvements over the decades, important dietary challenges remain. Low-quality carbohydrates were still the predominant source of energy intake. The primary low-quality carbohydrates energy intake represents carbohydrates from refined grains and added sugar which has been shown to contribute in non-communicable diseases(Reference Gui, Zhu and Cai9). Intake of high-quality protein or their foods source was still substantively far from the recommendation. Fat intake remained above the CDG recommended level of 20 %–30 % of energy intake, and worse is that the low-quality fat is the majority percentage of fat energy intake. Furthermore, Chinese adults who have a higher level of educational attainment, have a higher household income and live in a more urbanised area have a higher percentage of energy intake from total fat and a lower percentage of energy intake from total carbohydrate. The available evidence indicates that dietary transitions are significantly associated with the chronic disease burden in China(Reference He, Li and Yang2,Reference Ezzati and Riboli22,Reference Wang, Siega-Riz and Gordon-Larsen41,Reference Ludwig, Hu and Tappy42) . Over the past few decades, the macronutrient composition and quality of diet have remained suboptimal among Chinese adults. Policies should be used to reduce the burden of obesity and non-communicable diseases by focusing on improving macronutrient composition and dietary quality, mainly by reducing high fat, added sugar and Na intake. There also should be concerted efforts at the national, society, family and individual levels.
Some limitations should be taken into account when interpreting our results. First, our 3-d 24-h dietary recall estimates of nutritional intake would not be an accurate depiction of dietary intake throughout the four seasons. Second, with the rapid development of the food processing sector, people’s dietary consumption patterns are trending towards high-consumption pre-packaged foods, which could result in poor dietary quality (e.g. high energy intake, high salt and high sugar). However, because these data are not including specific information about consumption of pre-packaged food and the estimate will be biased. In the past few decades, we have seen a substantial decline in the percentage of energy intake from total carbohydrates as well as little change in the proportion of energy intake from total protein, but the proportion of energy intake from high-quality protein increased considerably. A significant increase in percentage of energy intake from total fat was associated with increases in both low- and high-quality fat intake. To enhance the macronutrient composition and dietary quality of Chinese adults, more targeted policies should be taken into account and put into practice.
Acknowledgements
Acknowledgements: The authors are grateful to all the participants in our study and the staff responsible for conducting the China Health and Nutrition Survey. And the authors also acknowledge the team at the National Institute for Nutrition and Health, Chinese Center for Disease Control and Prevention, and the Carolina Population Center, University of North Carolina at Chapel Hill. Financial support: The ‘China Nutritional Transition Cohort Study’ project received funding from Ministry of Finance of the People’s Republic of China (no. 13103110700015005). The present study is also sponsored by Carolina Population Center (P2CHD050924 and T32 HD007168), the University of North Carolina at Chapel Hill, the NIH (R01-HD30880, DK056350, R24 HD050924 and R01-HD38700) and the NIH Fogarty International Center (D43 TW009077 and D43 TW007709) for financial support for the CHNS data collection and analysis files from 1989 to 2015 and future surveys. Authorship: These authors contributed equally: L.H. and L.W., both of them analysed the data and writing – original draft preparation; H.J. performed the surveys; H.W. and Z.W. interpreted the results and revised the manuscript; B.Z. and G.D. critically reviewed the manuscript for important intellectual content and project administration. All authors approved the final manuscript. Ethics of human subject participation: This study was conducted according to the guidelines laid down in the Declaration of Helsinki, and all procedures involving research study participants were approved by the Institutional Review Board of the University of North Carolina at Chapel Hill and the National Institute for Nutrition and Health, Chinese Center for Disease Control and Prevention. Written informed consent was obtained from all subjects.
Conflicts of interest:
The authors declare that they have no conflicts of interest.
Supplementary material
For supplementary material accompanying this paper visit https://doi.org/10.1017/S1368980022002099


 Open access