


Elevated serum uric acid (SUA) levels in blood, called hyperuricaemia, has been recognised as an important risk factor in the development of gout(Reference Major, Dalbeth and Stahl1). Recently, hyperuricaemia has also been linked to the development of several health conditions, including hypertension, cardiovascular illnesses, abnormal blood sugar levels and chronic kidney conditions(Reference Mallat, Al Kattar and Tanios2,Reference Mazidi, Katsiki and Mikhailidis3) . Unlike gout, hyperuricaemia usually does not present with any symptoms or pain(Reference Jung, Kim and Kim4). Therefore, a large population may be unaware of undetected hyperuricaemia. Based on one US population-based survey, the prevalence of hyperuricaemia did not significantly change from 2007–2008 to 2015–2016. Approximately 14·6 % of US adults had hyperuricaemia between 2007 and 2016, which is equal to 32·5 million people(Reference Singh, Lingala and Mithal5).
Sugar-sweetened beverage (SSB) is still the main source of added sugar consumption in the diet. In particular, regular soft drinks contain the highest amount of high-fructose corn syrup (HFCS) in the USA(Reference Vartanian, Schwartz and Brownell6). Higher fructose:glucose ratios were detected in popular US soda drinks (1·9 or 1·5:1) than in most processed foods (suggested fructose:glucose ratio of 1·2:1)(Reference Ventura, Davis and Goran7). Previous epidemiological studies have found an association between consumption of SSB/added sugar and SUA levels in US adults(Reference Gao, Qi and Qiao8,Reference Choi, Ford and Gao9) . Furthermore, an association between elevated levels of SUA and added sugar intake from SSB has been observed in only male adults(Reference Gao, Qi and Qiao8). This observed biological difference in SUA levels may suggest that oestrogen has a protective effect in women(Reference Anton, Garcia Puig and Ramos10). Based on the laboratory assessment, regular soda contains around 60 % of added sugar, in particular fructose(Reference Walker, Dumke and Goran11). High intake of fructose may play a vital role in elevating SUA levels because uric acid is the final metabolite of fructose metabolism via the fructokinase pathway in hepatocytes(Reference Choi, Ford and Gao9,Reference Rutledge and Adeli12,Reference Choi, Willett and Curhan13) .
Besides SSB consumption, accumulated body adiposity is also independently linked to elevated SUA concentrations(Reference Choi, Mount and Reginato14–Reference Ali, Perveen and Rahman16). Consumption of fructose-containing sweetened beverages has been understood to contribute strongly to weight gain and adiposity(Reference Walker, Dumke and Goran11). Therefore, the aim of the current study was to investigate how age-related differences influence the combined association of added sugar intake from soda drinks and body adiposity with the risk of hyperuricaemia in gender-stratified adults.
Study purpose
The first aim of this study was to understand differences that age and gender may have on the association between the amount of added sugar consumed from soda and the risk of hyperuricaemia in US adults. Furthermore, we evaluated the combined effects of added sugar intake from soda and body adiposity status on the risk of hyperuricaemia in young, middle age and older males and females.
Methods
Study design
This was a cross-sectional study design using the National Health and Nutrition Examination Survey (NHANES) programme, which is a nationwide population-based survey in the USA, conducted every 2 years by the National Center for Health Statistics of the Centers for Disease Control and Prevention. NHANES implemented a cross-sectional study design with complex multistage, stratified and clustered sampling strategies. Data were collected to identify lifestyle patterns, health outcomes and nutritional status from a general community sample in the USA(17).
Study population
Three eligibility criteria were used to select this study’s subjects. First, adults aged ≥20 years old who were non-Hispanic white, non-Hispanic black, Mexican American and/or other Hispanic were selected from five NHANES cycles between 2007 and 2016. Then, we selected subjects who had at least 1 d of information from 2-d 24-h recall interviews, biochemical data on SUA and serum creatinine, and BMI. Finally, NHANES participants with diabetes, gout, failing kidney function, severely reduced kidney function (estimated glomerular filtration rate (eGFR) < 30 ml/min per 1·73 m2) or who consumed special diets (including weight loss/low-energy diet, low-fat/low-cholesterol diet, sugar-free/low-sugar diet, diabetic diet, low carbohydrate diet, high protein, renal/kidney diet and other special diet) were excluded to minimise the bias of soda intake and SUA levels. NHANES participants with hypertension were not excluded from this study due to a high prevalence of hypertension in US adults. Therefore, subjects with heart-related diseases or hypertension were not excluded from our study population in order to ensure a sufficient sample size was present in each gender- and age-specific group. Around 4·8 % (n 935) and 24·6 % (n 4298) of US adults with heart-related diseases and hypertension were observed in our study subjects, respectively. All self-reported personal conditions, including hypertension and heart-related diseases, were adjusted in statistical models.
Consumption of added sugar from soda
More than 60 % of total added sugar in US popular soda drinks is HFCS, which is equal to more than 52 g of HFCS per litre(Reference Walker, Dumke and Goran11). Nearly 50 % of added sugar in the diet was from regular soda drinks which also contains a larger amount of added sugar, especially HFCS, than other types of SSB(Reference Guthrie and Morton18). Due to discontinued USDA code of other types of SSB during NHANES 2007–2016, soda drink is the only type of SSB that can be identified and calculated using consistent USDA code(19). In this study, each type of soda with added sugar was recognised according to the US Department of Agriculture (USDA) codes from 2-d 24-h recall interviews(20). The first dietary recall interview was collected by NHANES examinees via face-to-face in-person interviews in the Mobile Examination Center. The second interview was conducted by telephone 3–10 d after the first interview. Total added sugar intake from soda per day was calculated based on each selected USDA code(19). Average consumption of added sugar intake from soda was further calculated if NHANES participants had completed 2-d 24-h dietary questionnaires. Because no suggested criteria for added sugar consumption from SSB is available, the American Heart Association suggestion for total added sugar consumption was used in this study. The recommended added sugar consumption per day was defined as lower than 36 g for men and lower than 25 g for women(21). Therefore, we classified total added sugar intake from soda on a given day into non-soda consumer, regular (1–36 g in males and 1–25 g in females) and excessive (>36 g in males and >26 g in females).
Serum uric acid level and estimated glomerular filtration rate
Hyperuricaemia was defined as SUA levels >7 mg/dl (417 mmol/l) in men, and >6 mg/dl (357 mmol/l) in women based on clinical findings(Reference Sachs, Batra and Zimmermann22). eGFR, an indicator of kidney function, was calculated based on serum creatinine and gender, age and race parameters(Reference Levey, Stevens and Schmid23,24) . The detailed equation is described below.
 $${\rm{eGFR }}\left( {{\rm{ml}}/{\rm{min}}\,{\rm{per}}\,{\rm{1}} {\cdot} {\rm{73}}\,{{\rm{m}}^{\rm{2}}}} \right) = 141 \times \min {\left( {{{Scr} \over \kappa },\;1} \right)^\alpha } \times max\;{\left( {{{Scr} \over \kappa },\;1} \right)^{ - 1\cdot209}}{\mkern 1mu} \times {\mkern 1mu} {\left( {0{\cdot}993} \right)^{Age}} \times 1{\cdot}018\;\left[ {{\rm{if}}\;{\rm{female}}} \right] \times 1{\cdot}159\;\left[ {{\rm{if}}\;{\rm{Black}}} \right]$$
-
SCr (standardised serum creatinine) = mg/dl
-
κ = 0·7 (females) or 0·9 (males)
-
α = –0·329 (females) or –0·411 (males)
-
min = indicates the minimum of SCr/κ or 1
-
max = indicates the maximum of SCr/κ or 1
-
age = years
Body adiposity
Data on BMI were obtained from the physical examination section of NHANES. A BMI of <25, 25–29·9 and ≥30 kg/m2 was defined as under/normal weight, overweight and obese, respectively, based on BMI criteria for adults(25). Individuals who had a BMI below 18·5 kg/m2 were combined with normal subjects due to a low prevalence of underweight individuals in this study population (1·6 %).
Covariates
Data on age, gender, race and ratio of family income to poverty (PIR) were obtained from the demographic questionnaire. In order to understand whether age affects the pattern of soda consumption and possibility of hyperuricaemia, continuous data on age were divided into three age groups, including young (<35 years), middle (35–49 years) and older (≥50 years)(20). Smoking status was identified by two questions regarding cigarette use. Non-smokers and smokers were first distinguished by the question ‘Have you smoked at least 100 cigarettes in your life?’ Then, smokers were further classified into current smokers or former smokers based on the question ‘Do you now smoke cigarettes?’. Three questions from the alcohol use questionnaire were used to classify our study population’s alcohol drinking status. Individuals who had <12 drinks and ≥12 drinks in the past year were defined as non-alcohol drinkers and alcohol drinkers, respectively. Alcohol drinkers were further classified into light alcohol drinkers (≤5 drinks/d) and heavy drinkers (>5 drinks/d). Information about different types and daily duration of sports, fitness and recreational activity (all classified as vigorous, moderate and sedentary) were obtained from the physical activity questionnaire(20). The total weekly duration that individuals spent doing each type of activity in leisure time was calculated. At least 150 min of moderate-intensity or 75 min of vigorous-intensity recreational activities per week were used to identify whether adults had adequate physical activity (less time correlated with insufficient physical activity)(26). Individuals who self-reported any health problems were categorised into the personal medical condition group, including those with diagnosed CVD (congestive heart failure, CHD, heart attack and stroke), respiratory problems (asthma and chronic bronchitis symptoms), cancer/malignancy and others (arthritis, kidney stone, angina, emphysema, thyroid problems and liver conditions). Total consumption of energy (kcal), sugar (g), protein (g) and fat (g) during the past 24 h was obtained from total nutrient intake data, which was calculated from each component of food intake by NHANES examinees.
Statistical analysis
An appropriate sampling weight was selected from each cycle of NHANES data from 2007 to 2016 and calculated based on the National Center for Health Statistics analytic guidelines(27). To adjust for sampling weights, all analyses were performed under survey modules of STATA v15 (StataCorp.). Percentages under χ 2 tests for categorical variables and means and standard errors under simple linear regression models for continuous variables were shown in descriptive results. Multivariate regression models with interaction terms were used to assess the possible effect modifications of age on the association between added sugar intake from soda and SUA levels. The dose–response linear trends were applied to evaluate the effect on SUA levels across increasing amounts of added sugar consumption from soda, stratified by age and gender. Multivariable logistic regression models were performed to evaluate age-specific difference in the combined association between consumption of added sugar from soda and body adiposity with possibility of hyperuricaemia in each gender, which were measured using an adjusted OR (aOR) and corresponding 95 % CI. Based on previous research and the changed effect of interest by >10 % in this study population, potential confounders, including race, PIR, cigarette smoking, alcohol drinking, physical activity, medical condition, status of eGFR and daily consumption of total energy, sugar, protein and fat, were determined and considered in the multivariable logistic regression models(Reference Mickey and Greenland28). Sensitivity analyses were also conducted to validate that the association between added sugar intake and hyperuricaemia risk was not influenced by hypertension and heart-related diseases. This was assessed by excluding subjects with hypertension and heart-related disease.
Results
A total of 15 338 adults without gout, failing kidneys, eGFR < 30 or diabetes were selected from the 2007–2016 NHANES for analyses in this study. The distribution of SUA levels according to categories of added sugar intake from soda and covariates in total population is shown in Table 1. Overall, US adults who consumed a higher amount of sugar from soda were found to have the highest SUA levels among the total population (5·53 ± 0·03 mg/dl), as well as gender-specific subsamples 6·16 ± 0·03 mg/dl in males and 4·74 ± 0·03 mg/dl in females). Different associations between covariates (age, race, poverty income index, alcohol consumption and physical activity) and SUA levels were also found between genders. In particular, age was inversely associated with SUA levels in males only.
Table 1 The distribution of serum uric acid (SUA) levels according to personal characteristics, lifestyle patterns, BMI and kidney function status in US adults
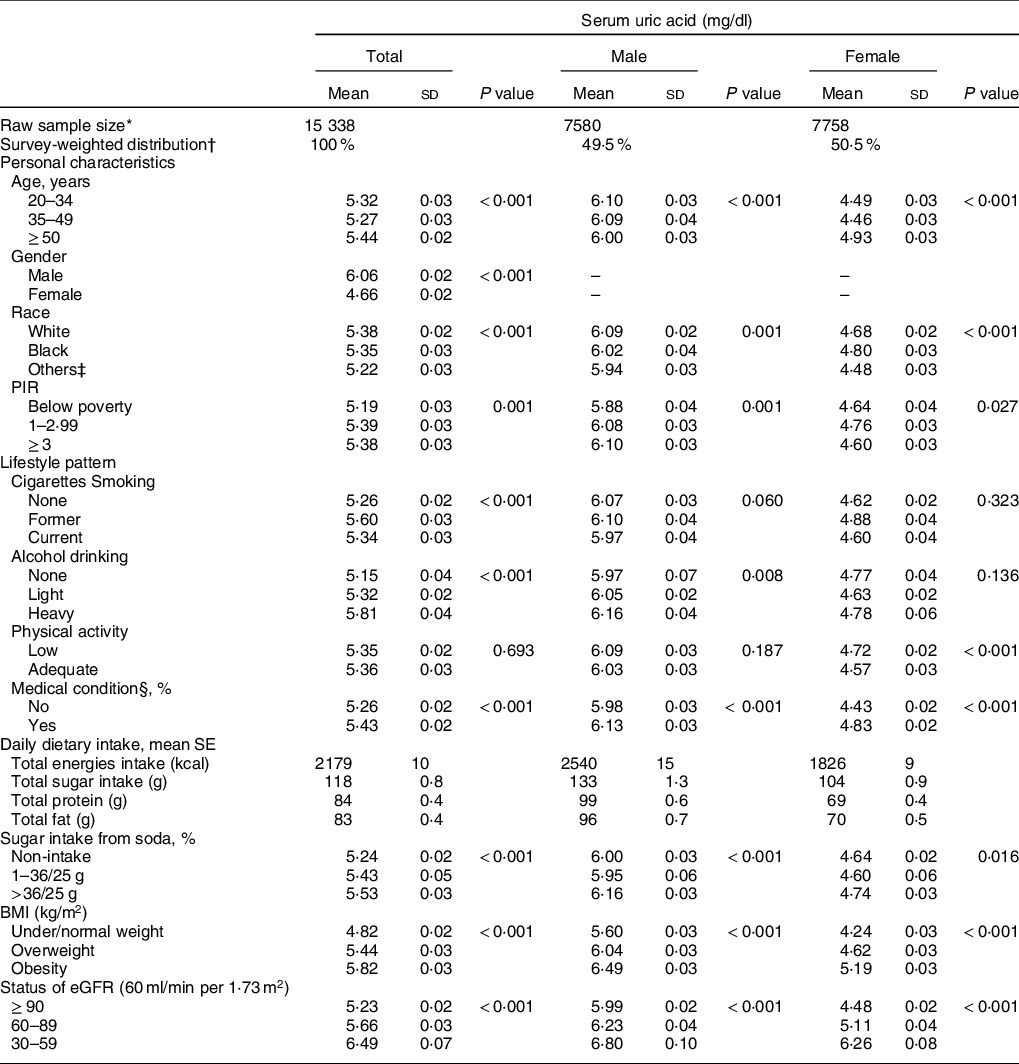
PIR, poverty income ratio; eGFR, estimated glomerular filtration rate.
* Raw number of eligible subjects who were selected during 2007 and 2016 NHANES.
† All results were adjusted for sample weight and the complex sample design.
‡ Other races include Hispanic and Mexican American.
§ Medical condition includes asthma, arthritis, hypertension, heart diseases/attack, stroke, angina, emphysema, thyroid problem, chronic bronchitis, liver condition and cancer/malignancy.
Figure 1 shows the effect modification for age on multivariate-adjusted differences of SUA across different amounts of added sugar intake from soda. Age was found to significantly modify the association on the adjusted SUA differences for amounts of added sugar intake from soda in young males (P for interaction = 0·049). Conversely, we did not identify any significant interaction with age between different amounts of added sugar intake from soda and SUA levels in females. Moreover, a dose–response relationship between amounts of added sugar intake from soda and SUA levels was also assessed in specific gender and age samples. A 0·21 and 0·32 mg/dl increased SUA level was found in young males who consumed excessive amounts of added sugar from soda compared with non-soda consumers (P for trend < 0·001). Middle age males who consumed medium and excessive amounts of added sugar from soda were observed to have increased SUA levels of 0·19 and 0·20 mg/dl compared with non-soda consumers, respectively (P for trend = 0·020). However, a 0·18 and 0·33 mg/dl increased SUA level was found in middle age females who consumed medium and excessive amount of added sugar from soda compared with non-soda consumers, respectively (P for trend < 0·001). Older females who consumed medium and excessive amount of added sugar from soda were observed to have a 0·14 and 0·22 mg/dl increased SUA level compared with non-soda consumers, respectively (P for trend = 0·001).
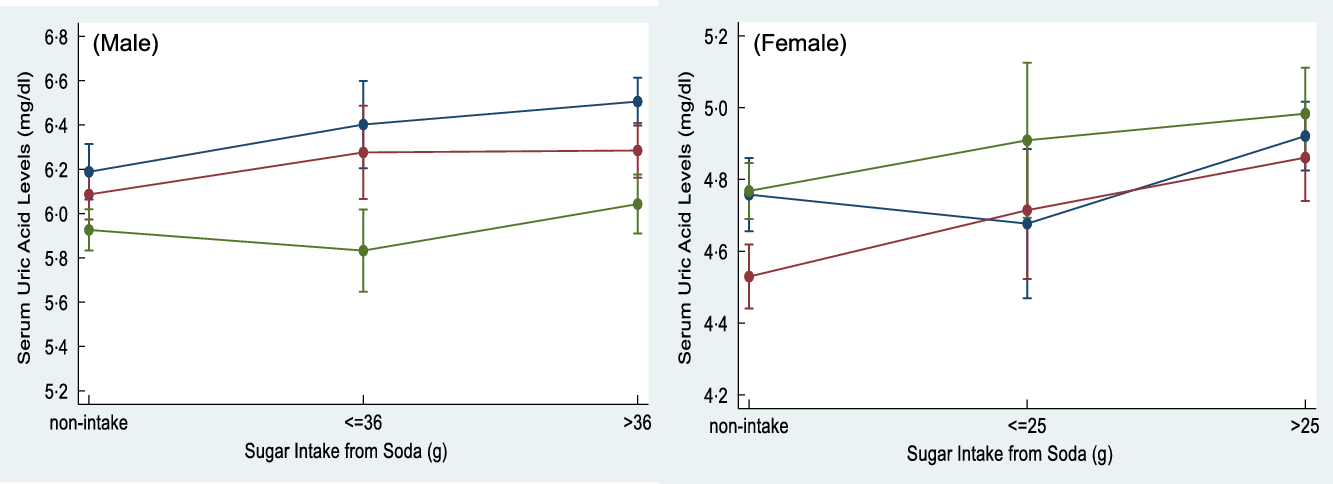
Fig. 1 The interaction effect between the age and sugar intake from soda on serum uric acid (SUA) levels was detected in male adults (P for interaction = 0·049). Sugar intake from soda was categorised as non-intake, ≤36/25 g and >36/25 g in males and females, respectively, based on American Heart Association (AHA) recommendation for daily added sugar intake. ![]() , 20-34;
, 20-34; ![]() , 35-49;
, 35-49; ![]() , ≥50 years old
, ≥50 years old
Table 2 presents the survey-weighted distributions of demographic characteristics, lifestyle factors and personal medical conditions in male and female US adults with and without hyperuricaemia. The age-stratified prevalence rate of hyperuricaemia was 18·8–20·4 % and 6·8–17·3 % in males and females aged <35, 35–49 and ≥50 years old, respectively. Overall, males had a higher prevalence of hyperuricaemia than females in each age-stratified group. In addition, young females had the lowest prevalence of hyperuricaemia in our study population (6·8 %). In males aged <35 years, the characteristics of hyperuricaemia varied by race and PIR (P ≤ 0·010). In contrast, the characteristics of hyperuricaemia varied by race and PIR in females aged ≥50 years (P ≤ 0·001). 24·1 % and 23·6 % of male subjects aged 35–49 and ≥50 years, respectively, who were heavy alcohol drinkers were shown to have hyperuricaemia (P ≤ 0·041). Females aged ≥50 years with insufficient physical activity were more likely to have hyperuricaemia (P = 0·007). Furthermore, different prevalence rates of hyperuricaemia were observed in both genders between subjects who had personal medical conditions and subjects who did not (P ≤ 0·038).
Table 2 Demographic characteristics, lifestyle patterns and medical conditions across different age- and gender-stratified US adults
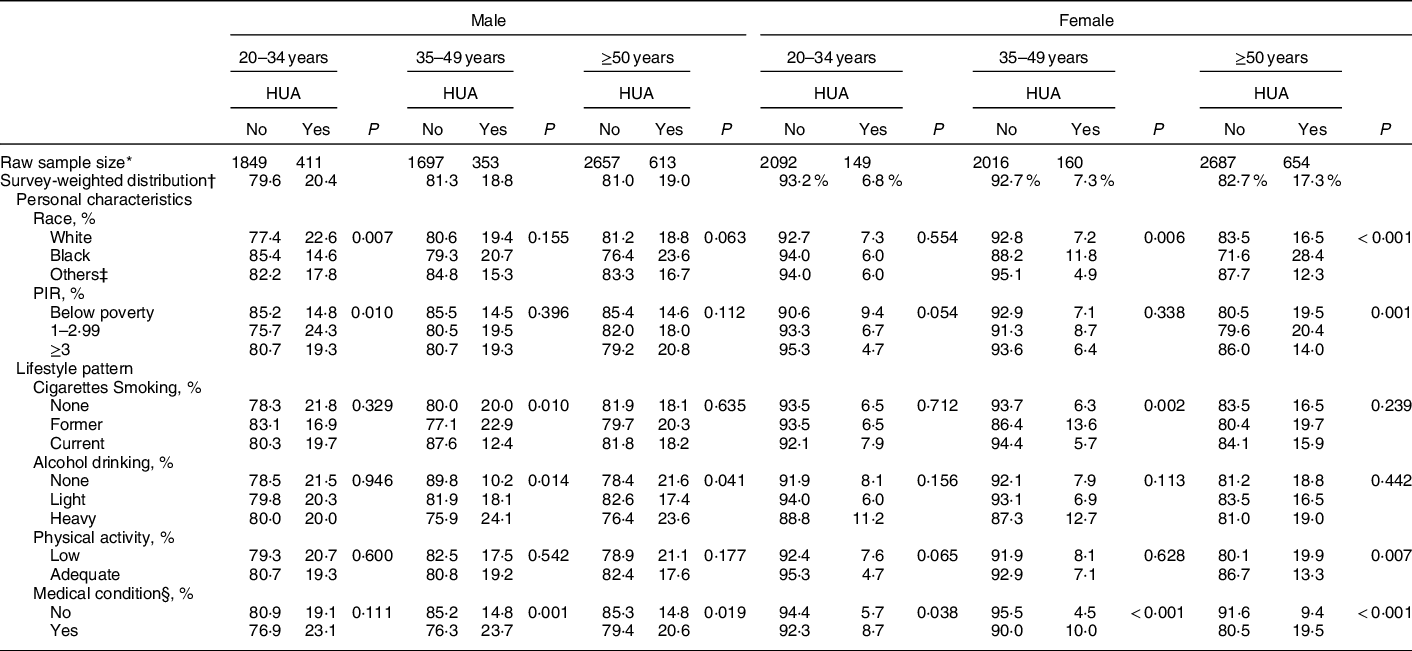
HUA, hyperuricaemia; PIR, poverty income ratio.
* Raw number of eligible subjects who were selected during 2007 and 2016 NHANES.
† All results were adjusted for sample weight and the complex sample design.
‡ Other races include Hispanic and Mexican American.
§ Medical condition includes asthma, arthritis, hypertension, heart diseases/attack, stroke, angina, emphysema, thyroid problem, chronic bronchitis, liver condition and cancer/malignancy.
Table 3 shows the patterns of daily dietary intake habits, overweight/obesity status and eGFR in male and female US adults with and without hyperuricaemia, after adjusting for demographic characteristics, lifestyle patterns and personal medical conditions. A lower total sugar consumption was found in both genders for older adults with hyperuricaemia (P ≤ 0·007). Approximately 50 % of males aged <35 and 35–49 years old who consumed excessive amounts of added sugar from soda had hyperuricaemia (P ≤ 0·049). Among the three age groups, 44·2–52·5 % of obese males and 53·9–68·5 % of obese females were observed to have hyperuricaemia (P < 0·001). Poor eGFR status was associated with a higher prevalence rate of hyperuricaemia for both genders (P ≤ 0·014).
Table 3 Prevalence of dietary intake, sugar intake from soda drinks and overweight/obesity across different age- and gender-stratified US adults
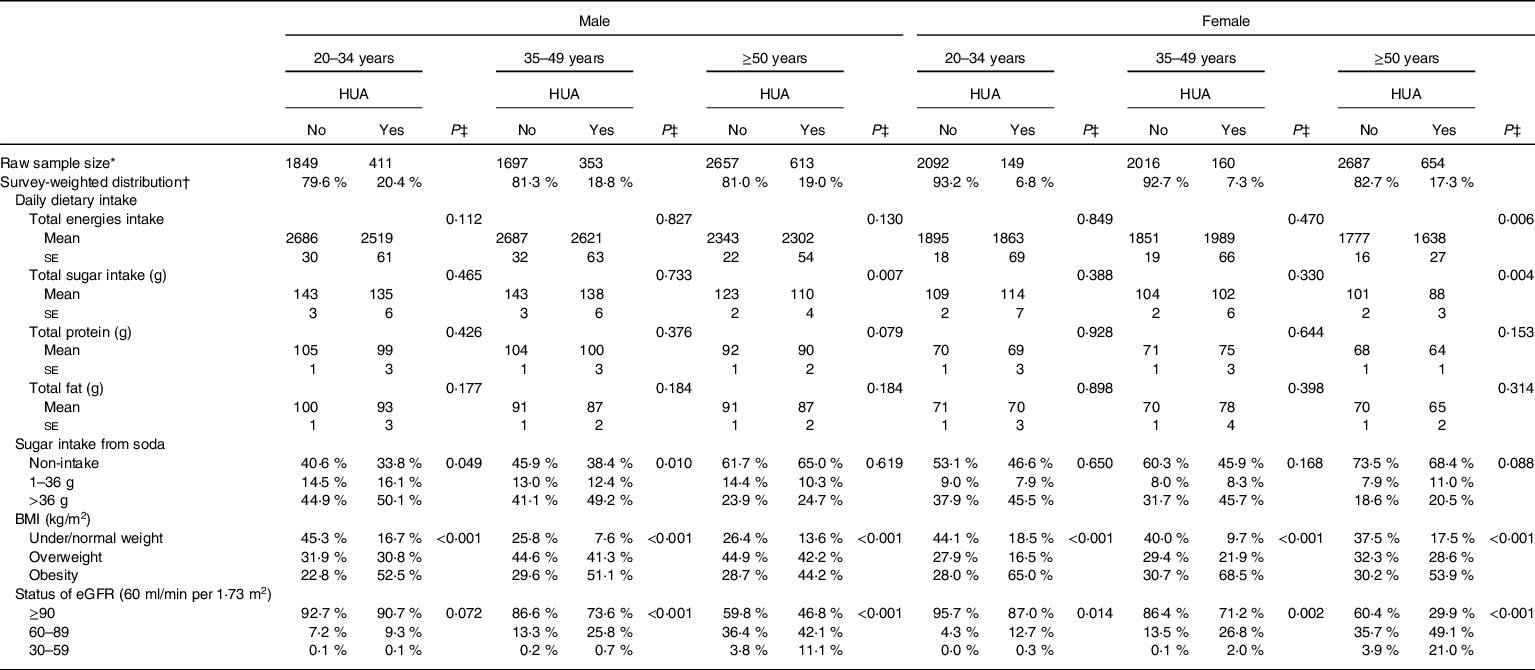
HUA, hyperuricaemia; eGFR, estimated glomerular filtration rate.
* Raw number of eligible subjects who were selected during 2007 and 2016 NHANES.
† All results were adjusted for sample weight and the complex sample design.
‡ P value was obtained after controlling for personal characteristics and lifestyle style patterns, including age, race, poverty income ratio (PIR), smoking, alcohol drinking, physical activity, medical condition.
Table 4 presents the association between daily amounts of added sugar consumption from consuming soda and the risk of hyperuricaemia and/or being overweight/obesity status. When controlling for demographic and lifestyle factors, personal medical conditions, daily dietary intake and eGFR status, a 1·6- to 1·9-fold higher risk of having hyperuricaemia was found in males aged <50 years old who consumed excessive added sugar from soda (>36 g/d) (Model 1). After additionally controlling for BMI, young males (<35 years old) who consumed medium (1–36 g/d) and high (>36 g/d) added sugar from soda were estimated to have a 1·5- to 2·0-times increased risk of having hyperuricaemia when compared with non-soda drinkers. In middle age males (35–49 years old), excessive added sugar consumption from soda was still positively associated with the risk of hyperuricaemia development (aOR = 1·8, 95 % CI = 1·1, 2·9) (Model 2). We did not detect a significant risk of added sugar intake from soda on hyperuricaemia development in older males (≥50 years old). For males, overweight and obesity status were also observed to increase risk of having hyperuricaemia across all ages. Results were shown to be consistent through sensitivity analyses that used models which excluded subjects with hypertension or heart-related diseases.
Table 4 Age-related difference in the association between sugar intake from soda drinks, BMI and risk of hyperuricaemia in gender-stratified adults
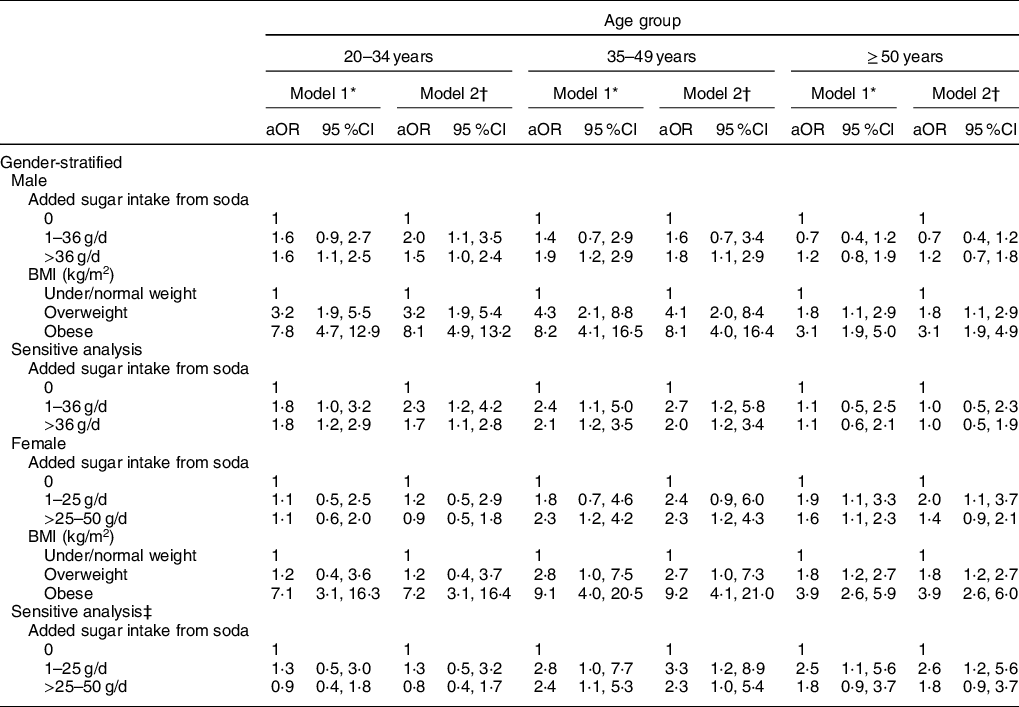
* Model 1 was adjusted for demographic factors, lifestyle patterns, medical condition, daily intake of energy, sugar, protein and fat, and eGFR status.
† Model 2 was adjusted for variables in model 1 and BMI.
‡ Sensitive analysis was conducted by excluding individuals with hypertension and heart-related diseases.
Unlike male adults, a 1·6- to 2·3-fold higher risk was found in females aged ≥35 years with the consumption of excessive (>36 g/d) added sugar from soda in Model 1. When controlling for potential confounders in Model 1 and BMI, middle age females (35–49 years old) who consumed excessive (>36 g/d) added sugar from soda had an estimated 2·3-fold increased risk of having hyperuricaemia (95 %CI 1·2, 4·3). A 2·0-higher risk of hyperuricaemia development was observed in older females (≥50 years old) who consumed medium amounts (1–36 g/d) of added sugar from soda (95 % CI = 1·2, 4·3). In addition to young females (<35 years old), overweight and obesity status were both significantly associated with hyperuricaemia development.
Because added sugar intake and body adiposity were both observed to contribute to the risk of hyperuricaemia, the combined effects of added sugar consumption from soda and body adiposity on the development of hyperuricaemia among young, middle and older aged male adults are shown in Fig. 2, respectively. Compared with non-regular and regular soda consumers who were under/normal weight, excessive added sugar intake from soda was associated with a 3·4- and 7·0-times increased risk of having hyperuricaemia in young males who were overweight or obese (all P’s < 0·001). Non-regular/regular soda consumers with obesity were also observed to have a higher risk of hyperuricaemia development (aOR = 4·9, P < 0·001). A 6·3 to 29·9 times higher risk of hyperuricaemia risk was detected in middle age males with different statuses of added sugar intake from soda and body adiposity, when compared with non-regular/regular soda consumers. For older males, overweight and obesity status were observed to increase the risk of hyperuricaemia (aOR = 2·2 in overweight and aOR = 3·2 in obese males, P < 0·05).
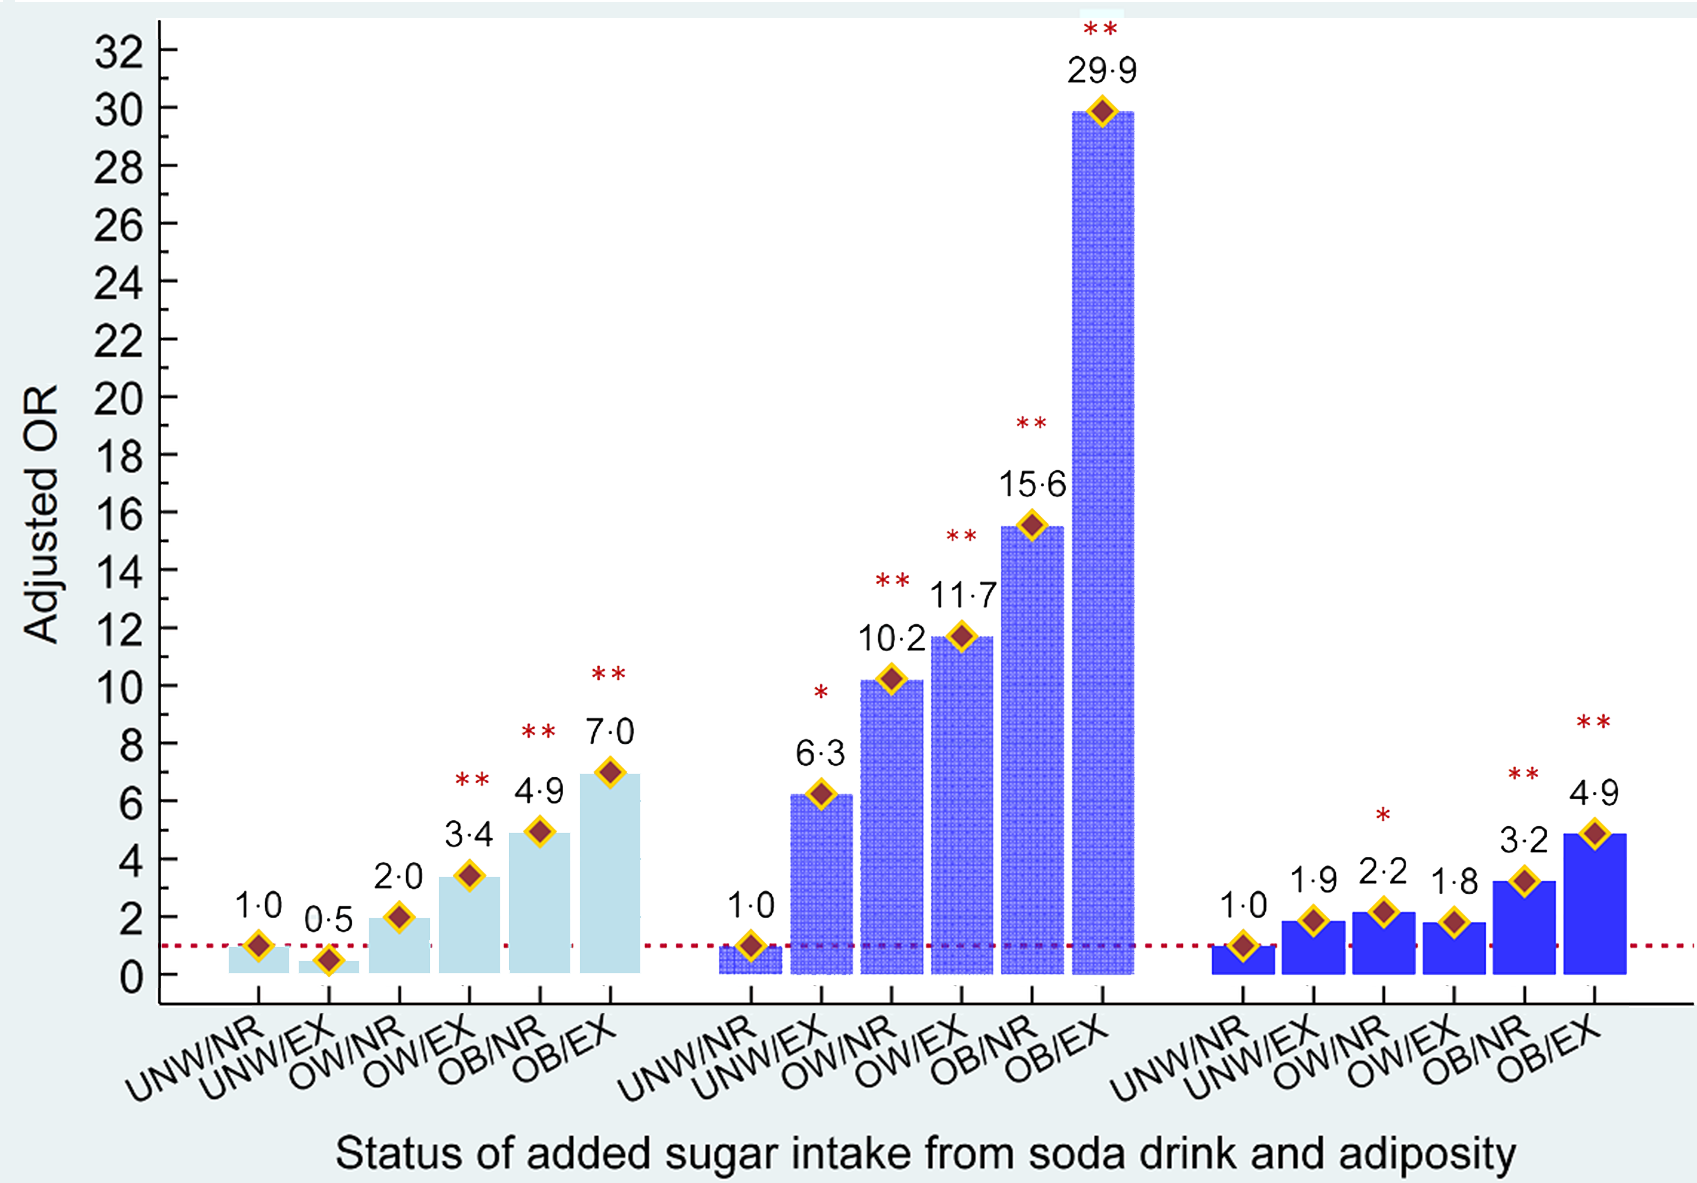
Fig. 2 Combined effects of added sugar intake from soda and adiposity status on risk of hyperuricaemia in males aged <35, 35–49 and ≥50 years old, respectively. ![]() , aged <35 years;
, aged <35 years; ![]() , aged 35-49 years;
, aged 35-49 years; ![]() , aged ≥50 years;
, aged ≥50 years; ![]() , aOR
, aOR
Figure 3 shows the combined effects of added sugar consumption from soda and body adiposity on the development of hyperuricaemia among female adults, stratified by age. Young obese females who were non-regular/regular soda consumers or heavy soda consumers had an estimated 3·6- and 5·5-fold higher risk of having hyperuricaemia, respectively. In middle and older aged females, overweight and obesity statuses independently contributed to hyperuricaemia (aOR = 4·0 to 16·6 in middle age and aOR = 1·7 to 3·7 with overweight and obese, respectively). Furthermore, we observed that excessive added sugar consumption from soda was significantly associated with a greater risk of hyperuricaemia development in middle aged and older females who were overweight or obese (aOR = 10·7 to 23·6 in middle age and aOR = 2·6 to 4·8). Similar to middle age males, a 5·8-fold higher risk of having hyperuricaemia was observed in obese females who consumed excessive amounts of sugar from soda, when compared with non-regular/regular soda consumers who were under/normal weight.
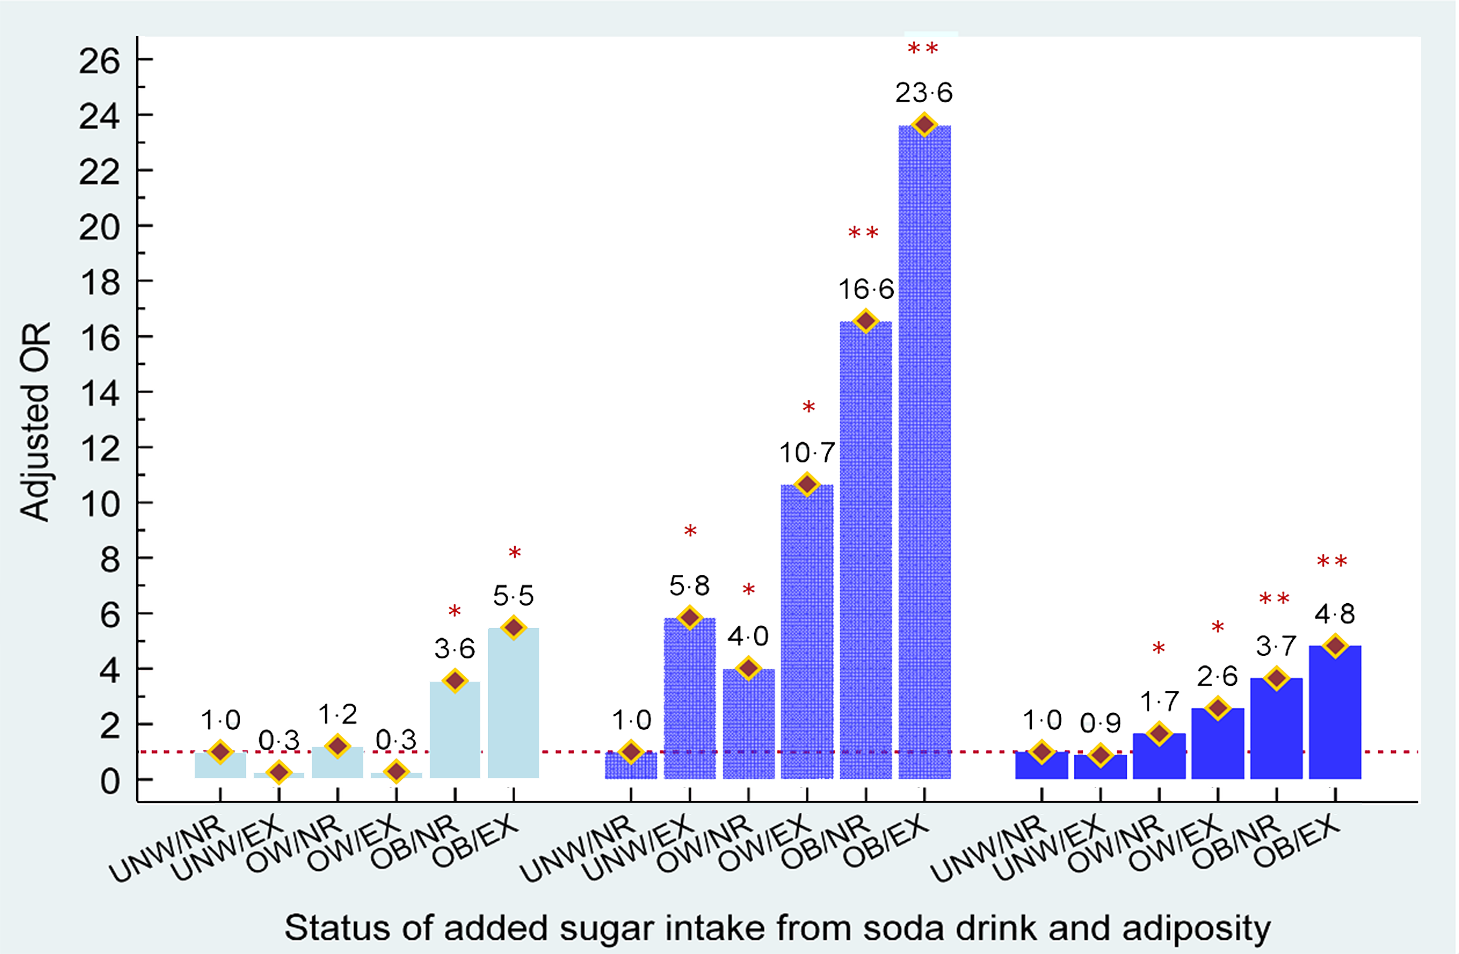
Fig. 3 Combined effects of added sugar intake from soda and adiposity status on risk of hyperuricaemia in females aged <35, 35–49 and ≥50 years old, respectively. ![]() , aged <35 years;
, aged <35 years; ![]() , aged 35-49 years;
, aged 35-49 years; ![]() , aged ≥50 years;
, aged ≥50 years; ![]() , aOR
, aOR
Discussion
According to our findings, the association between amounts of added sugar intake from soda drinks and risk of having hyperuricaemia in age- and gender-specific US adults was observed after controlling for potential confounders and adiposity status. A dose–response gradient between added sugar intake from soda and hyperuricaemia only was detected in male adults. Furthermore, obese adults who consumed excessive amounts of added sugar from soda had the highest risk of having hyperuricaemia, when comparing under/normal-weight adults who consumed none/regular added sugar from soda in all age- and gender-stratified groups.
Soda drinks with HFCS have been suggested as a potential risk factor for increased uric acid and linked to a greater risk of gout development in prior epidemiological studies(Reference Rho, Zhu and Choi29–Reference Choi, Liu and Curhan31). Consistent findings were found in some experimental studies in animals and humans, where uric acid concentrations were elevated after feeding or consuming fructose(Reference Emmerson32,Reference Fox and Kelley33) . Based on biological pathways, fructose is known as the sole carbohydrate that induces uric acid synthesis by ATP degradation to AMP in the liver. When AMP levels increase, inosine monophosphate levels consistently increase. The final product, uric acid, is created after the catabolic pathway is activated by increased levels of AMP and inosine monophosphate, leading to increased uric acid concentration in the blood(Reference Choi, Mount and Reginato14,Reference Fox and Kelley33,Reference Raivio, Becker and Meyer34) . In this study, the consumption of high amounts of added sugar from soda was associated with a higher probability of having hyperuricaemia after adjusting for demographic factors, lifestyle patterns, personal medical conditions, dietary consumption habits and eGFR status. A dose–response gradient between amounts of added sugar intake from soda and hyperuricaemia was also observed in young and middle age males (P for trend ≤ 0·020) and middle age females (P for trend ≤ 0·001). A significant dose–response effect of added sugar intake from soda on hyperuricaemia risk was found in only middle age males when compared with non-soda consumers (P for trend = 0·005), even after controlling for BMI status.
According to the previous findings from the 2001–2002 NHANES, a significantly higher uric acid level was only found in male adults who had the highest intake of added sugars or SSB consumption, when compared with males who had the lowest intake. This finding was not observed but in female adults(Reference Gao, Qi and Qiao8). Few studies have consistently reported that higher consumption of soda drinks or SSB was linearly associated with a greater risk of hyperuricaemia in males, but not in females(Reference Siqueira, Mill and Velasquez-Melendez35). It has been proposed that age and gender may modify the association between soda intake and SUA levels. Previous research only found a significant interaction with gender between frequency of soda consumption and SUA levels in the total population analyses, but not with age, BMI or alcohol intake(Reference Choi, Ford and Gao9). Researchers suggested that these different associations by gender should be explored in future studies(Reference Gao, Qi and Qiao8). Our findings demonstrated that age may also modify the association between amounts of added sugar intake from soda and higher SUA in gender-specific samples. A significant interaction with age between amounts of added sugar intake from soda and SUA levels was detected in males only (P for interaction = 0·049). Age-related difference in the association between added sugar intake from soda, BMI and risk of hyperuricaemia was further observed in this study. A 1·5- and 1·8-fold increased risk of hyperuricaemia was observed in young (20–34 years) and middle (35–49 years) age males who consumed higher added sugar from soda compared with non-soda consumers. However, the association was only observed in females who were 35–49 years old. These differences in age-related effects by gender may be explained by the patterns of added sugar consumption from soda drinks and different biological mechanisms across age groups in each gender. First, it was observed that young to middle aged (20–34 and 35–49 years) male adults had a higher consumption of added sugar from soda drinks than older male adults. About 50 % of young and middle age males who consumed excessive added sugar from soda drinks (>36 g/d) had hyperuricaemia. By comparison, only 24·7 % of older male adults with hyperuricaemia were heavy soda consumers.
Due to gender differences, a lower risk of developing gout has been observed in premenopausal women who consumed the same amount of fructose as postmenopausal women(Reference Choi, Willett and Curhan13). Similarly, no significant positive association between consumption of added sugar from soda drinks and hyperuricaemia was found in current young female subjects. Consumption of added sugar from soda drinks was not associated with a possibility of hyperuricaemia in young female adults (20–34 years). A 2·0- to 2·3-fold higher risk of having hyperuricaemia was observed in middle aged and older female adults when compared with non-soda consumers. An independently positive relationship between age and uric acid levels in females has been found in previous studies(Reference Sturge, Scott and Kennedy36,Reference Akizuki37) . One explanation is that age-related sexual hormones level play an important role in variation of SUA concentration in female individuals. Higher oestrogen concentrations in young females may provide a protective effect by promoting excretion of uric acid(Reference Anton, Garcia Puig and Ramos10,Reference Hak and Choi38) . Although menopause has been suggested as a vital factor related to elevated SUA in older females(Reference Hak and Choi38), a controversial result was proposed that ageing may be more strongly associated with the prevalence of hyperuricaemia than menopause in older females(Reference Krishnan, Bennett and Chen39). However, most studies have shown that hormone use, such as oestrogen treatment, is associated with lower SUA levels in both genders(Reference Hak and Choi38,Reference Nicholls, Snaith and Scott40) . Similarly, we did not detect any linear associations between consumption of added sugar intake from soda drinks and risk of having hyperuricaemia in age-stratified female adults. The protective effect of hormone levels, such as hormone use, might be one potential explanation for our findings.
Body adiposity is another well-documented risk factor that influences an individual’s SUA concentrations(Reference Choi, Atkinson and Karlson41). Managing body adiposity status, such as adequate BMI and/or waist circumference, may help to control and maintain healthier SUA levels(Reference Ali, Perveen and Rahman16,Reference Tanaka, Ogata and Tanaka42) . The present results support the finding that obese adults who were non/regular soda consumers still had significantly greater possibilities of having hyperuricaemia across adults of all ages in both genders, when compared with non/regular soda consumers who were under/normal weight. Furthermore, abnormal accumulation of body adiposity or lipid profiles has been suggested to play an important role in moderating SUA levels when investigating the association between individual lifestyle patterns and hyperuricaemia(Reference Choi, McCormick and Lu43). Until now, only one study has shown that the association between high-frequency SSB intake and SUA variations is only observed in overweight/obese individuals, but not in under/normal-weight individuals(Reference Dalbeth, Phipps-Green and House44). Consistently, the highest risk of SUA elevation is found among obese US adults who consume excessive amount of added sugar from soda, when compared with non/regular soda consumers with under/normal weight in all age- and gender-stratified groups (aOR ranges from 4·9 to 29·9 and 4·8 to 23·7 in males and females, respectively). In addition, we also explored some age- and gender-specific differences in the combined effect of added sugar intake from soda drinks and BMI status on the risk of hyperuricaemia. A 3·4- and 11·7-times higher risk of having hyperuricaemia was observed in overweight young and middle-aged male adults, respectively. Middle age and older females who were overweight and consumed excessive added sugar from soda drinks were observed to have a 10·7- and 2·6-higher risk of having hyperuricaemia, respectively. In particular, a significantly higher risk of having hyperuricaemia was also observed across both genders, for those who were under/normal weight and middle aged.
Limitation and strengths
Some limitations of this study warrant comment. First, hormone use has been suggested as an important factor that may affect SUA levels in older adults based on biological plausibility(Reference Hak and Choi38). However, we did not include hormone use information in our analyses due to the low number of subjects who answered questions about female hormone replacement therapy use. A bias resulting from a lack of hormone use information might be towards to null in this study because the overall rate of all types of hormone use dropped by 5 % in NHANES 2009–2010(Reference Sprague, Trentham-Dietz and Cronin45). Second, potential recall bias from 24-h dietary interviews may occur during data collection. However, the recall bias should be non-differential and minizine in this study and have a minimal effect on current findings. Third, SUA measurements were only performed at one time point and might be influenced by individual behaviours at that time, especially high-purine diet consumption. Fourth, the cross-sectional nature of these findings cannot provide causal inferences. Last, we only considered added sugar intake from soda, instead of added sugar intake from all SSB. Consequently, the total amount of fructose intake could be underestimated in this study. Furthermore, the American Heart Association recommendation for total added sugar intake was used in this study because there are still no suggested cut-offs for added sugar intake from SSB. However, our findings had a low possibility of overestimating and interpreting the association between added sugar intake from soda and SUA/hyperuricaemia.
This study also had several strengths. This study not only investigated the association between added sugar intake from soda and the risk of hyperuricaemia but also assessed the effect modification of gender and age on this association. Unlike prior studies, BMI only was adjusted for while performing statistical analyses. We further evaluated the combined effect of added sugar intake from soda and BMI status on hyperuricaemia risk within each gender- and age-specific group. In addition, types and amount of soda consumption were carefully identified and quantified based on suggested USDA codes. All data from NHANES were collected based on consistently controlled protocols and confirmed by well-trained medical personnel. Furthermore, several potential confounders that may contribute to SUA levels, such as alcohol drinking, physical activity, personal medical condition and daily consumption of total energy, total sugar, protein and fat, were controlled for while exploring our study questions.
Conclusion
The positive association between consumption of added sugar from soda drinks and hyperuricaemia varied by gender and age. Heavy consumption of added sugar from soda and overweight/obesity status was observed to be independently associated with a greater possibility of hyperuricaemia in both genders, for those who aged 35–49 years. Obesity may magnify the effect of added sugar intake from soda on the risk of hyperuricaemia for both gender individuals in each age group. Future uric acid control and management should target adults with obesity who consume excessive amount of added sugar from soda drinks.
Acknowledgements
Acknowledgements: Not applicable. Financial support: This research received no specific grant from any funding agency, commercial or not-for-profit sectors. Conflict of interest: None. Authorship: W.T.L. and T.S.T. drafted the first manuscript. W.T.L., Y.H.K. and T.S.T. contributed to the study conception and design. W.T.L., Y.H.K., H.Y.L. and T.S.T. contributed to the data analysis and the interpretation of the study. All authors contributed to edit and revise the manuscript critically and approve the final version of the article to be published. Ethics of human subject participation: This study was conducted using the National Health and Nutrition Examination Survey (NHANES) data, which is according to the guidelines laid down in the Declaration of Helsinki, and all procedures involving study participants were approved by the National Center for Health Statistics Research Ethics Review Board. Written informed consent was obtained from all subjects/patients.


