Indonesia has successfully reduced the incidence of infectious diseases, but non-communicable diseases such as diabetes, CVD, and obesity continue to increase(1). The prevalence of obesity in children and adolescent in Indonesia is currently 9·2 and 8·8 %(2). Between 2013 and 2018, there were increases in the prevalence of hypertension among adolescents from 8·7 % to 13·22 %, of stroke from 0·2 to 0·6/1000, and the prevalence of diabetes remains the same, which is 0·1 %(2,3) .
East Java is included in the top 10 of 34 provinces in Indonesia with the highest prevalence of overweight children and people with cancer, stroke, diabetes mellitus and hypertension(2). Between 2013 and 2018, the proportion of the population undertaking lower levels of physical activity in East Java continued to increase from 21·3 % to 26·5 %(2,3) . More than 90 % of the population of East Java consume less than the recommended standard of five portions of vegetables and fruits a day. In addition, as many as 57 % of people in East Java consume sweetened drinks more than once a day(2,3) .
Many studies have considered various risk factors for obesity, diabetes and CVD. One factor that has been associated with these diseases but received less attention is exposure to food and beverage advertising especially outdoor advertising(4,Reference Williams, Pasch and Collins5) . Outdoor advertising, in particular, works by integrating branded messages into people’s daily activities and the cultural landscape, as well as serving as an immediate cue for purchase when viewed in connection with food stores(Reference Kelly, King and Chapman6).
Studies of outdoor food advertisements conducted in Australia(Reference Kelly, Cretikos and Rogers7), the USA(Reference Hillier, Cole and Smith8), northern England(Reference Adams, Ganiti and White9) and New Zealand(Reference Walton, Pearce and Day10) consistently reported that most outdoor food advertisements were for unhealthy food or drinks. These advertisements varied according to neighbourhood characteristics. For example, advertisements for unhealthy foods were often found around schools in Australia and New Zealand(Reference Kelly, Cretikos and Rogers7,Reference Walton, Pearce and Day10) . Children and adolescents are exposed to unhealthy food advertisements not only around schools but also in public places where they gather, such as recreational parks, places of worship and playgrounds(Reference Liu, Barr and Pearson11).
Outdoor advertising creates repeated exposure for children as they visit these places frequently(Reference Kelly, King and Jamiyan12). The repeated exposures build product and brand familiarity and influence children’s desire to purchase and consume the advertised products and brands.(4). Previous research on alcohol advertising has shown that increased exposure to alcohol advertisements around schools influences adolescent intention to use alcohol(Reference Pasch, Komro and Perry13). A similar process can occur for food and beverage advertising, linked to a range of effects that ultimately lead to poor diet and health outcomes(Reference Kelly14).
A survey in ten major cities in Indonesia shows that Indonesians spend 1 h and 48 min outdoor daily and are exposed to outdoor advertisement at least ten times a week, creating the repeated exposures needed to stimulate purchase(15). When started at young age, purchase behaviour of unhealthy products can develop into a long-term habits that can increase the risk of obesity, diabetes and CVD(Reference Cohen and Lesser16).
However, despite the increasing prevalence of obesity, diabetes and CVD and the omnipresent of Food and Beverage advertisement (F&B adverts), there is currently no information available on the density of F&B adverts in Indonesia and their placement, let alone details of whether the advertisements were of healthy or unhealthy products. At the policy level, only alcohol beverages advertisement is regulated in several districts and there is only one known district (Banyuwangi District) of the 514 districts and cities in this country that prohibits any advertisement 25 m from schools(Reference Sebayang, Dewi and Lailiyah17). To advocate for a policy change, studies on F&B advertisement are needed.
Therefore, the aim of this study was to survey areas around gathering places for children and adolescents to identify outdoor F&B adverts that may be risk factors for obesity, diabetes and CVD, in order to provide evidence for policy making. Different from other studies that observe advertisements a certain distance from schools(Reference Kelly, King and Jamiyan12,Reference Missbach, Pachschwöll and Kuchling18) , to enable stronger evidence for policy, this study surveyed all types of advertisements in the total area of the study locations and calculated their distance from schools and other types of facilities used by children and adolescents.
Methods
Survey locations
The current study was conducted in July–September 2019 in Surabaya, the capital city of East Java to represent an urban location and Banyuwangi District, a thriving eco-tourism district to represent a more rural setting. We first selected a sub-district with the highest population, a high density of school and high possibility of implementing policy change in Banyuwangi District. Subsequently, we chose a sub-district in Surabaya City with a population similar to that of Banyuwangi and with high number of schools. We then selected a contiguous sub-district for each for the selected sub-districts in Banyuwangi and Surabaya. This resulted in four sub-districts: Mulyorejo and Sukolilo sub-district of Surabaya City and Banyuwangi and Giri sub-district of Banyuwangi District.
Data collection
The surveys were performed by teams of two trained enumerators, each with at least 1 year of study experience at the tertiary level in the health sector. There were four teams in Banyuwangi and five teams in Surabaya. The data were collected using the KoBoCollect application on an Android-based mobile phone(19). The enumerators walked or rode a motorbike around all the roads and alleys in the study location and recorded the GPS coordinates and photographs of the F&B adverts and the facilities used by children and adolescents. A quality control team revisited at random selected GPS coordinates sent from the mobile application into the server. This was to ensure that the location and information entered into the server were correct.
We surveyed all types of F&B adverts that were visible from all the roads and alleys in the study location including banners, posters, billboards, video advertisements, outdoor advertisements on shops and stalls, stickers, merchandise and any other items containing food and beverage advertisement. The facilities used by children and adolescents included schools (non-formal education, primary schools, middle schools, high schools and higher education level); sports centres; places of worship; recreation centres and other gathering sites (playgrounds, Quranic schools, child-care centres, kindergartens and playgroups). The selections of facilities were made based on list of children and adolescents facilities listed in regulations limiting advertisement and regulations for tobacco advertisement and sales zones.
Categorisation of the advertisements
We checked nutritional values of the product being advertised from the nutritional information available on the product package or from the product food labelling available in the Internet. To classify a product as healthy and unhealthy, we cross checked the nutritional values against the Indonesian nutritional criteria for packaged food and beverage in the Indonesian Drug and Food Agency Regulation No 13/2016 on the supervision of claims on labels and advertisements of processed foods(20). Based on this regulation, beverages were categorised as unhealthy if they contained alcohol or high levels of sugar (6 g/100 ml). The regulation does not limit the use of artificial sweeteners. In addition, artificial sweeteners were not considered to be a factor for the increased risk of obesity, diabetes and CVD and thus using artificial sweeteners do not classify a product to be unhealthy in the current analysis. Foods were categorised as unhealthy if they contained high levels of sugar (10 g/100 g), salt (300 mg/100 g) and/or fat (18 g/100 g).
Statistical analysis
F&B adverts were counted in two ways: as individual advertisements and as sets of similar advertisements at a single location. For example, if there were four advertisements for brand X and three for brand Y at a particular location, this would be counted as seven individual advertisements and two sets of advertisements. In the descriptive analysis, we assessed the number of F&B adverts according to the type of advertisement and the product type, and the numbers of F&B adverts according to the area, the number of children and adolescents in the area, and the distance from facilities used by children and adolescents. District-level data about areas and populations of children and adolescents were obtained from the local statistics bureau report forms(21–24).
The main measures of interest in this study were the densities of outdoor F&B adverts for healthy and unhealthy products within a radius of 100 m, 100–300 m and 300–500 m from facilities used by children and adolescents. The 100 m and 300 m distance was chosen as a limit for a 5 min and 10 min walk(Reference Megatsari, Ridlo and Amir25), and the maximum 500 m was chosen as this is a maximum distance a child or adolescent can walk comfortably. We calculated the number of neighbouring sets of advertisements from each type of facility within each radius using their GPS locations to calculate their distance adjusting for the Earth’s radius at the Equator in Stata 14. Densities were calculated by dividing the number of neighbouring sets of F&B adverts by the area within the radius (in km2).
We conducted a hotspot analysis to identify statistically significant locations with high number (hotspots) of unhealthy and low number (cold spots) of healthy product advertisements. Because of the limited number of advertisements found, we combined healthy foods and beverages for the cold spot analysis and combined unhealthy foods and beverages for the hotspot analysis. We divided the study area into a grid of 500 × 500 m because we estimated that children and adolescents could walk comfortably for a maximum distance of 500 m and also because this is the distance commonly used in policy for sales restriction and zonation. Grids with significantly higher or lower numbers of sets of F&B adverts at the 1 and 5 % significance levels compared with the neighbouring grids were identified using the Getis-Ord Gi* spatial statistic in the Hotspot Plugin in QGIS 2.8(Reference Oxoli, Prestifilippo and Bertocchi26).
Results
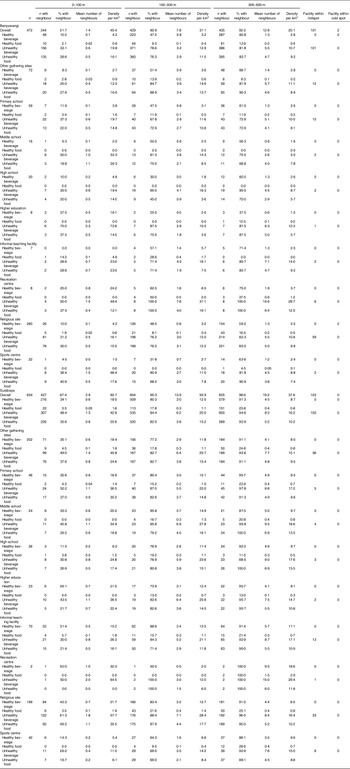
The number of sets of F&B adverts as a proportion of all outdoor advertisements was slightly higher in Banyuwangi than in Surabaya. Of the 570 F&B adverts recorded in Banyuwangi, 227 (39·8 %) and 273 (47·9 %) were for unhealthy foods and beverages, respectively. Of 960 F&B adverts in Surabaya, 271 (28·2 %) and 445 (46·3 %) were for unhealthy foods and beverages. The advertisements for unhealthy beverage that were widely advertised were packaged tea drinks (bottles, glasses and cartons), powder drinks and packaged sugar coffee. Unhealthy food advertisements that were advertised were ice cream, instant noodles, frozen food (sausages, nuggets) and snacks.
Surabaya had double the density of F&B adverts than Banyuwangi (27·3 v. 11·1/km2), but the numbers of F&B adverts per 1000 children and adolescents were similar (16·4 v. 13·6/1000 adolescents). Banners were the most common type of F&B adverts in Banyuwangi (57·0 %) and Surabaya (50·6 %), followed by posters (13·7 % in Banyuwangi and 22·0 % in Surabaya) and store name boards (10·4 % in Banyuwangi and 10·0 % in Surabaya). Both districts had examples of other types of F&B adverts, including hoardings (billboards), merchandise, stickers and vending machines (Table 1).
Table 1 Distribution of outdoor food and beverage advertisements (‘F&B ads’) in Banyuwangi District and Surabaya City
‘F&B ad’ refers to each individual advertisement, whereas ‘F&B ad sets’ refer to groups of advertisements at a single location all for the same brand.
Most of the F&B adverts in both districts were for unhealthy foods or beverages. In Banyuwangi, there were 4·5 times more unhealthier beverage advertisements compared with healthy beverage advertisements (47·9 % v. 10·5 %) and 22·1 times more unhealthy food advertisements compared with healthy food advertisements (39·8 % v. 1·8 %). In contrast, in Surabaya, there were less ratio of unhealthy over healthy products with only 1·9 times unhealthier beverage advertisements compared with healthy beverage advertisements (46·3 % v. 23·7 %) and 15·6 times more unhealthy food advertisements compared with healthy food advertisements (28·2 % v. 1·8 %). Most advertisements for unhealthy beverages were for high-sugar beverages in both Banyuwangi (47·2 %) and Surabaya (46·1 %) (Table 1).
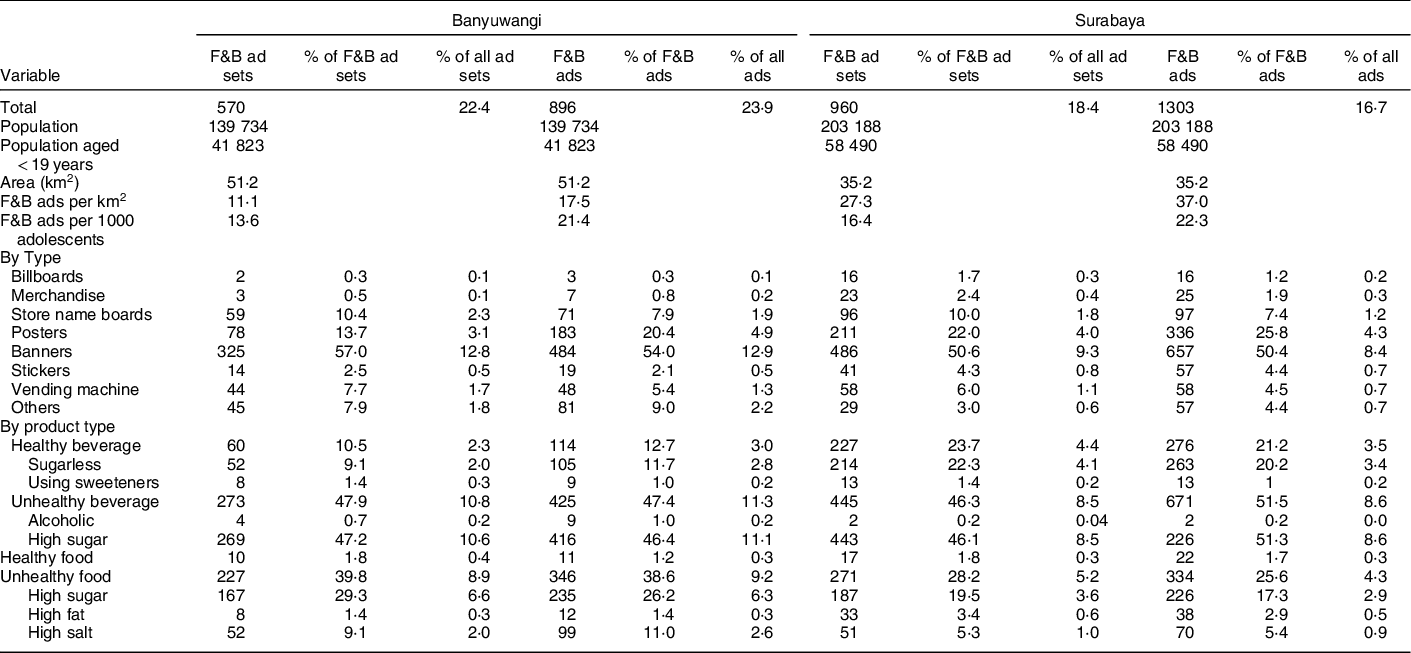
In Banyuwangi, 472 facilities used by children and adolescents were identified. Of these, the proportions with at least one neighbour with at least one set of F&B adverts at distances of 0–100, 100–300 and 300–500 m were 51·7, 90·9 and 92·2 %, respectively. In Surabaya, 634 facilities used by children and adolescents were identified. Of these, the proportions with at least one neighbour with at least one set of F&B adverts at distances of 0–100, 100–300 and 300–500 m were slightly higher than that of Banyuwangi with 67·4, 95·3 and 98·6 %, respectively (Table 2).
Table 2 Mean numbers of food and beverage advertisements within various distances of facilities used by children and adolescents in Banyuwangi District and Surabaya City
In all facilities (Banyuwangi and Surabaya), the density of F&B adverts increased closer to the facilities for children and adolescents. The density of sets of F&B adverts at a distance of 0–100 m from facilities in Surabaya was double than that in Banyuwangi. In Banyuwangi, the highest density of sets of unhealthy beverage advertisements was near sites of higher education (72·6/km2 at 0–100 m, around seven times the density at 100–300 m). In contrast, the highest density of sets of unhealthy beverage advertisements in Surabaya was at recreation centres and religious sites (64·5/km2 and 57·7/km2, respectively, around 5·4 and 2 times the densities at 100–300 m) (Table 2).
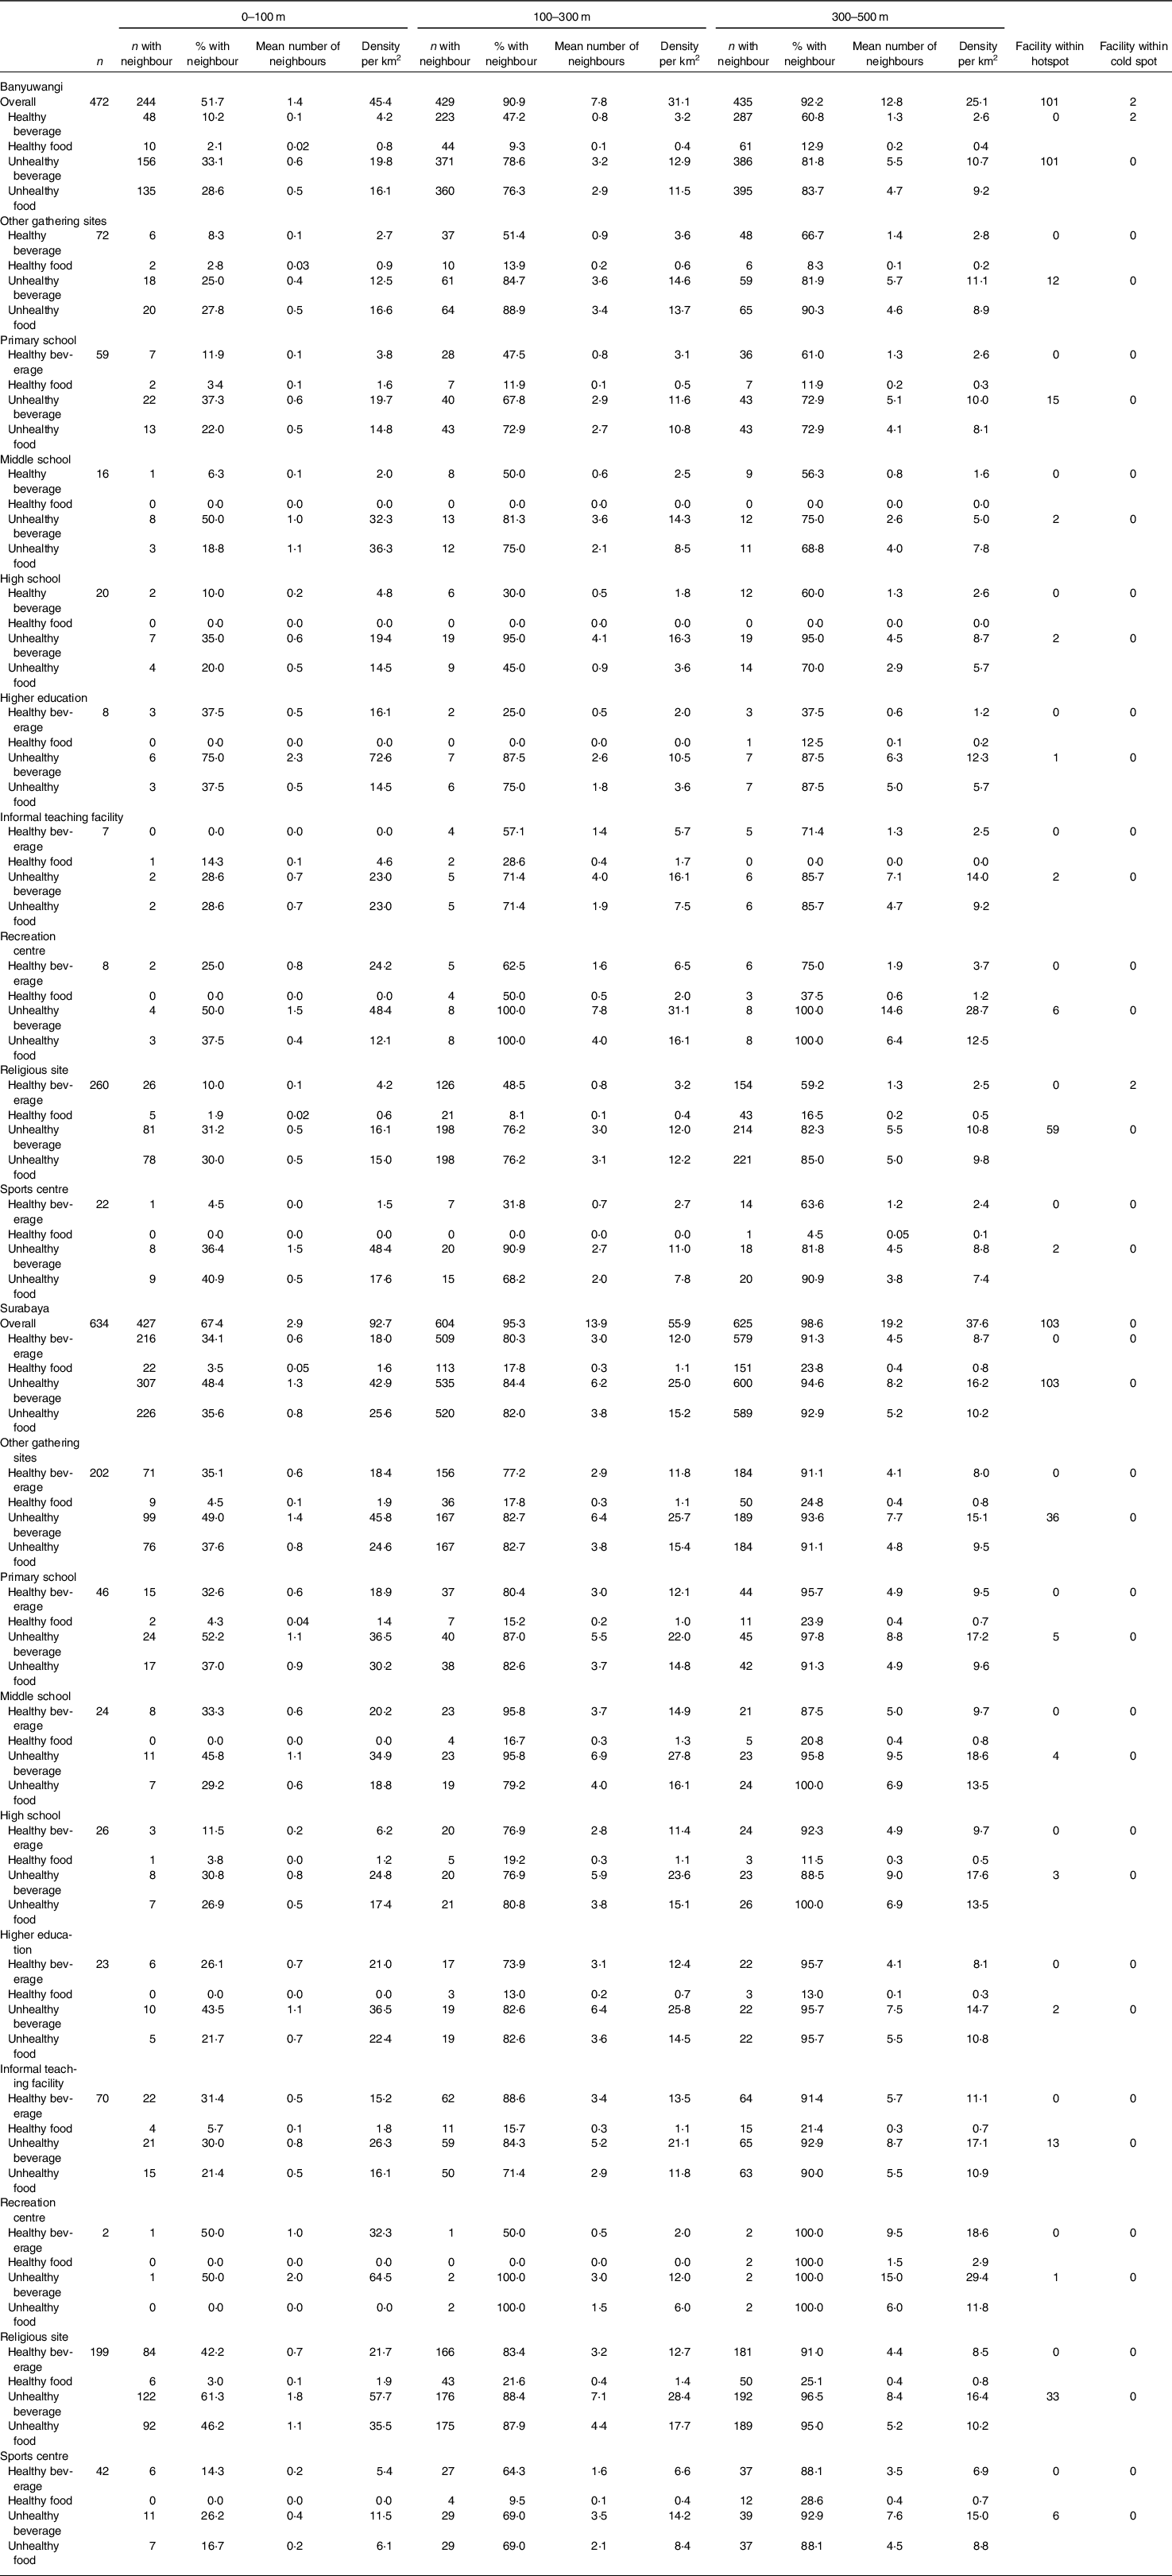
The hotspot and cold spot analyses (Figs 1 and 2) showed both districts had one hotspot with significantly high numbers of sets of unhealthy F&B adverts and a single cold spot with a significantly low number of sets of healthy F&B adverts in Banyuwangi and no cold spot in Surabaya. In Banyuwangi, the hotspot area of unhealthy F&B adverts covered 2·25 km2 at a significance level of 1 % and 3·25 km2 at a significance level of 5 %, whereas the cold spot area of healthy F&B adverts covered 0·25 km2 at both significance levels. In Surabaya, the hotspot area of unhealthy F&B adverts covered 0·75 km2 at a significance level of 1 % and 2·25 km2 at a significance level of 5 %. The number of facilities used by children and adolescents within the unhealthy F&B advert hotspots in Banyuwangi and Surabaya was similar (101 in Banyuwangi and 103 in Surabaya). Most of the facilities within the unhealthy F&B advert hotspots in Banyuwangi were other gathering sites, primary schools and religious sites (12, 15 and 59, respectively); in Surabaya, most were informal schools, religious sites and children’s playgrounds (13, 33 and 36, respectively) (Table 2). Banyuwangi had two facilities within the healthy F&B advert cold spots; both were religious sites (Table 2).
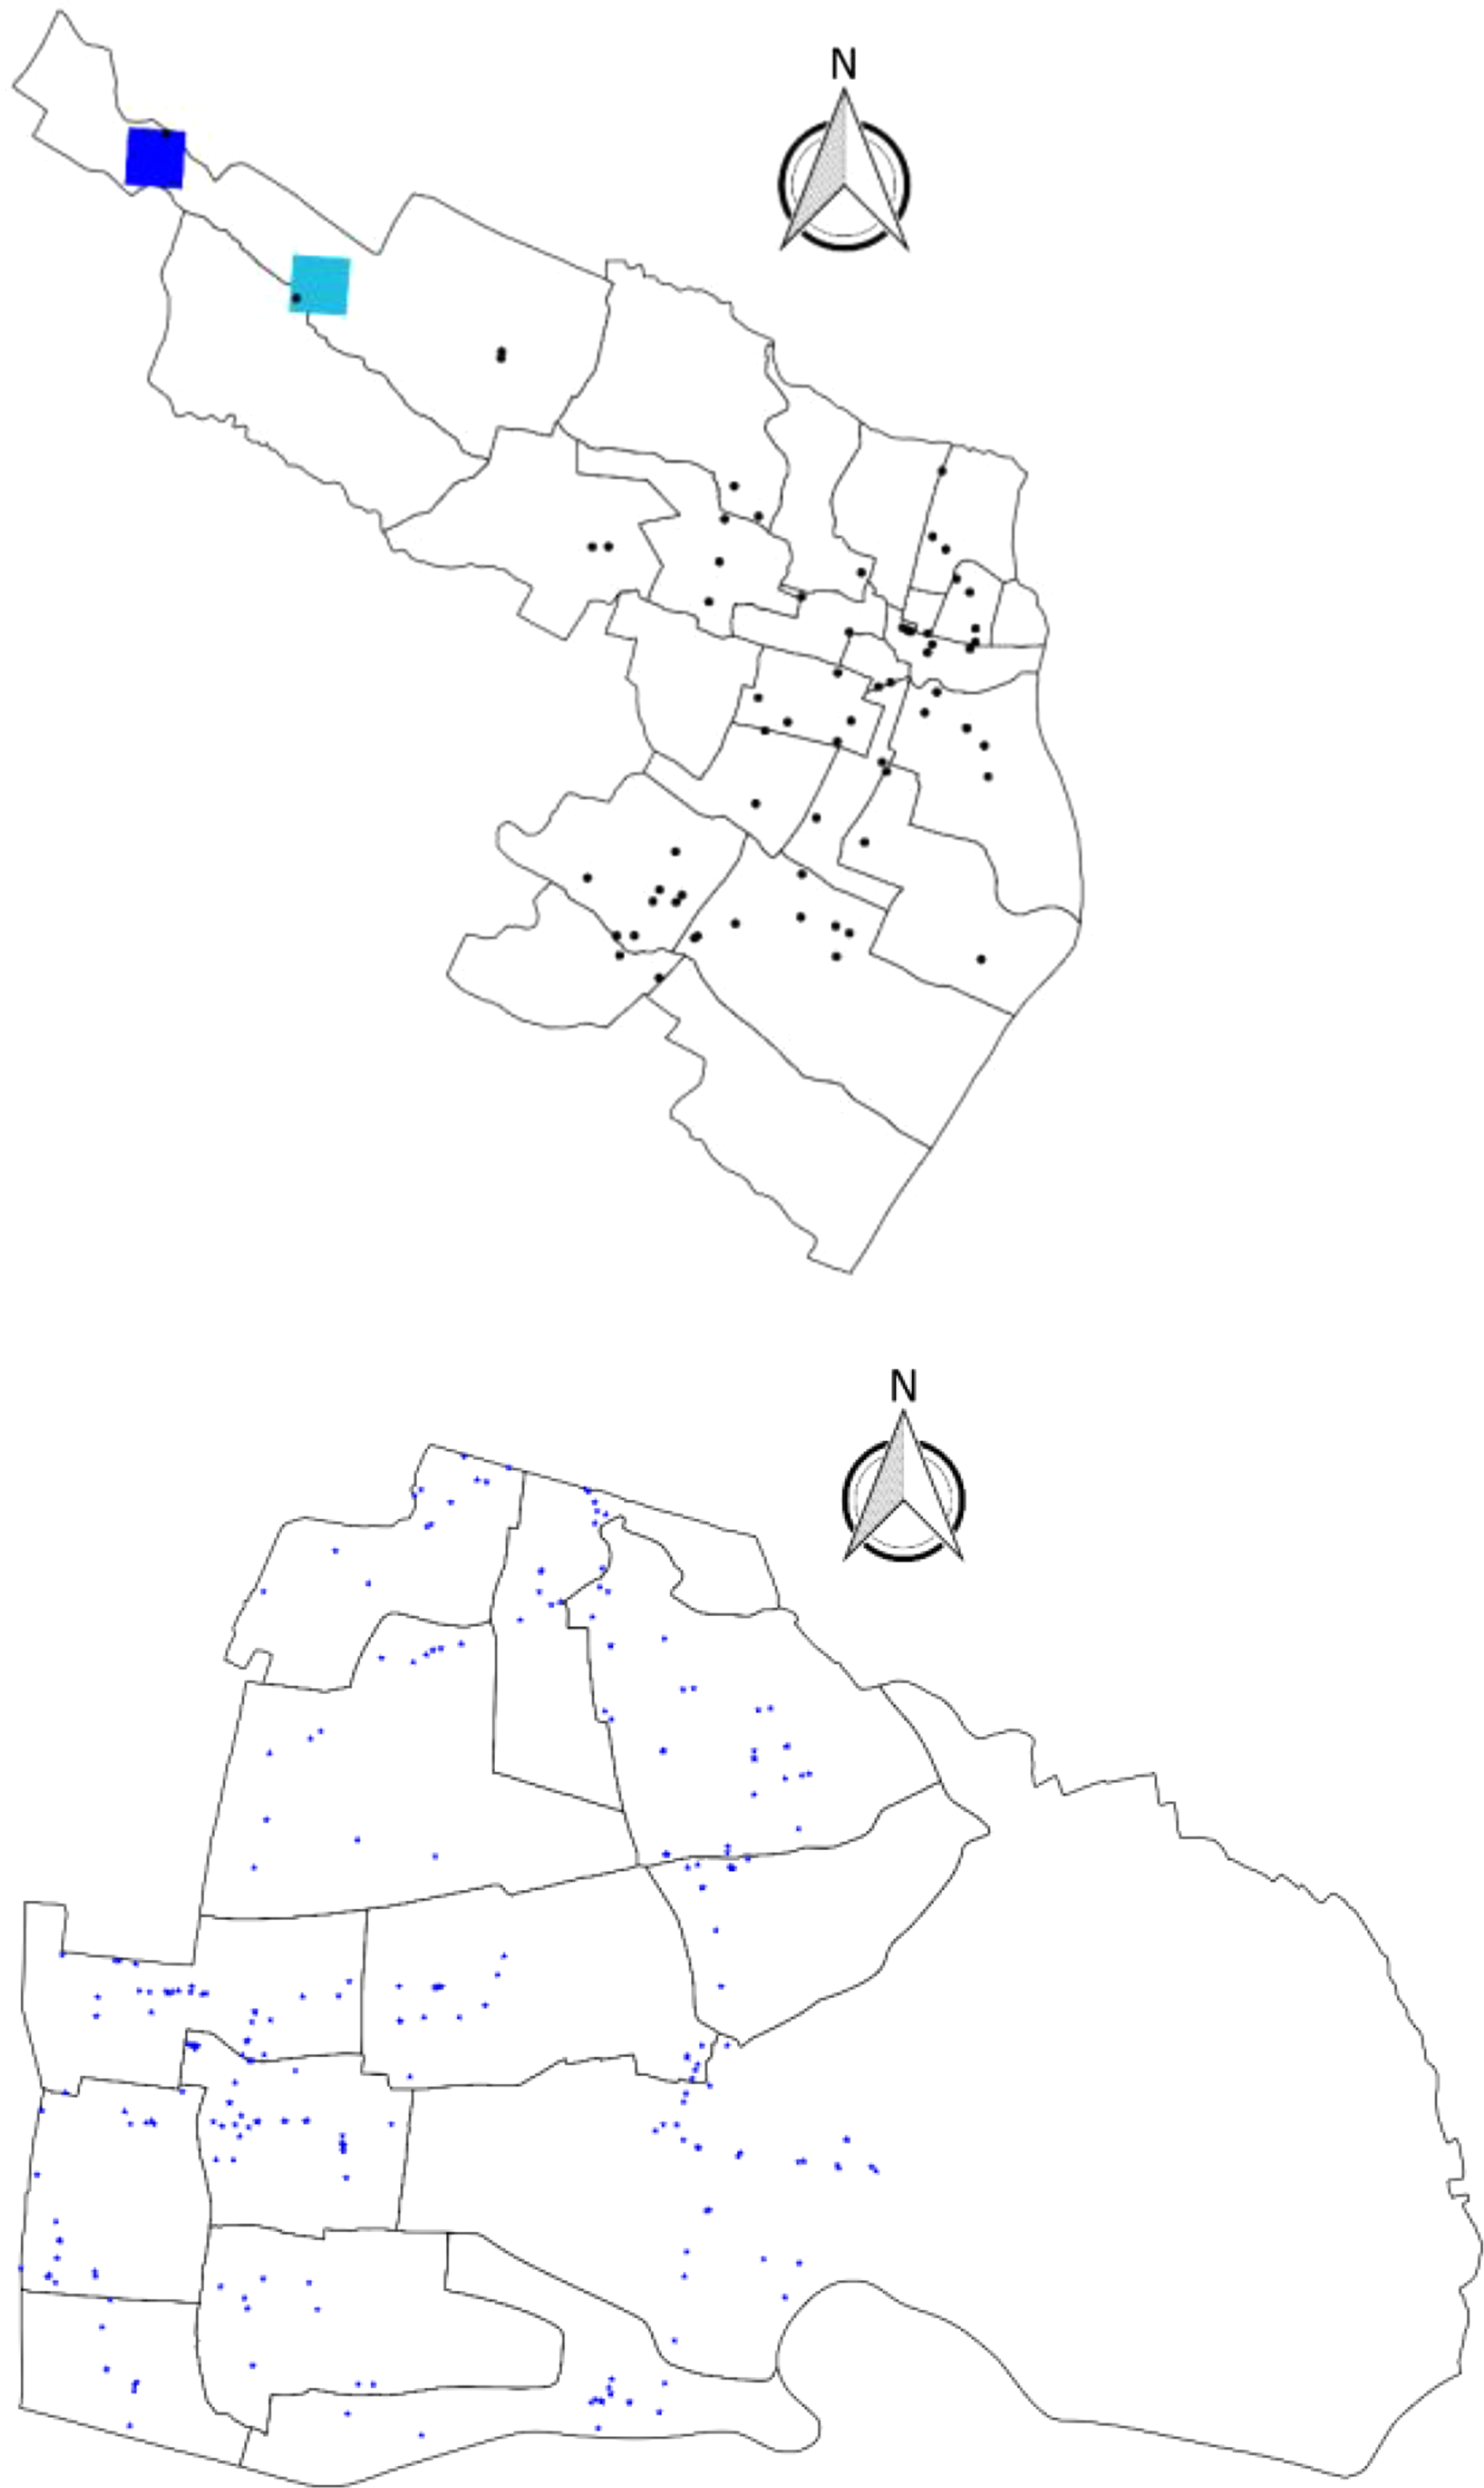
Fig. 1 Cold spots of healthy food and beverage advertisements in Banyuwangi (upper map) and Surabaya (lower map). Healthy Food and Beverage Ads, ![]() , Healthy F&B Ads, Hotspot Healthy F&B Ads;
, Healthy F&B Ads, Hotspot Healthy F&B Ads; ![]() , coldspot 99 % confidence;
, coldspot 99 % confidence; ![]() , coldspot 95 % confidence
, coldspot 95 % confidence
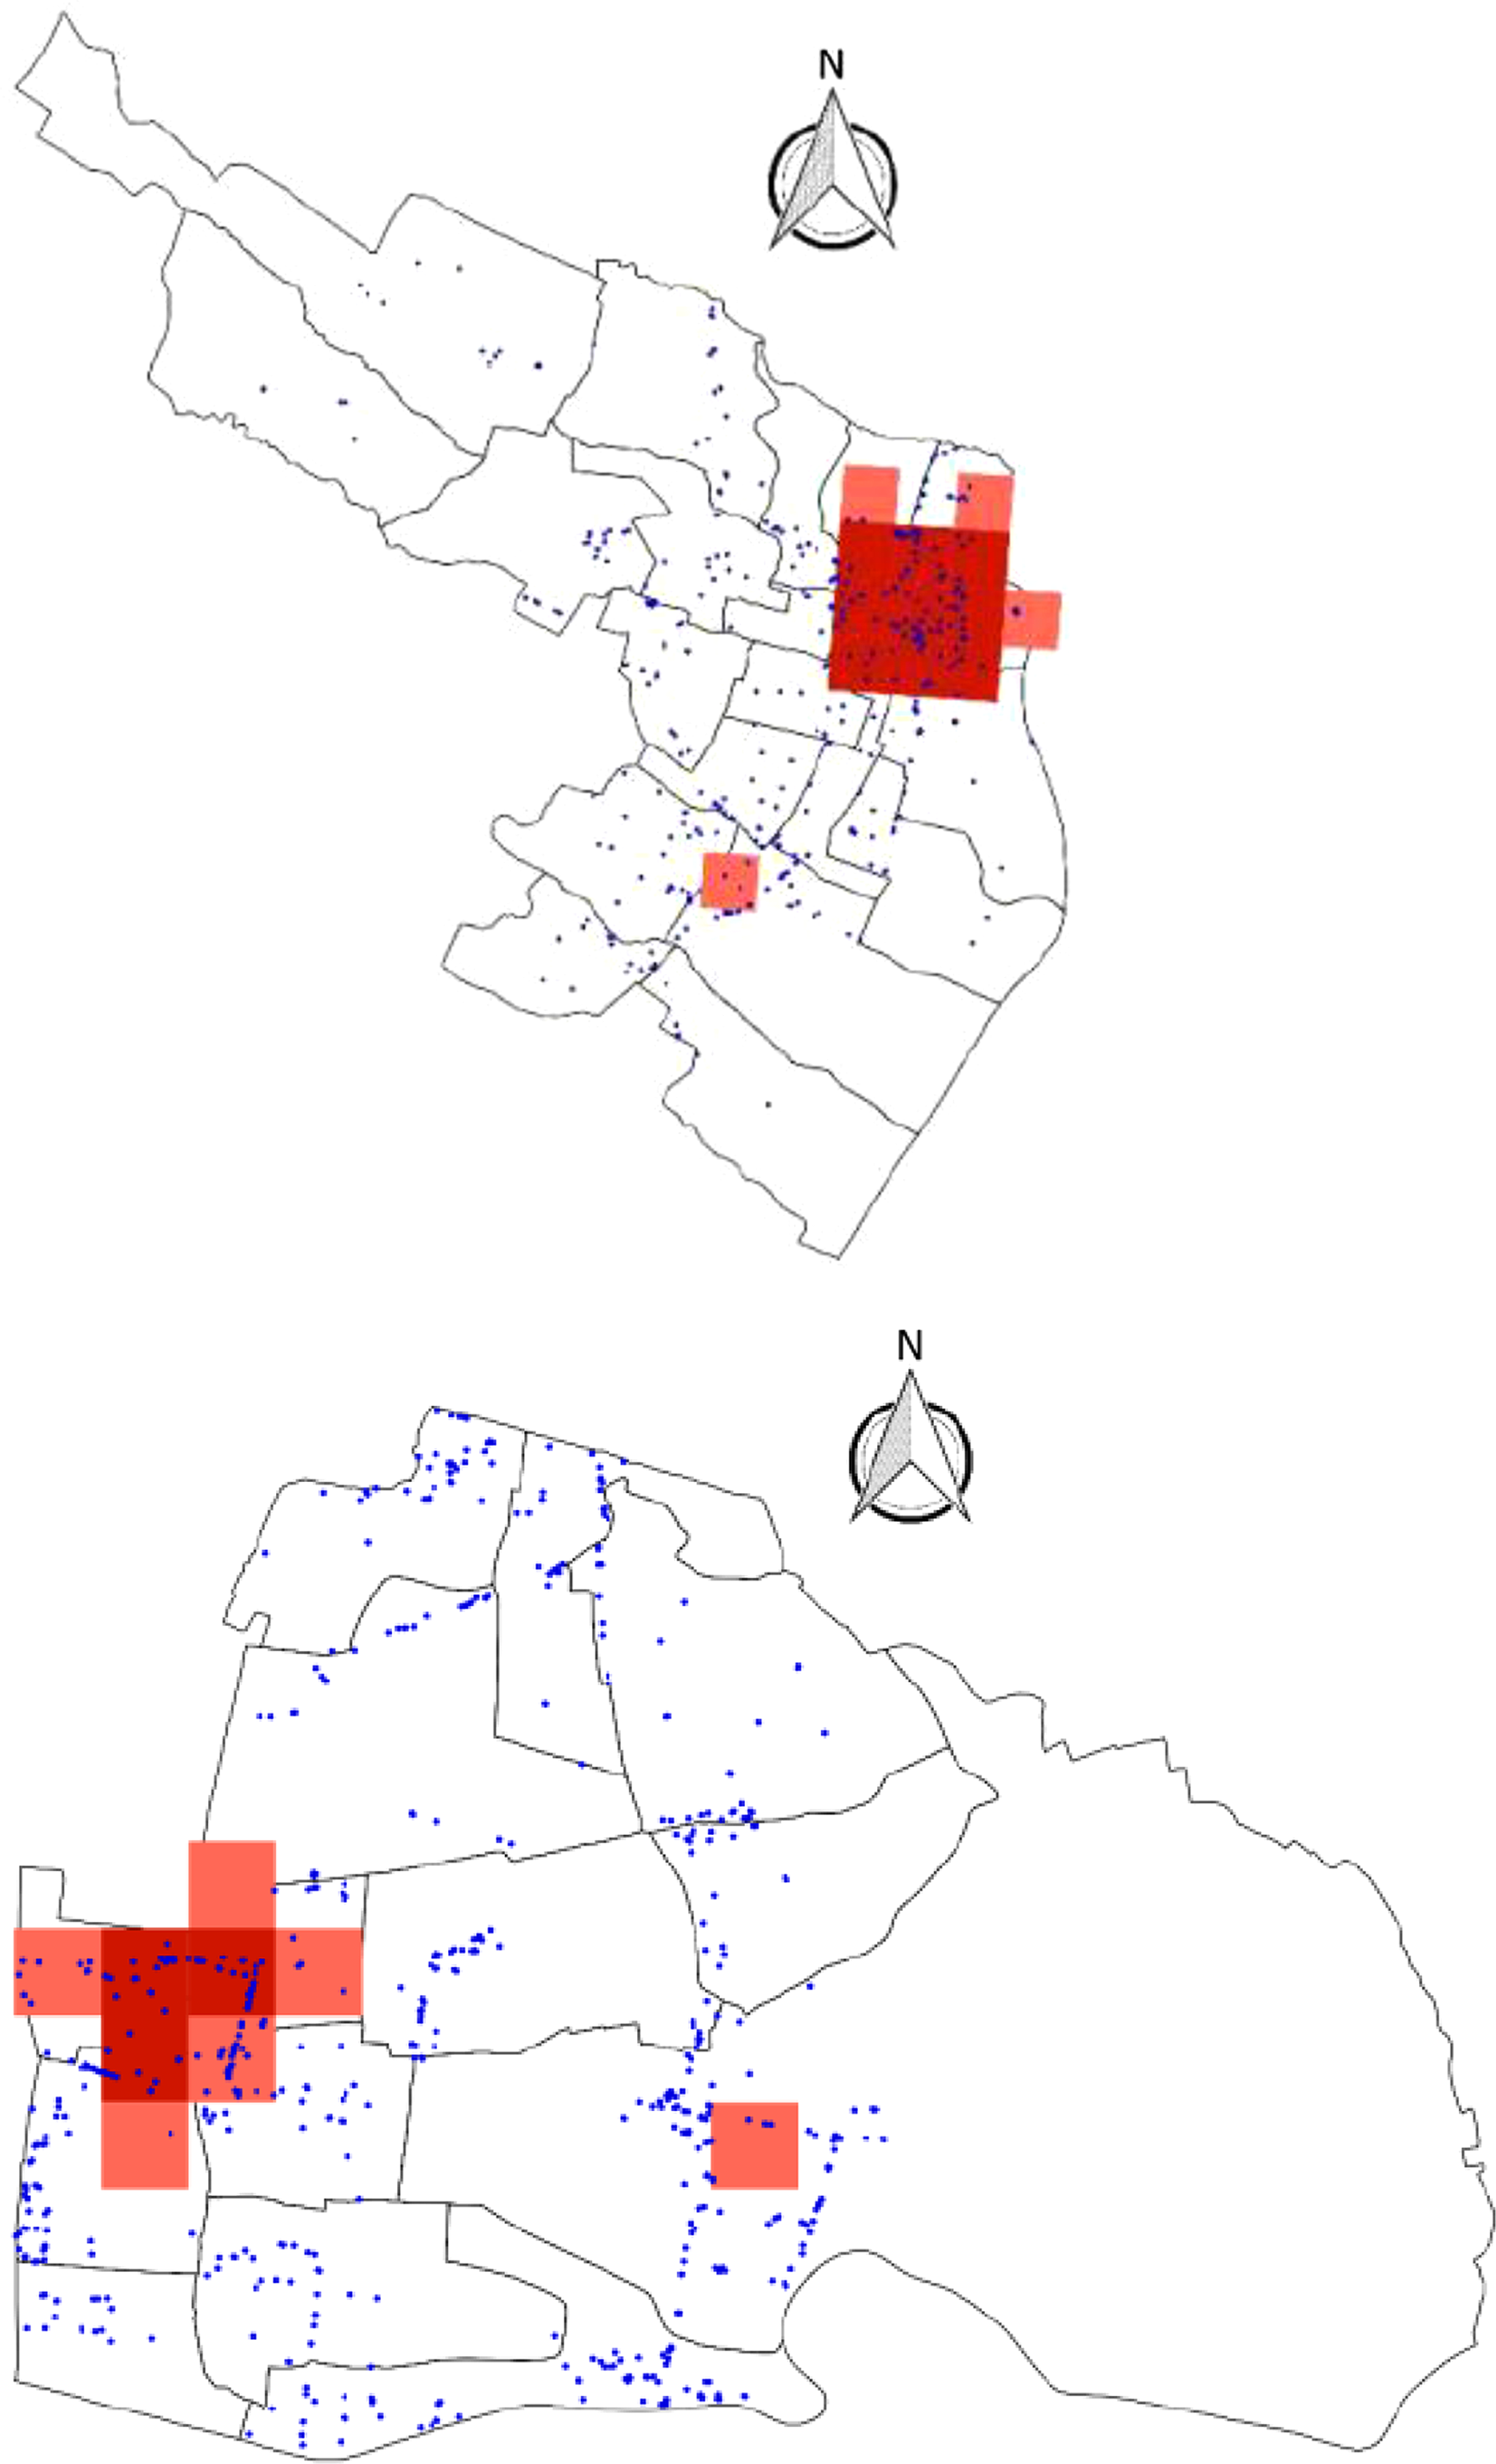
Fig. 2 Hotspots of unhealthy food and beverage advertisements in Banyuwangi (upper map) and Surabaya (lower map). Unhealthy Food and Beverage Ads, ![]() , unhealthy F&B Ads, Hotspot unhealthy F&B Ads;
, unhealthy F&B Ads, Hotspot unhealthy F&B Ads; ![]() , hotspot 95 % confidence;
, hotspot 95 % confidence; ![]() , hotspot 99 % confidence
, hotspot 99 % confidence
Discussion
General findings
The current study showed that the proportion of F&B adverts among all outdoor advertisements was slightly higher in Banyuwangi than in Surabaya, although the density of sets of F&B adverts in Surabaya was two times that in Banyuwangi. It also showed that in both locations, advertisements for unhealthy foods and beverages increased nearer to facilities where children and adolescents gather. The coverage of unhealthy hotspots F&B adverts was greater in Banyuwangi than in Surabaya. There is a location in Banyuwangi where the number of healthy F&B adverts was significantly lower than its surrounding.
Comparison with other studies
The findings of this study are consistent with those of a study conducted by Kelly et al. (Reference Kelly, Cretikos and Rogers7,Reference Kelly, King and Jamiyan12) in Mongolia (Ulaanbaatar), the Philippines (Manila) and Australia (Sydney), which reported that food advertisements increased closer to schools. The density of food advertisements in an area closest to schools was almost double than that in an area far from the school (0·9 v. 0·5 advertisements per 100 m2 in Ulaanbaatar; 6·5 v. 3·3 per 100 m2 in Manila; and 1·2 v. 0·6/100 m2 in Sydney). The present study showed that more of the F&B adverts found around the child and adolescent facilities were for unhealthy products than healthy ones, consistent with the results of Kelly et al. (Reference Kelly, King and Jamiyan12) and Missbach et al. (Reference Missbach, Pachschwöll and Kuchling18). Kelly et al. reported that the advertisements found around schools were commonly for unhealthy foods and beverages(Reference Kelly, King and Jamiyan12), and Missbach et al. reported that as many as 84·2 % of food advertisements within 950 m of 46 schools in the UK were for ‘less healthy’ foods(Reference Missbach, Pachschwöll and Kuchling18). Velazquez et al. (Reference Velazquez, Daepp and Black27) also reported that food advertisements around schools in Vancouver were often for unhealthy foods. Liu et al.’s research in New Zealand reported that children were exposed to advertisements for unhealthy foods around shopping areas, main streets, public transportation and sports venues(Reference Liu, Barr and Pearson11). It can be concluded that children and adolescents might be more exposed to unhealthy F&B adverts, in line with research conducted by Kelly et al. (Reference Kelly, King and Jamiyan12).
Possible explanation
In today’s society, young people see outdoor advertisements for unhealthy foods and drinks everywhere at frequent times throughout the day, such as on the way to and from school every school day(Reference Kelly, King and Jamiyan12). The American Psychological Association Task Force on Advertising and Children (gave special consideration to commercialism in schools for two reasons. First, children spend a considerable amount of their childhood in the school setting, and, because school attendance is compulsory, the children have little freedom to avoid seeing the commercial content they are exposed to in schools. Second, it is conceivable that the commercial content presented in schools is assumed by the children to have the tacit endorsement of respected teachers and school officials, thereby enhancing the effectiveness of the advertising(Reference Wilcox, Kunkel and Cantor28).
Children and adolescents have greater autonomy and decision-making power within the family than in previous generations, and they can easily ask parents to buy what they want. They have ‘Pester Power’ which is an ability possessed by children to whimper and nag their parents to buy things they want. Pester Power is used for marketing strategies for food and drinks in children because it is very powerful(Reference Lawlor and Prothero29). Advertisers use children and adolescents as their target because they can influence their parents’ purchasing decisions and they are future adult consumers(30).
To invest on these future consumers, advertisers build purchasing habits and brand awareness among children despite the fact that children do not have the ability to assess the content and advertising messages(Reference Wilcox, Kunkel and Cantor28). The purchasing habits and brand awareness will develop over time as a function of intellectual development and cognitive growth(Reference Wilcox, Kunkel and Cantor28). In fact, in 2006 in the USA, forty-four companies, including Kraft Foods, Pepsi Co, and Nestle as top spenders, spent a total of $ 1 618 600 000 to promote food and drinks to children and adolescents through television, radio, print media, food packaging, in-store display materials and marketing in schools(31).
Outdoor advertising has an impact on nutritional knowledge, food preferences and consumption patterns(32). On the other hand, Lesser(Reference Lesser, Zimmerman and Cohen33) stated that the odds of obesity are positively associated with the percentage of outdoor advertising promoting food or non-alcoholic drinks, after being controlled by race, age and educational status.
Strengths and limitations of the study
To the best of our knowledge, this is the first report on food and beverage advertisements in Indonesia. The study findings can be used to identify priority areas for policy action. Although the findings may not be generalisable to the whole of Indonesia, our results provide information for both a big city (Surabaya city) and a small district (Banyuwangi District). However, we did not categorise advertisements for foods and beverages with low nutritional value, so there might be an underestimation in the calculations of unhealthy advertisements. We used a hotspot plugin in QGIS 2.8 that is not as sophisticated as that available in ArcGIS. We therefore could only analysed the hotspots of F&B adverts using number of location points in 500 × 500 m grids. The 500 m grids might be arbitrary; however, this is the maximum distance for a comfortable walk for a child and adolescents. Also, as this is the most commonly used distance for zoning regulation, the study provides evidence that fits for policy discussion regarding zonation. In addition, the study was focused on exploration of outdoor F&B adverts density and proximity to facilities used by children and adolescents. As such the study did not determine the causal relationship between these factors and the prevalence of obesity, diabetes and CVD.
Policy implications
Public policies are needed to protect children and adolescents from marketing unhealthy foods. Not doing anything or merely monitoring the unhealthy F&B adverts will be unethical as the government of Indonesia are obliged to protect children and adolescents from stimulation for unhealthy behaviours. Looking at the unsuccessful attempt of Indonesia to ban all types of cigarette adverts, banning all unhealthy F&B adverts will also face major obstacles. Therefore, following Nuffield Ladder of intervention, we propose several interventions. First, to enable the public to make healthier choice, healthy F&B adverts only zonation such as ‘green food zone’ in South Korea(34) can be adopted and placement of outdoor unhealthy F&B adverts within 500 m near children and adolescent facilities in Indonesia should be banned. Second, the density of advertisements for healthier options should be increased by giving incentives to food and beverage industry to advertise their healthy products. Our study in Banyuwangi revealed a cold spot where the number of healthy F&B adverts is very low compared with its surrounding. The incentives can be in the form of waiver for advertising tax and easier permit. Third, disincentives can be used by imposing taxes on outdoor advertisements for unhealthy foods and beverages(Reference Lesser, Zimmerman and Cohen33).
Future studies are needed to evaluate the effectiveness of each programme in reducing the prevalence of advertisements for unhealthy foods and beverages. Studies are also needed to assess the impact of advertisement on the eating behaviour of children and adolescents.
Conclusion
In both Surabaya and Banyuwangi, the outdoor advertisements for unhealthy foods and beverages outnumbered those for healthy products. The density of advertisements increased towards facilities used by children and adolescents. Most areas in Banyuwangi and Surabaya are covered by unhealthy F&B adverts hotspots. Banyuwangi has locations needing more healthy F&B adverts. There is an urgent need for the appropriate regulation of outdoor advertising for unhealthy foods and beverages, especially in the vicinity of locations used by children and adolescents.
Acknowledgements
Acknowledgement: The authors wish to thank the local government of Banyuwangi and Surabaya. Financial support: The current study was funded by Universitas Airlangga’s Riset Mandat Grant No. 360/UN3.14/LT/2019. Conflict of interest: All authors declared no conflict of interest. Authorship: S.I.P. helped design the study, conducted training, coordinated field data collection, conducted data cleaning and analysis and prepared the manuscript. D.M.S.K.D. helped design the study, conducted training, data analysis and revised the manuscript. E.A. helped design the study, conducted training, coordinated field data collection, conducted data cleaning and revised the manuscript. D.K. helped design of the study and analysis and revised the manuscript. S.M. helped design the study and revised the manuscript. S.K.S. designed the study, conducted data collector training, designed data architecture, conducted data cleaning and analysis and revised the manuscript. Ethics of human subject participation: The current study was conducted according to the guidelines laid down in the WHO-CIOMS 2016, and all procedures involving research study participants were approved by the Ethics Committee of the Faculty of Public Health Universitas Airlangga, with a certificate number 172/EA/KEPK/2019.