


Over the past two decades, there has been increasing evidence and concern over the transformation of developing countries’ food systems from traditional to Western-type patterns. Food is produced using energy-intensive inputs, highly processed and increasingly sold through supermarkets and fast-food franchises from Western countries(1–Reference Pingali4). The consequent increase in the affordability and availability of foods, combined with economic growth, globalisation and urbanization, has led to what has become known since the 1990s as the ‘nutrition transition’(Reference Popkin5–Reference Popkin10).
A manifestation of the nutrition transition, according to Barry Popkin, its originator, is that ‘modern societies seem to be converging on a diet high in saturated fats, sugar, and refined food, but low in fiber – often termed the “Western diet”’(Reference Popkin and Gorden-Larsen9). Moreover, compared with Western countries, where the nutrition transition from a diet heavy in starchy staples to the modern Western diet took more than two centuries, the nutrition transition in developing countries has taken only a few decades(Reference Uusitalo, Pietinen and Puska11,Reference Grigg12) .
Drewonowski & Popkin(Reference Drewnowski and Popkin6), in 1997, are the first to report evidence of global dietary convergence to the Western diet. Building on the work by Périssé et al. (Reference Périssé, Sizaret and Francois13) 30 years earlier, the authors use Food Balance Sheets (FBS)(14) for ninety-eight countries in 1962 and 133 in 1990 to estimate the effect of income per capita, globalisation and urbanisation on the respective proportions of total energy intake per capita from vegetables and animal fats, carbohydrates, energetic sweeteners and protein. They find a strong association between diet, income and urbanisation, concluding that the results ‘point to global convergence toward a diet deriving a higher proportion of energy from fat, (and) the diet more closely approximates the diets of the United States and Western Europe than any traditional diet in Asia or Africa’.
A similar assessment using graphical analysis is reached by a 2004 FAO report on The State of Food Insecurity in the World(Reference Mendez, Du and Popkin15). The report makes a distinction between dietary convergence and dietary adaptation. Dietary convergence describes increasing similarity in global diets, consisting of ‘a narrow base of staple grains [wheat and rice], increased consumption of meat, dairy products, edible oil, salt and sugar, and a lower intake of dietary fibre’. Dietary adaptation refers to increasing out-of-home consumption and the purchase of brand-name processed foods as time-saving foods in response to the time constraint imposed by the rapid pace and time pressures of urban lifestyles.
Focusing specifically on globalisation and diet, Hawkes(Reference Hawkes16) explores three processes through which globalisation affects dietary patterns: food trade, foreign direct investment and global food advertising. Exploring each mechanism via case studies based on FBS data, Hawkes concludes that, while globalisation may benefit high-income groups in terms of access to healthier foods, ‘lower-income groups may experience convergence towards poor quality obesogenic diets, as has been observed in western countries’.
Pingali(Reference Pingali4), also using FBS data and comparing the compositions of Asian diets between 1979 and 2001, examines the role of globalisation mechanisms suggested by Hawkes(Reference Hawkes16). He reports a decline in the proportion of energy intake from cereals from 66·53 to 56·27 % and a rise in the proportion from animal sources from 7·92 to 13·66 %. Attributing the change to income growth, urbanisation and globalisation, Pingali concludes that ‘current food consumption patterns [in Asia] are showing signs of convergence towards a Western diet’.
Imamura et al. (Reference Imamura, Micha and Khatibzadeh17), using data from 325 consumer-level dietary surveys from various countries, examine the trends in healthy v. unhealthy dietary patterns. Older adults are reported to have better diets than younger adults do, women also consume healthier food than men and higher-income countries saw more improvement in their diets than lower-income countries. However, the study suggests ‘no single convergence of nutrition transition into homogeneous unhealthy diets’. Though the authors do not explicitly use the term ‘Western diet’ to characterise the unhealthy dietary pattern, they conclude that the dietary patterns in the USA, Canada and Western Europe ‘are still among the worst in the world, especially of consumption of unhealthy foods’.
Other dietary convergence studies exist but have no connection to the nutrition transition literature. Blandford(Reference Blandford18), using OECD statistics on food consumption and performing simple tabular comparisons, finds that diets among OECD countries have increased in similarity. Gil et al. (Reference Gil, Gracia and Pérez19) use FBS data on several food categories consumed in European countries and find β-convergence, meaning that European countries that started with lower calories per capita grew faster in energy intake than countries that started with higher calories per capita during the sample period, suggesting convergence in diet structure (see Methods, infra). Herrmann & Röder(Reference Herrmann and Röder20) tap into the same data source as Blandford(Reference Blandford18) but use a neoclassical demand theory model. The authors find preferences to be the main drivers of convergence rather than prices and incomes as predicted by the theory. Regmi & Unnevehr(Reference Regmi and Unnevehr21) consider eighteen high-income countries and test for σ-convergence. This method compares cross-section trends in the coefficients of variation of time series and finds convergence in total expenditures, cereals and meat.
This paper aims to build on the insights of the preceding literature on the nutrition transition and reformulate some of its predictions into testable hypotheses within a unified model. Specifically, the paper tests for global dietary convergence, estimates the speed of convergence, measures how the speed is influenced by income, globalisation and urbanisation and tests whether or not global diets are converging to the Western diet. For methodology, we use the β-convergence model. For data, we tap into FBS covering the 1993–2013 period and construct a panel, which we estimate using a two-way fixed effects model.
Methods
Characterising the Western dietary pattern
A search through two major databases (Medline and Scopus) reveals that the terms Western diet, total Western diet and Western dietary pattern are often used interchangeably as a reference to a diet that is best described by the following passage:
‘High intakes of processed foods, added sugars, and refined grains coincident with comparative low intakes of fruits, vegetables, and fish. As a result, this unbalanced diet contains excess amounts of energy, simple sugars, and sodium with an insufficient supply of fiber. In addition, some essential vitamins and minerals are consumed at levels below recommendations, As a result, key nutritional factors increase risk of chronic disease, including such factors as glycemic load, fatty acid composition, macronutrient composition, micronutrient density, acid-base balance, the ratio of sodium to potassium, and the fiber content’(Reference Monsanto, Hintze and Ward22).
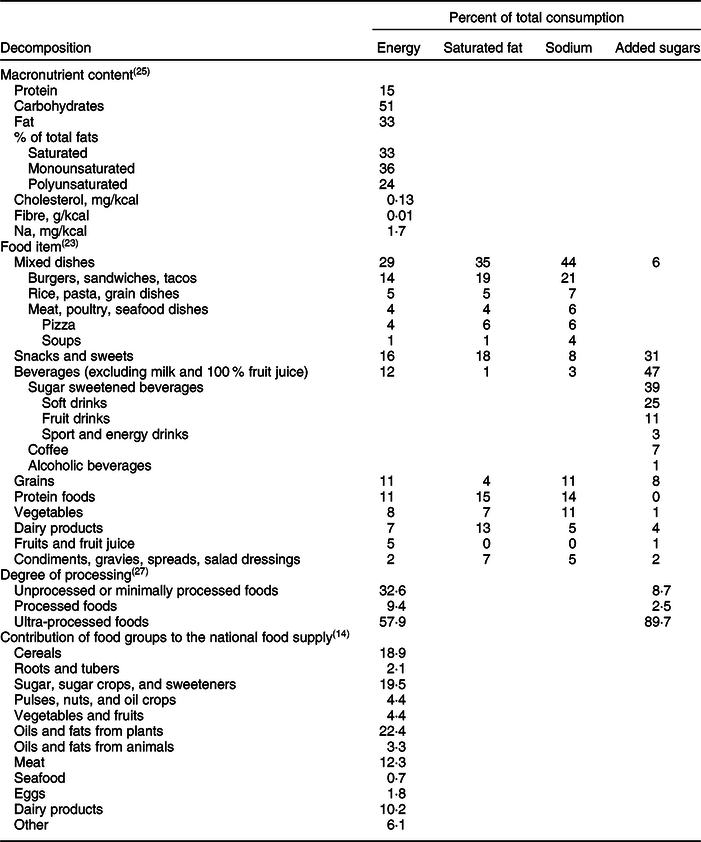
Depending on research objectives, different studies use different constituents of the Western diet based mainly on American dietary data(23–24). The research objectives broadly aim at health outcomes (body weight, type 2 diabetes, cancer, etc) or environmental outcomes (greenhouse gas emissions) of the Western diet either as a stand-alone diet or in contrast to other diets (usually Western v. the Mediterranean). Some health-related studies use randomised animal trials and decompose the diet by macronutrient content(Reference Shively, Appt and Vitolins25). Others use randomised dietary intervention where human subjects are provided with key foods or all foods(Reference Mattes, Shikany and Kaiser26). Yet others rely on self-reported food and beverage intake in household budget surveys(Reference Steele, Baraldi and da Costa Louzada27), national statistics on basic food ingredients (sweeteners and oils) and primary (unprocessed) foods reported in FBS, or both(Reference Tukker, Goldbohm and De Koning28–Reference Sheehy and Sharma33). Studies that examine the environmental consequences of the Western diet also rely largely on national statistics like FBS(Reference Vega Mejía, Ponce Reyes and Martinez34–Reference Sáez-Almendros, Obrador and Bach-Faig39).
Using American dietary data, Table 1 summarises selected decompositions of the Western diet labelled as such in the literature, their constituents and, where applicable, their respective contributions to energy intake, saturated fats, sodium and added sugars. The decompositions are by macronutrient content, by food item, by degree of processing and by contributions of good groups to the national food supply. Although different decompositions have different constituents with different levels of aggregation, there is congruence between the relatively higher contributions of sugars, oils and fats from plants, meat and eggs to the US national food supply, as reported in FBS, and the relatively higher fat and sugar contents in food items and sugar content of processed foods consumed by households.
Table 1 Alternative decompositions of the Western diet
Characterising cross-country dietary patterns
Short of nationally representative consumer-level survey data on food consumption worldwide by macronutrient, food item or degree of processing, as shown in Table 1, we follow the practice of past studies and tap into FBS to characterise cross-country dietary patterns. Of course, like any other global food consumption database, FBS has limitations(40–Reference Micha, Coates and Leclercq41). Still, it remains the only standardised, comprehensive and widely used global dietary database that is publicly available and consistent for almost every country for many years.
To characterise a country’s dietary pattern, we adopt the idea behind the Mediterranean Adequacy Index, which uses FBS data to measure a country’s adherence to the Mediterranean diet(Reference Da Silva, Bach-Faig and Quintana42,Reference Finardi, Bucchini and Turrini43) , and formulate for each country a Western Diet Similarity Index (WSI) based on the food items reported in the database. FBS database contains food available from ninety-eight food items in terms of weight (g), calories (kcal), protein (g) and fats (g) per person per day by country.
To construct comparable cross-country WSI, we first adjust the calories from each of the ninety-eight food items for waste, using the waste factors from Behrens et al. (Reference Behrens, Jessica and Kiefte-de Jong36) (see online supplementary material, Supplemental Table 1), and aggregate the items into twelve bundles: cereals (CRL); roots and tubers (TBR); sugar, sugar crops and sweeteners (SUG); pulses, nuts and oil crops (PNO); vegetables and fruits (VAF); oils and fats from animal sources (OAFA); oils and fats from plant sources (OAFP), red and white meat (MEAT); seafood (SFD); eggs (EGG); milk (MILK) and a miscellaneous category (OTHER). The list of the twelve bundles and corresponding food items are shown in Supplemental Table 2.
Next, we compute a WSI for each country expressed as the proportion of per-capita total calories from animal source foods (ASF = MEAT + OAFA + MILK + EGG), plus oils and fats from plant sources (OAFP) and sweeteners (SUG). We should note that, although oil crops in PNO may suggest overlap with OAFP, which includes oils from plant sources, the oil crops in PNO are a source of vegetable protein. In contrast, oils from plants are separated oil fats that go directly into consumption or as ingredients in other processed consumer food products(Reference Gouel and Guimbard44).
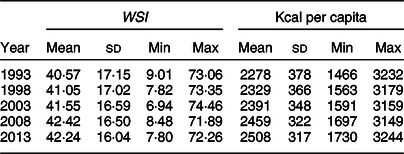
The composition of WSI draws on the nutrition transition work by Popkin & Gordon-Larsen(Reference Popkin and Gorden-Larsen9). According to the authors, food groups ASF, OAFP and SUG, which serve as significant sources of fat and/or ingredients in processed foods, constitute the three principal manifestations of the nutrition transition around the world, and, hence, the higher the index, the closer a country’s dietary pattern to a Western one. However, while calories from the FBS food groups we use to construct the index encompass the food groups highlighted by Popkin & Gordon-Larsen(Reference Popkin and Gorden-Larsen9), the food groups do not allow the sorting out of another important food item in the Western diet: refined grains(Reference Cordain, Eaton and Sebastian45). Grains, as such, are reported in FBS as calories available for consumption, not actually consumed, and in what form. Since refined grains, in combination with refined oils, refined sugars and dairy products, are used to produce processed foods like bakery goods, breakfast cereals and muffins, to mention a few, WSI captures some of the elements of the omnipresent processed foods one usually associates with the Western diet, but only partially. Table 2 displays the trends in the mean, dispersion, minimum and maximum of the FBS-based WSI and kcal per capita for 172 countries between 1993 and 2013 in 5-year intervals.
Table 2 Trends in Western Diet Similarity Index (WSI) and kcal per capita, 172 countries
β-Convergence: model specification, sample data and hypotheses
β-Convergence occurs when the growth of WSI in the lower WSI countries is faster than the growth in the high WSI countries, meaning that the dietary patterns of countries with lower WSI become more similar to (or catching up with) those of countries with higher WSI. To test for β-convergence, the following regression model is estimated(Reference Gil, Gracia and Pérez19):
 $$\left( {{1 \over T}} \right)\ln \left( {{{WS{I_{it}}} \over {WS{I_{io}}}}} \right) = \alpha + \lambda {\rm{}}lnWS{I_{io}} + {\rm{}}{\epsilon_{it}}$$
where t 0 is the initial year, t is the terminal year, T is the time interval between the initial and the terminal year and
 ${\epsilon_{it}}$
is the error term. Equation (1) says that the average logarithmic growth of WSI in country i at time t is a function of the log of the country’s initial level of WSI. For β-convergence to exist, the estimate of λ should be negative and statistically different from zero.
${\epsilon_{it}}$
is the error term. Equation (1) says that the average logarithmic growth of WSI in country i at time t is a function of the log of the country’s initial level of WSI. For β-convergence to exist, the estimate of λ should be negative and statistically different from zero.
To link β-convergence to the nutrition transition, we allow the slope λ in equation (1) to vary quadratically with per-capita income (INC), globalisation (GLOB) and urbanisation (URB). The idea behind the quadratic specification is that initially, the slope and, hence, the speed of convergence increases with income, globalisation and urbanisation and eventually decreases as countries become more affluent, more global and more urbanised. To capture the quadratic relationship, the slope is written as
 $$\lambda = {\lambda _o} + {\lambda _{11}}IN{C_t} + {\lambda _{12}}{\rm{*}}IN{C^2} + {\lambda _{21}}GLO{B_t} + {\rm{\;}}{\lambda _{22}}GLOB_t^2 + {\rm{\;}}{\lambda _{31}}UR{B_t} + {\rm{\;}}{\lambda _{32}}URB_t^2$$
A negative and statistically significant λ means that countries that started initially with lower WSI are catching up with countries with higher WSI.
Once the parameters of (1), in combination with (2), are estimated, they are used to recover three additional measures that describe the growth path of WSI:
 $\beta = \frac{{ - \ln \left( {1 + \lambda } \right)}}/{T},\;$
the speed of convergence or average growth rate of WSI per year; and the steady-state
$\beta = \frac{{ - \ln \left( {1 + \lambda } \right)}}/{T},\;$
the speed of convergence or average growth rate of WSI per year; and the steady-state
 $WS{I^*} = {e^{ - \frac{\alpha }/{\lambda }}}\;$
, i.e. the value to which WSI converges in the long run.
$WS{I^*} = {e^{ - \frac{\alpha }/{\lambda }}}\;$
, i.e. the value to which WSI converges in the long run.
For data on WSI, we use the FBS data discussed earlier and consider the 1993–2013 period. We follow the econometric approach by Islam(Reference Islam46) and construct a panel data by dividing the 20 years into 5-year time intervals to smooth over yearly spikes and troughs in the global food supply. In this set-up, each country in the sample has four data points, 1998, 2003, 2008 and 2013, resulting in four observations for the dependent and independent variables for each country. The four observations for the left-hand side variable for the ith country are specified as follows:
 $$\ln \left( {{{WS{I_{i1998}}}}\over{{WS{I_{i1993}}}}} \right),\ln \left( {{{WS{I_{i2003}}}}\over{{WS{I_{i1998}}}}} \right),\ln \left( {{{WS{I_{i2008}}}}\over {{WS{I_{i2003}}}}} \right),\ln \left( {{{WS{I_{i2013}}}}\over{{WS{I_{i2008}}}}} \right)$$
Each right-hand side variable takes its mean value during the 5-year interval, except WSIio which takes the value of the denominator of the ratio on the left-hand-side variable. Per capita income INC (in $1000), taken from the Penn World Table(47), is derived from the expenditure side real GDP at current Purchasing Power Parity. In our panel setting, this allows comparison of cross-country living standards at different points in time. Globalisation is represented by the KOF globalization index developed by the KOF Swiss Economic Institute(48). The index summarises for each country the extent of trade, financial, interpersonal, informational, cultural and political globalisation. The data source for urbanisation, the urban population as a percent of the total population, is the World Bank(49). Not all countries had complete observations on the dependent and independent variables, so those with any missing observations during any 5-year interval were excluded. Similar to Gouel & Guimbard(Reference Gouel and Guimbard44), we also excluded countries whose populations were less than one million inhabitants, as they might have ‘peculiar dietary patterns’. The final panel consists of 545 observations for 137 countries.
The first hypothesis we test is the joint significance of income, globalisation, urbanisation in explaining λ, the slope. This is represented by
 ${H_o}:\;{\lambda _{11}} = {\lambda _{12}} = {\lambda _{21}} = {\lambda _{22}} = {\lambda _{31}} = {\lambda _{32}}\,=\,0.$
If the hypothesis is rejected, it means that β-convergence is influenced by the three drivers of the nutrition transition.
${H_o}:\;{\lambda _{11}} = {\lambda _{12}} = {\lambda _{21}} = {\lambda _{22}} = {\lambda _{31}} = {\lambda _{32}}\,=\,0.$
If the hypothesis is rejected, it means that β-convergence is influenced by the three drivers of the nutrition transition.
The second hypothesis is convergence. Convergence is confirmed if the estimate of the slope
 $\lambda {({\hat \lambda} )}$
given by (2), is negative, i.e.
$\lambda {({\hat \lambda} )}$
given by (2), is negative, i.e.
 $\hat \lambda = \left( {{{\hat \lambda }_0} + {{\hat \lambda }_1}GD{P_t} + {{\hat \lambda }_{12}}*GDP_t^2 + {{\hat \lambda }_2}*GLO{B_t} + {{\hat \lambda }_{22}}*GLOB_t^2 + {{\hat \lambda }_3}UR{B_t} + {{\hat \lambda }_{33}}URB_t^2} \right) < 0$
and statistically significant from zero. If true, this in an indication that countries that started with lower WSI initially are catching up with countries that started initially with higher WSI.
$\hat \lambda = \left( {{{\hat \lambda }_0} + {{\hat \lambda }_1}GD{P_t} + {{\hat \lambda }_{12}}*GDP_t^2 + {{\hat \lambda }_2}*GLO{B_t} + {{\hat \lambda }_{22}}*GLOB_t^2 + {{\hat \lambda }_3}UR{B_t} + {{\hat \lambda }_{33}}URB_t^2} \right) < 0$
and statistically significant from zero. If true, this in an indication that countries that started with lower WSI initially are catching up with countries that started initially with higher WSI.
If convergence is confirmed, the third hypothesis is whether the global steady-state cross-country dietary pattern converges to the Western dietary pattern. This requires choosing a fixed value of WSI. A plausible value is WSI = 70 which represents the American WSI in 2013, implying that the global steady-state WSI will rest at a dietary pattern where 70 % of the calories are derived from animal sources foods, oils and fats and sweeteners. However, it turns out that the respective WSI of Iceland (72) and Switzerland (72) are slightly higher than the American WSI, and that of Australia (69) is just below it and other countries with WSI’s close by. To find out systematically which other countries’ dietary patterns are close to the American dietary pattern, we use the K-means clustering technique. In doing so, we discover fifteen countries belonging to the same cluster in which the United States appears. The cluster, which we label ‘Western diet countries’, is as follows, in descending order of WSI: Iceland (72), Switzerland (72), United States (70), Australia (69), Sweden (67), Hungary (66), France (66), Austria (66), Germany(66), Denmark (66), Czechia (65), Netherlands (65), Spain (65), Belgium (65), Finland (64) and New Zealand (64). The sixteen countries’ population-weighted average WSI is 68. Interestingly and, unsurprisingly, all countries in the cluster belong to OECD, and except for Spain, none is located in Southern Europe, a region commonly associated with the Mediterranean diet.
Results
Equation (1), in combination with (2), is estimated using a two-way fixed effects model under four alternative specifications (Table 3). The first, second and third specifications, consider the effect of each driver (income, globalisation and urbanisation) in isolation of the other two. The fourth specification considers all three drivers in tandem. Under each specification are estimates of the regression coefficients and their their standard errors (se), the speed of convergence and its se, the steady state and its 95 % confidence intervals (CI).
Table 3 Two-way fixed effects convergence model

*** Significant at the 1 % level.
** Significant at the 5 % level.
* Significant at the 10 % level.
When the three drivers are considered in isolation, all parameter estimates are statistically significant at the 1 % level. More importantly, the signs of the quadratic terms are negative, indicating that the relationship between the three drivers and the speed of convergence is concave, rather than linear. This is consistent with the findings of Dernowsiki & Popkin(Reference Drewnowski and Popkin6), who also use FBS data. The estimates of the slope,
 ${\hat \lambda},$
all evaluated at the 2013 world mean values of per capita income ($15 518), mean globalisation index (63·39) and mean urbanisation (57·32 %) are negative and statistically significant at the 1 % level in all three cases, confirming β-convergence. The estimates of the speed convergence,
${\hat \lambda},$
all evaluated at the 2013 world mean values of per capita income ($15 518), mean globalisation index (63·39) and mean urbanisation (57·32 %) are negative and statistically significant at the 1 % level in all three cases, confirming β-convergence. The estimates of the speed convergence,
 ${\vskip1pt\hat \vskip -7pt\hskip -6pt\beta} $
, are also statistically significant in all three cases and range from 5·16 to 5·39 % per year. The range of the steady-state WSI* suggests that in the long-run global dietary patterns converge to a pattern where the percent of calories from animal-sourced foods, oil and sweeteners is between 33 and 37 %. Finally, since none of the CI contains the WSI value 68 %, the weighted average of the WSI of the Western-diet countries, we reject the hypothesis that the global dietary pattern converges to the Western diet.
${\vskip1pt\hat \vskip -7pt\hskip -6pt\beta} $
, are also statistically significant in all three cases and range from 5·16 to 5·39 % per year. The range of the steady-state WSI* suggests that in the long-run global dietary patterns converge to a pattern where the percent of calories from animal-sourced foods, oil and sweeteners is between 33 and 37 %. Finally, since none of the CI contains the WSI value 68 %, the weighted average of the WSI of the Western-diet countries, we reject the hypothesis that the global dietary pattern converges to the Western diet.
When all three drivers are included in the regression, only urbanisation comes in statistically significant. This is due to collinearity between the three drivers – as one would expect the trend in any one of the three drivers to be in tandem with the other two. However, as indicated by the joint hypothesis test, the three drivers are jointly statistically significant. Combining this result with the results from the other three regressions, we can say with some confidence that income, globalisation and urbanisation are key drivers of the nutrition transition as contended by the nutrition transition literature. Again, while we do find global dietary convergence, we reject the hypothesis that the global dietary pattern converges to the Western dietary pattern.
Discussion
With overweight and obesity on the rise globally, contributing to 4 million deaths annually(50), our finding that the long-run global dietary pattern is nowhere close to the American or OECD dietary patterns seems at odds with the expectation that convergence to the Western diet is a fait accompli or, at least, the world is heading in that direction. Upon reflection, however, this would be true if obesity rates worldwide are indeed caused by convergence in diets. Whether or not that is the case is a separate empirical question not addressed in this article.
What the article addresses is that, in light of the observed changes in the WSI over the 20 years between 1993 and 2013, and the (nonlinear) speed at which those changes occurred, would all countries’ respective WSI converge to the Western dietary pattern? They do not. Perhaps the reason is that the rates of change in WSI are not uni-directional. This is shown in Fig. 1, where the top panel is a histogram of WSI growth rates of the sixteen Western-diet countries, and the bottom panel is a histogram WSI growth rates in the rest of the countries in the sample. In both panels, some countries started with low WSI in 1993 and saw them rise between then and 2013, and some countries started with high WSI in 1993 and saw them decline during the same 20-year period, with varying growth rates. The long-term global dietary pattern is the result of two opposing directions of the nutrition transition. The implication for public health nutrition is that policies to further slowdown the nutrition transition of some countries to unhealthier dietary patterns is equally as important as policies to speed up the nutrition transition in other countries to healthier dietary patterns.

Fig. 1 Western Diet Similarity Index (WSI) growth rates between 1993 and 2013
That said, the findings in this article should be interpreted with several limitations in mind. One limitation is the use of FBS data to characterise the worldwide evolution of dietary structure. Although, unlike the bulk of past studies using FBS data, we have taken pain to adjust the data for waste, the data still does not represent final consumption. Another limitation is that the food groups we used to construct the Western Dietary Similarity Index and too broad to account for the grainier aspects of the Western dietary pattern used in randomised animal trials reported in studies like Monsanto et al. (Reference Monsanto, Hintze and Ward22). More importantly, food prices are absent in the analysis. While income is undoubtedly a significant driver of the nutrition transition, without relative costs, it is not possible to know the extent to which consumers substitute one food for another. Unfortunately, historical data on relative food prices corresponding to the food categories listed in FBS are not available either.
Conclusions and implications
We find strong statistical evidence of global dietary convergence with a speed that is quadratic in income per capita, globalisation and urbanisation. However, we do not find evidence of convergence to the Western diet. The estimate of long-run equilibrium WSI is in the neighbourhood of 35 %, which is (statistically) well below 68 %.
The intuition behind the result is that the growth in the WSI is not uni-directional. It is the result of two nutrition transitions going two opposing directions. Some countries saw their respective WSI rise between 1993 and 2003. Other countries saw them decline during the same 20-year period. The implication for public health nutrition is that policies for further slowing down the nutrition transition by some countries to unhealthier dietary patterns are as equally important as policies for further speeding up the nutrition transition by other countries to healthier dietary patterns. Direct intervention to steer consumer food choices is one policy option, but it may not be tenable, particularly in countries where consumer sovereignty is pre-eminent. The less surgical alternative is to subsidise healthy foods and tax unhealthy ones at levels that alter consumer dietary choices.
Acknowledgements
Acknowledgements: The author thanks Dr. Sara Azzam, Samira Azzam, anonymous reviewers, and seminar participants at the Global Academy of Agriculture and Food Security, University of Edinburgh, United Kingdom and the Department of Economics, Swedish University of Agricultural Sciences, Uppsala, Sweden, for helpful comments and suggestions on various drafts of this paper. Financial support: There is no financial support. Conflict of interest: There is no conflict of interest. Authorship: 100 %. Ethics of human subject participation: Not applicable.
Supplementary material
For supplementary material accompanying this paper visit https://doi.org/10.1017/S136898002000350X


