


Food insecurity is the inability to provide adequate food for one or more household members due to insufficient money or other resources(Reference Coleman-Jensen, Rabbitt and Gregory1). In 2016, 12·3 % of American households (15·6 million households) were food insecure(Reference Coleman-Jensen, Rabbitt and Gregory1). Individuals in food insecure households report difficulty affording balanced meals and maintaining an adequate food supply(Reference Coleman-Jensen, Rabbitt and Gregory1). Previous research has shown that food insecure individuals are at greater risk of developing chronic diseases such as diabetes, hypertension and hyperlipidaemia(Reference Gundersen and Ziliak2,Reference Seligman, Laraia and Kushel3) . Food insecurity also interferes with management of these conditions. For instance, food insecure patients with diabetes reported poorer adherence to blood glucose monitoring, higher Hb A1C levels and more hypoglycaemia-related visits to the emergency department(Reference Seligman, Laraia and Kushel3,Reference Seligman, Davis and Schillinger4) . The relationship between food insecurity and chronic disease exists even when controlling for socioeconomic factors, like income, suggesting that food insecurity is a risk factor beyond poverty(Reference Seligman, Davis and Schillinger4).
There are a few hypotheses that may explain the link between food insecurity and chronic disease. Several studies have shown that food insecurity is associated with poor diet quality, as food insecure individuals report lower intake of fruits, vegetables and several micronutrients and have also been shown to have lower Healthy Eating Index (HEI) scores, a composite measure of diet quality(Reference Laraia5,Reference Ma, Blake and Barnes6) . Seligman et al. (Reference Seligman, Laraia and Kushel3) postulated that food insecure individuals tend to consume inexpensive, energy-dense foods and may overeat during periods of food excess in anticipation of food shortages. This idea is consistent with the thrifty gene hypothesis, which states that it is more advantageous to accumulate fat when food availability is unpredictable(Reference Seligman, Laraia and Kushel3). Additionally, food insecurity is often considered a stressful state, which can increase cortisol levels, altering metabolism and activating reward pathways, leading to a desire to consume energy-dense foods(Reference Seligman, Laraia and Kushel3,Reference Laraia5) . Given that many chronic diseases, such as diabetes and hypertension, are sensitive to diet, diet quality may be an important factor contributing to the link between food insecurity and chronic disease.
In addition to food security status, there are a number of individual and environmental factors that contribute to diet quality. Individual factors such as healthy eating identity and positive attitudes towards healthy eating are associated with increased fruit and vegetable (FV) intake(Reference Ma, Blake and Barnes6,Reference Aggarwal, Monsivais and Cook7) . Environmental factors such as perceptions of healthy food availability and, to a lesser extent, access to a supermarket are also associated with FV intake(Reference Caspi, Sorensen and Subramanian8,Reference Allcott, Diamond and Dube9) . Previous studies have shown that food security status is associated with these individual and environmental factors, with very low food secure (VLFS) households reporting poorer perceptions of their neighbourhood availability, quality and affordability of fruits and vegetables and availability of low-fat products(Reference Ma, Liese and Bell10). However, there has been no research investigating how food security status moderates the effect of individual and environmental factors on diet quality.
In this cross-sectional study, we examined how diet quality differs by food security status among a sample of adults living in areas with low access to healthy food retailers, as well as the relationship between food security status, diet quality, demographics and the following psychosocial factors: perceptions of healthy food availability, healthy eating identity and perceived control of healthy eating.
Methods
Study design and sample
This cross-sectional study is an analysis of 12-month follow-up data collected in 2016–2017 from a longitudinal natural experiment investigating the impact of changes to the food retail environment on dietary behaviours(Reference Freedman, Bell and Clark11). A food security screener was added to the data collection protocol for the 12-month follow-up allowing for the present analysis. Participants were recruited from eleven contiguous census tracts in two communities in Cleveland and Columbus, Ohio, USA. Both communities had similar demographic composition and comparable access to healthy food outlets. Nine of the eleven census tracts were designated as low-income and low healthy food access (at least 500 people or 33 % of the population living more than one mile from the nearest supermarket, supercentre or large grocery store) by the U.S. Department of Agriculture (USDA)(12).
Participants were recruited from August 2015 to July 2016 using mailings, flyers, public presentations and word-of-mouth. Screened participants were invited to complete the baseline surveys if they were (1) at least 18 years old, (2) living in a targeted census tract, (3) intending to remain in current neighbourhood for at least 12 months, (4) the primary food shopper of the household and (5) English speaking. A total of 1395 individuals were screened, of which 655 were eligible. Ineligibility was mainly due to living outside of the targeted geographic area. Of the eligible participants, 516 completed all the baseline surveys(Reference Freedman, Bell and Clark13). At 12-month follow-up, 450 participants (87·2 %) were retained. Loss to follow-up was primarily because participants could not be reached to complete surveys.
Data were collected from phone-based surveys administered by trained research assistants that took approximately 60 min to complete. Each participant completed three phone surveys in a 30-d timeframe, with all three calls involving a 24-h dietary recall. Additionally, the first call included a psychosocial survey. Participants were compensated $35 after the first and second calls and $40 after the third call. The study was reviewed and approved by the Case Western Reserve University Institutional Review Board.
Measures
Sociodemographic measures
Sociodemographic measures were based on self-reported responses to questions adapted from the Behavioral Risk Factor Surveillance System(14). Questions assessed race/ethnicity, age, sex, marital status, level of education, annual household income, employment status, receipt of Supplemental Nutrition Assistance Program (SNAP) benefits in the past 12 months, receipt of Special Supplemental Nutrition Program for Women, Infants and Children benefits in the past 12 months and receipt of other federal financial assistance such as Temporary Assistance for Needy Families, Medicaid, Disability or Supplemental Security Income in the past 12 months.
Food security status
Food security status was classified based on the USDA’s Six Item Food Security Short Form(Reference Blumberg, Bialostosky and Hamilton15). Participants were asked to answer questions based on their experiences in the last 12 months. Responses of ‘often’ or ‘sometimes’; ‘yes’; and ‘almost every month’ or ‘some months but not every month’ were coded as affirmative, and the sum of affirmative responses yielded the scale score (0–6). A score of 0 or 1 indicates food security, 2–4 indicates LFS and 5–6 indicates VLFS(Reference Blumberg, Bialostosky and Hamilton15).
Psychosocial measures
To assess how participants rated their neighbourhood food environment and their attitudes towards healthy eating, the following existing psychosocial measures were used: perceptions of healthy food availability, healthy eating identity and perceived control of healthy eating.
Perceptions of healthy food availability were assessed by asking participants to think of the area within one mile or a 20-min walk from their home and rate the following statements on a four-point Likert scale (1 = strongly disagree; 4 = strongly agree): (a) A large selection of fruits and vegetables is available in your neighbourhood, (b) the fresh fruits and vegetables in your neighbourhood are of high quality and (c) a large selection of low-fat products is available in your neighbourhood(Reference Mujahid, Diez Roux and Morenoff16,Reference Moore, Diez Roux and Brines17) . The mean of the three items was calculated to create a composite score (α = 0·83).
Healthy eating identity was assessed by asking participants to rate to the following statements on a four-point Likert scale (1 = strongly disagree; 4 = strongly agree): (a) I am a healthy eater, (b) I am someone who eats in a nutritious manner and (c) I am someone who is careful about what I eat(Reference Blake, Bell and Freedman18). The mean of the three items was calculated to create a composite score (α = 0·86)(Reference Blake, Bell and Freedman18).
Perceived control of healthy eating was assessed by asking participants to rate the following statements on a four-point Likert scale (1 = strongly disagree; 4 = strongly agree): (a) I have enough time to shop for fresh and healthy foods, (b) it is convenient for me to purchase fresh and healthy foods, (c) eating a fresh and healthy diet is affordable and (d) it is easy to eat a fresh and healthy diet(Reference Middleton and Smith19). Survey administrators described ‘fresh and healthy foods’ as fresh fruits and vegetables, fresh meats and dairy and unprocessed foods. The mean of the four items was calculated to create a composite score (α = 0·72)(Reference Middleton and Smith19).
Outcome measures
The primary outcomes of this analysis were HEI-2010 scores, daily FV intake and daily energetic intake. All outcomes were calculated based on self-reported data collected using a standardised 24-h dietary recall approach, the Nutrition Data System for Research(20). Three 24-h dietary recalls were collected from each participant; two calls occurred on weekdays and one on the weekend. All three calls occurred within a 30-d window to reduce seasonal variability within subjects(Reference Locke, Coronado and Thompson21). HEI-2010 scores are a measure of diet quality based on conformity to the 2010 Dietary Guidelines for Americans (Reference Guenther, Casavale and Reedy22,23) . Based on the three 24-h dietary recalls, an average HEI-2010 score was calculated, with higher average scores (maximum = 100) indicating increased conformity to dietary guidelines and better diet quality. Daily FV intake was calculated based on the average number of servings of fruits and vegetables, including juice, over the three dietary recalls. Daily energetic intake was determined by taking the average energies consumed per day over the three 24-h dietary recalls.
Statistical analysis
Sample characteristics were described for continuous and categorical variables using means and proportions, respectively. One-way ANOVA was used to compare HEI-2010 scores, daily FV intake and daily energetic intake with each demographic variable. Examination of bivariate relationships among all variables was performed to assess collinearity. Variables were included in the analysis whether they had a Pearson correlation coefficient ≤0·5(Reference Cohen24). Multiple linear regression models were used to identify the main effects of demographic characteristics, psychosocial variables and food security status on all three measures of diet quality, as well as the moderating effects of food security status on the predictor variables. Continuous independent variables were mean centred to reduce multicollinearity(Reference Irwin and McClelland25). For each of the three outcome variables, four models were created that contained sets of independent variables as follows: Model 1 focused on demographic characteristics including age, household size, location (Cleveland or Columbus), sex, race, education level, income status, employment status; receipt of SNAP; receipt of Women, Infants and Children; receipt of other federal financial assistance and transportation to primary food shopping store; Model 2 added psychosocial variables (perception of healthy food availability, healthy eating identity and perceived control of healthy eating) to Model 1; Model 3 added food security status to Model 2; Model 4 added the interaction terms of the predictors and food security status to test for moderating effects of food security status. Moderating effects were significant if the coefficient of the interaction term was significant at P < 0·05. All statistical analyses were performed using SPSS software (version 25.0, SPSS Inc.).
Results
Table 1 summarises characteristics of the study sample. The average age of study participants was 51 years, and the majority of the participants were female (75 %) and a racial or ethnic minority (74 %) with most identifying as African American. For 62 % of the participants, the highest educational level achieved was a high school degree or less. Eighty-four percent reported an annual income less than or equal to $30 000. Forty-three percent were employed and 27 % reported being unable to work. About two-thirds (65 %) of the study population reported receipt of SNAP, which is a greater proportion than the general population of the targeted communities. Census tract data for the targeted communities indicate that 40 % of households received SNAP benefits(26). However, our study sample had similar racial composition, educational attainment, income level and employment status compared with the general population of the targeted communities(26). Forty-six percent of participants were classified as food secure. Among 54 % of the sample with food insecurity, 38 % were classified as LFS and 16 % as VLFS. Fifty-three percent of the participants used their personal vehicle to travel to their primary food shopping store. The majority (54 %) of individuals who used their personal vehicle to travel to their primary food shopping store were food secure, whereas only 14 % were VLFS.
Table 1 Demographic characteristics of study sample (N 450)

SNAP, Supplemental Nutrition Assistance Program; WIC, Special Supplemental Nutrition Program for Women, Infants and Children; VLFS, very low food secure; LFS, low food secure; FS, food secure; HEI-2010, Healthy Eating Index-2010; FV, fruit and vegetable.
* Racial/Ethnic Minority includes participants that identify as Black or African American, American Indian or Alaska Native, Asian, Pacific Islander, Other or Mixed.
† Previously Married, Not Currently Married includes participants that reported being Divorced, Widowed or Separated.
‡ Other Financial Assistance indicates participants who reported that they or a member of their household receive federal financial assistance (not including SNAP or WIC), such as TANF, Medicaid, Disability or SSI (Medicare was not considered federal financial assistance).
§ Out of Work includes participants who reported being Out of Work, being a Homemaker or being a Student.
|| Other Modes of Transportation includes participants who reported riding in a family member or friend’s vehicle, using public transportation, taking a taxi/Uber or walking/biking to the store.
Outcome 1: Healthy Eating Index-2010
Table 2 highlights unadjusted differences in each outcome variable by demographic characteristics that were statistically significant. Participants in Columbus had higher HEI-2010 scores than participants in Cleveland, and non-Hispanic participants had higher HEI-2010 scores than Hispanic participants. HEI-2010 scores increased as level of educational attainment increased and individuals reporting an annual income greater than $40 000 had the highest HEI-2010 scores compared with individuals at every other income level. Participants who were employed or retired had higher HEI-2010 scores than participants who were out of work or unable to work. Participants who reported receipt of SNAP had lower HEI-2010 scores compared with non-SNAP participants, and food secure participants had higher HEI-2010 scores compared with VLFS and LFS participants. Participants who reported using a personal vehicle for transportation to their primary food shopping store had higher HEI-2010 scores than participants who used other modes of transportation.
Table 2 Unadjusted measures of diet quality by demographic characteristics among sample of adults living in communities with low access to healthy food retail (N 450)

HEI-2010, Healthy Eating Index-2010; FV, fruit and vegetable; SNAP, Supplemental Nutrition Assistance Program; WIC, Special Supplemental Nutrition Program for Women, Infants and Children, VLFS, very low food secure; LFS, low food secure; FS, food secure.
* Daily FV intake represents the number of servings of fruits and vegetables consumed per day.
† Racial/Ethnic Minority includes participants that identify as Black or African American, American Indian or Alaska Native, Asian, Pacific Islander, Other or Mixed.
‡ Previously Married, Not Currently Married includes participants that reported being Divorced, Widowed or Separated.
§ Other Financial Assistance indicates participants who reported that they or a member of their household receive federal financial assistance (not including SNAP or WIC), such as TANF, Medicaid, Disability or SSI (Medicare was not considered federal financial assistance).
|| Out of Work includes participants who reported being Out of Work, being a Homemaker or being a Student.
¶ Other Mode of Transportation includes participants who reported riding in a family member or friend’s vehicle, using public transportation, taking a taxi/Uber or walking/biking to the store.
After adjusting for demographic and psychosocial factors, only education level, employment status and receipt of SNAP predicted HEI-2010 scores (Table 3). High school graduates had lower HEI-2010 scores compared with participants who had some college education or more (β = –2·77, P = 0·02). Retired participants had higher HEI-2010 scores (β = 4·36, P = 0·02). Participants receiving SNAP benefits had lower HEI-2010 scores when controlling for demographic variables (β = –2·75, P = 0·02). The relationship between SNAP and HEI-2010 scores was present in all four models as psychosocial variables (β = –2·49, P = 0·04), food security status (β = –2·48, P = 0·04) and moderating effects (β = –2·69, P = 0·03) were subsequently added. Among the psychosocial variables, strong endorsement of a healthy eating identity was associated with higher HEI-2010 scores, when controlling for demographic variables (β = 1·85, P = 0·004). In the full model that included moderation effects, more positive perceptions of healthy food availability were associated with lower HEI-2010 scores (β = –1·93, P = 0·02).
Table 3 Main and moderating effects of food security status on HEI-2010 scores, adjusted for covariates among sample of adults living in communities with low access to healthy food retail (N 450)*
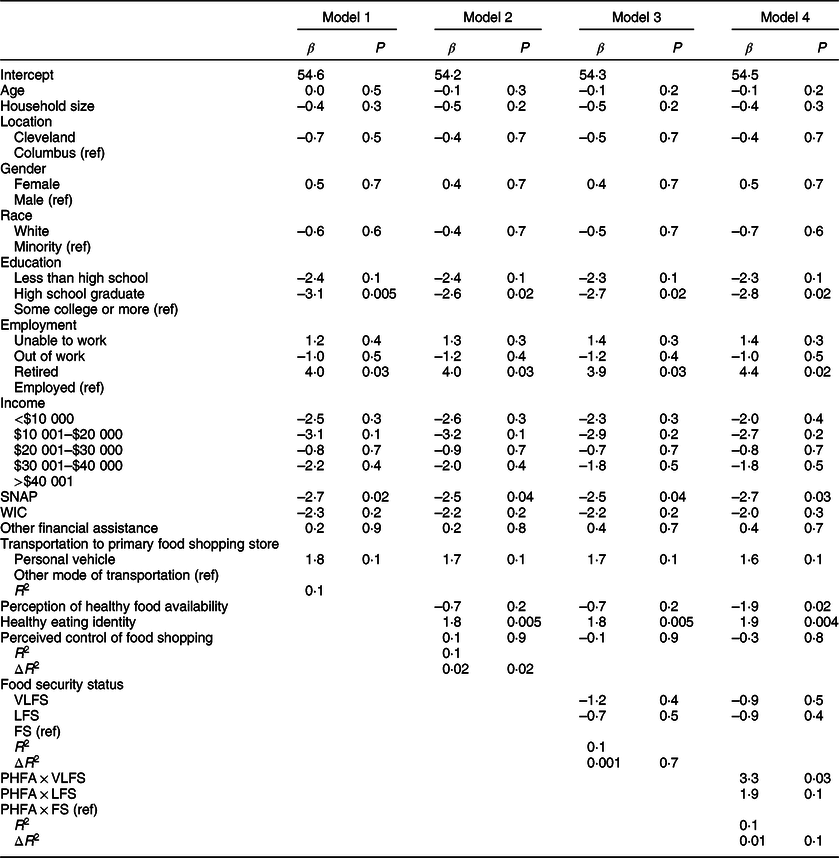
HEI-2010, Healthy Eating Index-2010; SNAP, Supplemental Nutrition Assistance Program; WIC, Special Supplemental Nutrition Program for Women, Infants and Children; VLFS, very low food secure; LFS, low food secure; FS, food secure; PHFA, perception of healthy food availability.
* Model 1 includes demographic characteristics such as age, household size, location (Cleveland or Columbus), sex, race, education level, income status, employment status, receipt of SNAP, receipt of WIC, receipt of other federal financial assistance and transportation to primary food shopping store; Model 2 adds psychosocial variables (perception of healthy food availability, healthy eating identity and perceived control of healthy eating) to Model 1; Model 3 adds food security status to Model 2; Model 4 adds the interaction terms of the predictors and food security status to Model 3.
While the moderating effect of food security status was tested for each independent variable (data not shown), the only significant effect was on the relationship between perception of healthy food availability and HEI-2010 scores. Among VLFS participants, more positive perceptions of healthy food availability were associated with higher HEI-2010 scores (β = 3·25, P = 0·03), compared with food secure participants. Among LFS participants, there was no significant effect of perception of healthy food availability on HEI-2010 scores, compared with food secure participants. As shown in Fig. 1, greater perception of healthy food availability was associated with lower HEI-2010 scores among food secure participants.

Fig. 1 Predicted values for Healthy Eating Index-2010 (HEI-2010) scores based on food security status (VLFS = very low food secure (![]() ); LFS = low food secure (
); LFS = low food secure (![]() ); FS = food secure (
); FS = food secure (![]() )) and perception of healthy food availability. Perception of healthy food availability is mean composite score of three items rated on a four-point Likert scale (1 = strongly disagree; 4 = strongly agree), with higher scores representing more favourable perceptions of healthy food availability
)) and perception of healthy food availability. Perception of healthy food availability is mean composite score of three items rated on a four-point Likert scale (1 = strongly disagree; 4 = strongly agree), with higher scores representing more favourable perceptions of healthy food availability
Outcome 2: daily FV intake
Before adjusting for covariates, there were significant differences in daily FV intake by sex, education level, income, employment and receipt of SNAP (Table 2). Male participants had higher FV intake compared with female participants. FV intake increased as educational attainment increased, and FV intake was highest among participants who reported an annual income greater than $40, 000. Participants who were employed or retired consumed more FV compared with participants out of work or unable to work. Participants reporting receipt of SNAP had lower FV intake compared with non-SNAP participants.
After adjusting for demographic and psychosocial factors, only sex, education level and employment status predicted FV intake (Table 4). Female participants had lower FV intake than male participants (β = –0·60, P = 0·04). Having a high school degree (β = –1·12, P < 0·001) or less than high school education (β = –1·05, P = 0·005) was associated with lower FV intake, while being retired was associated with higher FV intake (β = 1·10, P = 0·02). The only psychosocial predictor of daily FV intake was healthy eating identity, which was associated with higher FV intake (β = 0·51, P = 0·002). However, there was no significant moderating effect of food security status on healthy eating identity in predicting daily FV intake after it was added to Model 4 (data not shown). There were no significant moderating effects of food security status on any of the other independent variables predicting daily FV intake.
Table 4 Main and moderating effects of food security status on daily fruit and vegetable intake, adjusted for covariates among sample of adults living in communities with low access to healthy food retail (N 450)*

SNAP, Supplemental Nutrition Assistance Program; WIC, Special Supplemental Nutrition Program for Women, Infants and Children; VLFS, very low food secure; LFS, low food secure; FS, food secure; PHFA, perception of healthy food availability.
* Model 1 includes demographic characteristics such as age, household size, location (Cleveland or Columbus), sex, race, education level, income status, employment status, receipt of SNAP, receipt of WIC, receipt of other federal financial assistance and transportation to primary food shopping store; Model 2 adds psychosocial variables (perception of healthy food availability, healthy eating identity and perceived control of healthy eating) to Model 1; Model 3 adds food security status to Model 2; Model 4 adds the interaction terms of the predictors and food security status to Model 3.
Outcome 3: daily energetic intake
Before adjusting for covariates, male participants and participants not receiving certain types of federal financial assistance had higher daily energetic intake (Table 2). Additionally, employed and out of work participants consumed more energies than those who were retired or unable to work. After adjusting for demographic and psychosocial characteristics, female participants consumed fewer energies than male participants (β = –474·65, P < 0·001) (Table 5). Women, infants and children participation was associated with increased energy consumption (β = 252·74, P = 0·04). There were no significant psychosocial variables associated with daily energetic intake, and there were no significant moderating effects of food security status on any of the other independent variables in predicting daily energetic intake.
Table 5 Main and moderating effects of food security status on daily energetic intake, adjusted for covariates among sample of adults living in communities with low access to healthy food retail (N 450)*

SNAP, Supplemental Nutrition Assistance Program; WIC, Special Supplemental Nutrition Program for Women, Infants and Children; VLFS, very low food secure; LFS, low food secure; FS, food secure; PHFA, perception of healthy food availability.
* Model 1 includes demographic characteristics such as age, household size, location (Cleveland or Columbus), sex, race, education level, income status, employment status, receipt of SNAP, receipt of WIC, receipt of other federal financial assistance and transportation to primary food shopping store; Model 2 adds psychosocial variables (perception of healthy food availability, healthy eating identity and perceived control of healthy eating) to Model 1; Model 3 adds food security status to Model 2; Model 4 adds the interaction terms of the predictors and food security status to Model 3.
Discussion
In this study, we investigated relationships between food security status, other sociodemographic characteristics, psychosocial factors and three measures of diet quality with the aim of examining if food security status moderated the relationship between these variables. The rates of food insecurity in this study sample were substantially higher than national rates. The level of LFS in the study sample was more than four times higher than national rates, and the level of VLFS was about three times higher(Reference Coleman-Jensen, Rabbitt and Gregory1). We did not find any significant direct relationships between food security status and the three measures of diet quality including HEI-2010 scores, daily FV intake and daily energetic intake. This finding is not consistent with previous literature evaluating associations between food security status and diet quality. A review by Hanson and Connor showed substantial evidence that diet quality is poorer among food insecure adults than food secure adults(Reference Hanson and Connor27). Their review focused on measures of diet quality such as FV intake and dairy consumption, but other studies have shown that food insecurity is associated with poorer HEI-2010 scores(Reference Bhattacharya, Currie and Haider28,Reference Leung, Epel and Ritchie29) . These studies differ from ours in that they used a larger, nationally representative study sample that was socioeconomically diverse. In contrast, our study included a smaller sample recruited within two communities that have similar socio-demographic profiles with higher rates of poverty and less access to healthy food retailers(12). There were, however, a few other sociodemographic and psychosocial differences in diet quality among the study sample.
First, we found that individuals with a high school degree had lower HEI-2010 scores compared to individuals with some college education or more. Additionally, individuals with a high school degree or less had lower FV intake. These results are consistent with a previous study by Hiza et al. (Reference Hiza, Casavale and Guenther30) that showed adults with higher education levels had higher HEI-2010 scores and higher FV intake. They postulated that individuals with more formal education have increased nutrition knowledge and ability to translate their nutrition knowledge into better dietary practices(Reference Hiza, Casavale and Guenther30). Additionally, more formal education may lead to higher income earning opportunities, which may improve the chances that someone lives near healthier food retailers, has access to reliable transportation to support food shopping in locations farther away from home and has more financial resources available to buy healthier foods(Reference Allcott, Diamond and Dube9).
Second, our results highlight some variability in diet quality among SNAP recipients compared with participants not receiving SNAP. Notably, we did not find significant differences between these groups for daily FV consumption and daily energetic intake. However, there were statistically significant differences between SNAP and non-SNAP participants for HEI-2010 scores. Adjusting for demographics only, SNAP participants had significantly lower HEI-2010 scores compared with non-SNAP participants, which is consistent with previous studies(Reference Leung, Ding and Catalano31,Reference Cole and Fox32) . This difference was also found in each subsequent model that adjusted for psychosocial variables, food security status and the interaction between food security status and perceptions of healthy food availability, with SNAP participants experiencing worse scores. A study by Leung et al. (Reference Leung, Ding and Catalano31) postulated that SNAP benefits may not be enough to support dietary behaviours that conform to USDA guidelines for nutritious meals. Another study examining diet quality over the course of a month showed that SNAP participants had significantly lower HEI-2010 scores, with declines primarily in the FV component scores, during the last 10 d of the benefit cycle(Reference Whiteman, Chrisinger and Hillier33). This finding supports the idea that a depletion of financial resources limits the purchase of healthy foods among SNAP participants. Additionally, it has been hypothesised that SNAP participants maximise food budgets by consuming foods that are low in cost, which tend to have higher energies and less nutrients(Reference Andreyeva, Tripp and Schwartz34). Strategies to increase the value of SNAP benefits such as nutrition incentive programs have demonstrated positive benefits on dietary patterns among SNAP recipients(Reference Guthrie, Lin and Ver Ploeg35–Reference Verghese, Raber and Sharma37).
Third, among the psychosocial variables included in our models, we found a direct association between healthy eating identity with both HEI-2010 scores and FV intake. This is consistent with previous studies that demonstrated higher healthy eating identity was related to increased FV consumption(Reference Ma, Blake and Barnes6,Reference Freedman, Bell and Clark13,Reference Blake, Bell and Freedman18) . Eating identity can help explain motivators for food choice behaviours, in that when individuals adopt an identity, they seek validation by altering their behaviour to be in congruence with this identity(Reference Burke and Harrod38). Therefore, individuals with stronger identities as a healthy eater may be more likely to seek out healthier food choices. It has also been shown that individuals who report stronger identities as a healthy eater are more receptive to standard nutrition interventions(Reference Strachan and Brawley39). Given the cross-sectional nature of this study, it is not possible to determine temporal relationships between eating identity and diet quality. Thus, it may be that making healthier foods more available and affordable is a necessary first step to forming a healthy eating identity.
Finally, we found that among VLFS individuals, there was a direct relationship between perception of healthy food availability and HEI-2010 scores. Among food secure individuals, however, there was an inverse relationship. In other words, food secure participants who perceived their food environment as having low availability of healthy foods had better HEI-2010 scores. This finding may be explained by the fact that food secure participants, who were substantially more likely to use a personal vehicle to travel to their primary food shopping store, may have the means to travel outside of their community to shop for healthier food while perceiving their neighbourhood food environment as poor(Reference Freedman40). Only 14 % of the participants with VLFS used a personal vehicle for food shopping highlighting the importance of incorporating transportation access into strategies designed to promote diet quality among food insecure populations.
There are a few limitations to this research. Though we observed a significant moderation effect of food security status in predicting HEI-2010 scores, our model only explained 15 % of the variance in HEI-2010 scores. There are several important factors that were not included in the analysis that have been shown to contribute to diet quality and may explain the missing variance. These factors include objective measures of healthy food affordability, such as regional food price indexes, as well as taste preferences and change in eating patterns throughout the month(Reference Caspi, Sorensen and Subramanian8). Given the cross-sectional nature of the study, we are unable to infer causal relationships among our findings. Our study sample included a greater proportion of SNAP recipients compared with the general population of the targeted communities, which may have biased our results to the perceptions of those receiving SNAP. Additionally, there is a risk of bias in participation, risk of bias in data collection and risk of recall bias due to the use of self-reported dietary measures.
Conclusion
In this study, we examined differences in diet quality by food security status in a sample of low-income adults in two urban communities with low access to healthy food retail. While we did not find any differences in diet quality based on food security status, after adjusting for covariates, we found that individuals with higher education levels had better diet quality and SNAP recipients had poorer diet quality. We also found that healthy eating identity was associated with better diet quality. Lastly, we found that food security status moderated the relationship between perception of healthy food availability and diet quality. Our results suggest that food secure individuals have the ability to travel outside of their neighbourhood to shop for healthier food and perceived their neighbourhood food environment as poor. VLFS individuals, however, may be more constrained to the food retail choices available within their neighbourhood due to limited access to transportation. Findings offer targets for future intervention development and evaluation to promote community nutrition. These targets include strategies to improve the value of SNAP benefits, promote access to quality education, increase transportation options to healthy food retailers and develop nutrition programming to promote healthy eating identity.
Acknowledgements
Acknowledgements: We thank the study participants and the research team for their support of the overall study. Financial support: Funding was provided by a grant from the National Institute of Diabetes and Digestive and Kidney Diseases (R01DK108184). The funder had no role in the design, analysis or writing of this article. Conflict of interest: All authors declared no conflicts of interest. Authorship: D.A.F. conceptualised and designed the study and supervised data acquisition, data interpretation and writing of the manuscript; N.R.G. conducted data analysis and wrote the manuscript. Ethics of human subject participation: This study was conducted according to the guidelines laid down in the Declaration of Helsinki, and all procedures involving human subjects were approved by the Case Western Reserve University Institutional Review Board (IRB-2015-1182). Written informed consent was obtained from all subjects.


