


Obesity is considered a public health issue that prematurely affects the health of children and adolescents( 1 ). In Brazil, the prevalence of obesity among children and adolescents was 14·3 and 4·9 %, respectively, between 2008 and 2009( 2 ). In 2015, data from the National Adolescent School-based Health Survey (PeNSE) showed a 7·8 % prevalence of obesity among students aged 13–17 years( 3 ). Besides the negative impacts of obesity on growth and development( Reference Kdiet, Moodie and Richardson 4 ), it is related to other chronic non-communicable diseases such as cardiovascular and respiratory diseases, diabetes, and early mortality in adulthood( Reference Sabin and Kiess 5 ).
There are several factors involved in the aetiology of obesity, among which are individual (genetic, biological and behavioural) and environmental characteristics( Reference Davison and Birch 6 ). In the latter category emphasis is placed on the food environment, which is characterized by the availability, access and proximity to establishments that sell food for immediate consumption or consumption at home( Reference Story, Kaphingst and Robinson-O’Brien 7 ). The type and location of such establishments in the neighbourhood can affect in diverse ways the acquisition of food by families, who can buy food of either better or worse nutritional quality, thus influencing the nutritional status of children and adolescents( Reference Laska, Hearst and Forsyth 8 ).
To assess the relationship between the food environment and the presence of obesity in the population, certain types of food retailers have been considered proxies of healthy or unhealthy diet( Reference Ravensbergen, Buliung and Wilson 9 ). Recent studies show that children and adolescents who live close to specialized fruit and vegetable establishments( Reference Jennings, Welch and Jones 10 ), far from places that sell unhealthy foods( Reference Jennings, Welch and Jones 10 , Reference Carroll-Scott, Gilstad-Hayden and Rosenthal 11 ) and in areas with a higher density of supermarkets that offer more healthy foods in relation to unhealthy ones( Reference Hutchinson, Nicholas Bodor and Swalm 12 ) have lower prevalence of obesity.
Another environmental aspect related to obesity is social deprivation, a term applied to the lack of material and social resources in a community, which may explain some differences in lifestyle, especially those associated with food consumption and the health of individuals( Reference Kowaleski-Jones and Wen 13 ). Studies carried out in developed countries show that establishments that sell fresh and healthy foods are less prevalent in socio-economically deprived neighbourhoods, hence some foods are less available and/or have lower quality, which can result in monotonous food purchasing and consumption patterns among low-income families who reside in these areas( Reference Kamphuis, Giskes and de Bruijn 14 , Reference Walker, Keane and Burke 15 ).
The majority of studies that investigated family–environment interactions were carried out in developed countries whose social, cultural and environmental factors differ from the reality of Brazilian cities. Furthermore, similar studies that address these associations in Brazilian children and adolescents are scarce( Reference Cremm, Leite and Abreu 16 – Reference Correa, Rossi and Neves 19 ).
Therefore, the objective of the present study was to investigate the relationship between social deprivation and the food environment, and to evaluate if the food environment is associated with the prevalence of obesity in Brazilian public-school students.
Methods
The present study was a cross-sectional investigation among children and adolescents of both sexes, aged between 7 and 14 years, and enrolled in elementary public schools located in the urban area of the city of Juiz de Fora, a medium-sized city in the state of Minas Gerais, Brazil. The data collection of individual information occurred between July 2011 and December 2012.
The number of children and adolescents in the age group of interest enrolled in 130 public schools located in the urban area of Juiz de Fora in 2011 was 52 733( 20 ), which corresponds to 79·5 % of the total 66 295 students enrolled in elementary schools in the urban area of the city of Juiz de Fora. The remaining 20·5 % (n 13 562) were enrolled in eighty-six private schools( 20 ). The criteria for sample calculation were the following: the population of students in the age group of interest enrolled in public schools located in the urban area of Juiz de Fora (n 52 733), a desired precision level of 2 % and a significance level of 5 % with an 8 % prevalence of obesity corresponding to the mean prevalence of obesity in the age range studied( 2 ). Thus, assuming a possible loss of 20 %, the total sample was 848 students( Reference Sampaio 21 ). We evaluated 83·5 % (n 708) of the sample due to losses related to refusal to participate (non-consent of the students or parent/guardian) or absence on the data collection day (16·5 %, n 140).
Since the sample is school-based, it is only possible to evaluate refusal according to the school’s Health Vulnerability Index (HVI) because information concerning students’ residential address (that was subsequently geo-referenced) was provided during the interview.
The sample design was probabilistic and a three-stage cluster type: (i) schools, which were randomly and proportionally selected from each of the seven administrative city districts, totalling thirty-four schools; (ii) class, wherein all classes in each grade which conformed with the age range of interest were included; (iii) students, who were randomly and proportionally selected from each grade, totalling 708 students.
There were losses of 6·6 % (n 47) due to age being outside the range of interest (less than 7 years or greater than 14 years) and the impossibility to geo-reference (did not reside in the urban area, incomplete address). There were no statistically significant differences in sex and age.
With regard to the schools, the majority of them (61·8 %; n 21) were located in areas of lower vulnerability. Only 38·2 % (n 13) were in areas of greater vulnerability.
The dependent variable was the presence of obesity. The students’ anthropometric assessment consisted of weight and height measurements, followed by the calculation of BMI-for-age, with those who had BMI-for-age Z-score higher than +2 being considered obese. For the classification, the growth curves of the WHO( Reference de Onis, Onyango and Borghi 22 ) were used and were identical to the criteria proposed by the national system of nutritional surveillance( 23 ). All measurements followed the protocol proposed by the Brazilian Ministry of Health( 23 ).
The independent variables were sex, age, race/skin colour (white, brown or black), educational level of guardian (higher than/lower than or equal to 11 years of education)( 24 ), total monthly family income in Brazilian currency (Real, R$; distributed in tertiles) and number of meals per day (five or more/four or less)( Reference Carvalho and Rocha 25 ). To obtain information on the number of meals, the participants responded to the following question: ‘Check the meals normally eaten (more than four times a week)’. The participants were also asked if they routinely had breakfast (categorized according to the mean of this variable for the study population being equal to or higher than four meals per week)( Reference Silva, Candiá and Pequeno 26 ) and total daily screen time was given by the sum of the time spent daily watching television, using the computer or playing video games (less than or equal to/higher than 120 min/d)( 27 ).
To evaluate social deprivation, the HVI was used. It is a synthetic measure of socio-economic conditions and sanitation( 28 ) using information from the demographic census of 2010( 29 ). This index varies from 0 to 1: the higher its value, the higher the health vulnerability. It is classified into four categories (low, medium, high and very high risks), but for analytical purposes, it was opted to jointly analyse the urban regions classified as the lower vulnerability group (categories of low and medium risk) and higher vulnerability group (categories of high and very high risk).
For the assessment of the food environment, categories of food retailers were proposed based on the following criteria: main activity of the establishment described by the National Classification of Economic Activities (NCEA)( 30 ); the degree of food processing of the foods predominantly sold in the establishment( Reference Monteiro, Cannon and Levy 31 ); and the association of the type of establishment with healthy food consumption and/or weight gain (positive, negative or null association)( Reference Laska, Hearst and Forsyth 8 , Reference Mehta and Chang 32 – Reference Fiechtner, Sharifi and Sequist 38 ).
In this sense, the category of supermarkets and hypermarkets was analysed separately, given the lack of consensus in the literature on the real influence of supermarkets on the consumption attitudes of individuals and considering the wide range of foods available in these spaces( Reference Stanton 39 , Reference Larsen, Cook and Stone 40 ). The food retail categories adopted were as follows: (i) establishments with predominant sales of healthy foods, i.e. butcher shops, fish markets, greengrocers, dairy shops; (ii) establishments with predominant sales of unhealthy foods, i.e. candy shops, cafés, fast-food restaurants, mini markets; (iii) mixed establishments, i.e. self-service and ‘à la carte’ restaurants, bakeries, food trucks, street vendors; and (iv) supermarkets and hypermarkets.
The neighbourhood (geographical unit chosen) in the present study was defined by the urban region (UR) of the residence of the children and adolescents who participated in the study( 41 ). In Juiz de Fora, there are eighty-one UR( 29 ). UR are areas in the urban perimeter of the city of Juiz de Fora that have been delimited for the purpose of planning, research on socio-economic conditions, the development of actions related to planning the city’s growth and demarcation of the boroughs of the municipality( 41 ). This concept was used in the present study as a geographic unit of analysis. The mean land area of the UR was 320·98 km2 and the median was 92·05 km2 (minimum=10·37 km2; maximum=7294·73 km2); the mean population was 6066 inhabitants and the median was 4735 inhabitants (minimum=159; maximum=23 045)( 42 ). We used the UR as a geographic unit of analysis due to the inherent difficulties in neighbourhood delineation. However, this geographical measure is consistent with sociodemographic and health data from secondary sources( Reference Weiss, Ompad and Galea 43 ).
The food environment was evaluated by the density of each food retail category (number of establishments divided by the UR area in km2)( 29 ).
All information about the food retailers (address and main activity) was obtained from the Secretary of Finance of Minas Gerais and referring to data from NCEA 2013( 30 ). NCEA is a national standardized instrument used by the Brazilian tax administration( 30 ).
The residence of the research participants and the location of the food retailers were geo-referenced using their full address and the attribution of geographic coordinates was done (latitude and longitude). For this purpose, the software QGIS 2.8.6 was employed. These data were incorporated into the individual data of the sample participants, creating a single database.
Data descriptive analysis was performed through measures of frequency distribution, central tendency and dispersion. The association between the presence of obesity and the food environment measures, HVI and individual variables was obtained by binary logistic regression through generalized estimated equations, which considers the aggregate effect on the individual. An exchangeable structure of correlation was utilized and is recommended when the observations are grouped into some specific structure( Reference Hanley, Negassa and Edwardes 44 ). For the adjustment of the multivariate model, by virtue of the collinearity among the variables of the food environment, four distinct models were offered. The models were adjusted by the individual variables that presented P<0·05 in the univariate analysis, also by sex and HVI of residential UR. The association was estimated by OR and their respective 95 % CI. The data analysis was performed using the statistical software package Stata version 13.1. The significance level adopted in all analyses was 5 %.
The study complies with the Declaration of Helsinki. The policies and procedures were developed to guarantee data confidentiality and protection. The present study is the product of two projects, both approved by the research ethics committee of the educational institution where the research was conducted (reference numbers 09/2010 and 522.694/2014). After being informed about the research objectives, protocol and the procedures to be carried out, the legal representatives of the selected students were asked to consent to participate in writing.
Results
Of the 708 children and adolescents evaluated, 6·6 % (n 47) were excluded because their ages were outside the range of interest, they did not provide their full addresses (making geo-referencing impossible) or did not live in the urban area of the city. Thus, the study was carried out with 661 children and adolescents living in fifty-eight of the eighty-one UR of the city.
The prevalence of obese children and adolescents in the study sample was 13·9 % (n 92).
The following variables were significantly associated with the presence of obesity: age (OR=0·83; 95 CI % 0·74, 0·92) and highest tertile of total monthly family income (OR=2·12; 95 % CI 1·16, 3·87). The children and adolescents residing in UR of higher HVI were more likely to be obese (OR=1·44; 95 % CI 1·05, 1·98; Table 1). These results were obtained by unadjusted bivariate analysis.
Table 1 Distribution of the individual variables and neighbourhood Health Vulnerability Index (HVI) according to the presence of obesity among public-school students (n 661) aged 7–14 years, Juiz de Fora, Minas Gerais, Brazil, 2011–2012
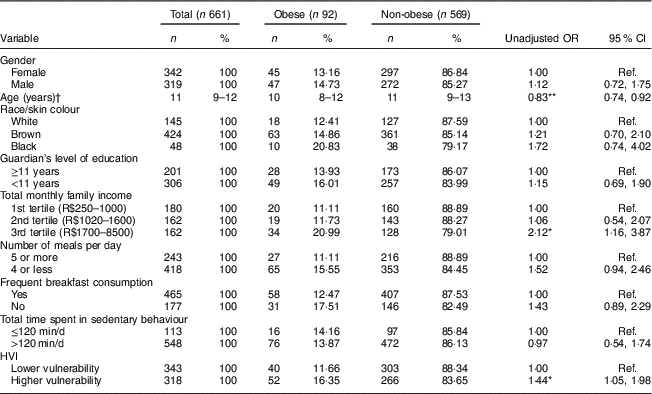
Ref., reference category.
Unadjusted OR and 95 % CI were obtained from the binary logistic regression for obesity through a generalized estimating equations model.
*P<0·05, **P<0·01.
† The age variable had a non-parametric distribution and is presented as median and interquartile range (25th percentile–75th percentile). The age variable is continuous, thus a reference category was not considered in the analysis.
In relation to the distribution of the food retail categories stratified by the UR’s HVI, 51·9 % (n 343) were in areas of lower vulnerability. In Fig. 1, the mean density of food retailers stratified by HVI is presented. The UR of higher vulnerability showed lower densities of all types of establishments when compared with those of lower vulnerability.
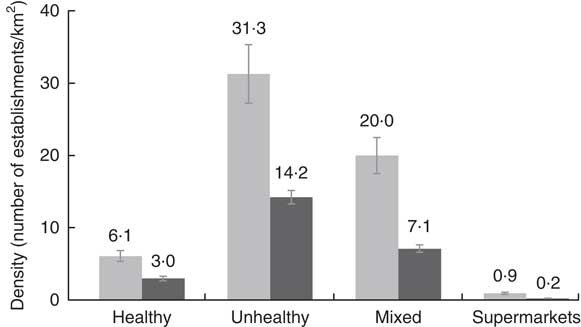
Fig. 1 Density of categories of food retailers according to urban regions’ Health Vulnerability Index (![]() , lower vulnerability;
, lower vulnerability; ![]() , higher vulnerability) in Juiz de Fora, Minas Gerais, Brazil, 2013. Values are means, with 95 % CI represented by vertical bars
, higher vulnerability) in Juiz de Fora, Minas Gerais, Brazil, 2013. Values are means, with 95 % CI represented by vertical bars
Table 2 shows that the density of healthy, unhealthy and mixed establishments was not significantly associated with the presence of obesity among children and adolescents. However, it was found that the density of supermarkets and hypermarkets had an inverse association with the presence of obesity (P<0·05).
Table 2 Density of food retailers near the students’ residence (inside the urban region where they live) according to the presence of obesity among public-school students (n 661) aged 7–14 years, Juiz de Fora, Minas Gerais, Brazil, 2013
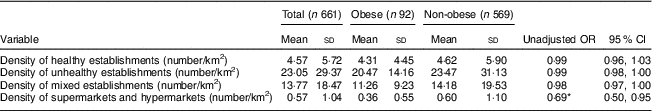
Unadjusted OR and 95 % CI were obtained from the binary logistic regression for obesity through a generalized estimating equations model.
*P<0·05.
Finally, in Table 3, the multivariate models of each type of establishment adjusted by sex, age, tertile of total monthly family income and HVI are shown. The inverse association between density of supermarkets and hypermarkets and the presence of obesity (model 4) was significant. Children and adolescents who lived in urban areas with higher densities of supermarkets and hypermarkets were less likely to be obese (OR=0·58; 95 % CI 0·36, 0·93). For the remaining food retail types (healthy, unhealthy and mixed), statistically significant differences were not observed.
Table 3 Adjusted models for obesity according to individual and food environment variables among public-school students (n 661) aged 7–14 years, Juiz de Fora, Minas Gerais, Brazil, 2013
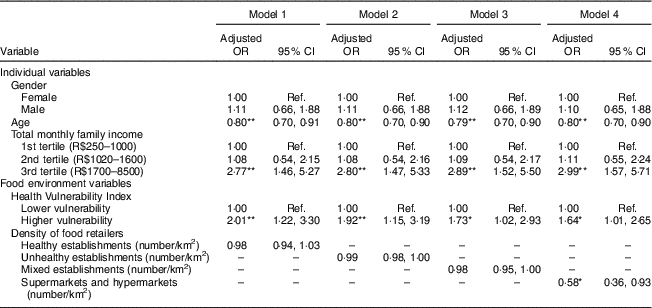
Ref., reference category.
Adjusted OR and 95 % CI were obtained from the binary logistic regression for obesity through a generalized estimating equations model.
*P<0·05, **P<0·01.
Discussion
The study findings indicate that the lowest level of social deprivation showed a higher density of all types of food retail establishments and the majority sold predominantly unhealthy foods. We observed an inverse association between the density of supermarkets in the neighbourhood and the presence of obesity in the children and adolescents evaluated, even after adjustment for individual characteristics and social deprivation in the neighbourhood. The other types of food retail establishments analysed (healthy, unhealthy and mixed) were not associated with the outcome.
The prevalence of obesity among Brazilian children and adolescents has increased steadily in recent decades and one of the factors involved in its aetiology is the food environment( 2 , Reference Davison and Birch 6 ). The availability and access to several types of food stores can encourage individuals to buy and consume foods of different nutritional qualities (healthy or unhealthy)( Reference Cobb, Appel and Franco 45 ). In addition, disregarding where people live can be a limiting factor in developing effective strategies for combating obesity at the population level, reinforcing the relevance of the present study( Reference Yancey, Kumanyika and Ponce 46 ).
In relation to the availability of food retailers according to the level of social deprivation in the neighbourhood, there is a lower density of all types of food retailers in the UR of higher vulnerability, as observed in Texas, USA, by Sharkey et al.( Reference Sharkey, Horel and Han 47 ). A similar result was also found in Glasgow, Scotland, where a higher density of food stores was found in richer areas; however, evidence of a linear relationship between the categories of establishments evaluated and the levels of social deprivation was not shown( Reference Macintyre, McKay and Cummins 48 ).
In Brazil, Cremm et al.( Reference Cremm, Leite and Abreu 16 ) investigated the relationship between socio-economic and environmental factors and overweight in 531 children under the age of 10 years in the city of Santos. The findings indicated that lower socio-economic status of the family was crucial for the presence of overweight in children. With regard to neighbourhood, the results of the current study showed an association between higher vulnerability of the neighbourhood and a higher chance of obesity among children and adolescents, both in the crude and adjusted analysis.
Correa et al.( Reference Correa, Padez and Abreu 18 ) carried out a study with students aged 7 to 14 years in the city of Florianópolis, Brazil, and verified a lower number of food retailers and a lower density of butcher shops, cafeterias, natural products stores, juice houses, convenience stores, supermarkets, bakeries and confectioneries per thousand inhabitants in low-income areas compared with high-income areas. On the contrary, a study conducted in the USA with a nationally representative sample of 73 079 adolescents (mean age of 14·65 years) observed that poorer neighbourhoods had a higher availability of establishments considered proxies of unhealthy food, such as fast-food restaurants( Reference Powell, Auld and Chaloupka 49 ).
Other studies suggest that economically deprived areas characterized by poor infrastructure and high crime rates can deter the establishment of shops and rendering of services including those directed towards a healthy diet, thus influencing the health profile of residents( Reference Walker, Keane and Burke 15 , Reference Maguire, Burgoine and Monsivais 50 ). Such environments characterized by the lower availability and limited access to fresh and healthy foods at affordable prices can be called ‘food deserts’( Reference Bridle-Fitzpatrick 51 ). Neighbourhood social deprivation can also interfere with access to health care and active mobility of individuals in urban space( Reference Walker, Keane and Burke 15 , Reference Maguire, Burgoine and Monsivais 50 ).
In relation to supermarkets and hypermarkets, an inverse association with the presence of obesity was verified among the students evaluated in the present study. According to a systematic review carried out by Cobb et al.( Reference Cobb, Appel and Franco 45 ), an identical association is found in studies performed in adults( 29 , Reference Bodor, Rice and Farley 52 , Reference Morland and Evenson 53 ). This suggests that the availability of supermarkets near one’s residence facilitates the acquisition of healthy foods (such as fruits, fresh legumes and vegetables, bread, milk and cheese) and may decrease the risk of developing obesity( Reference Cobb, Appel and Franco 45 ). However, this relationship is not entirely clear among children and adolescents.
Correa et al.( Reference Correa, Rossi and Neves 19 ) evaluated 2195 students aged 7–14 years in the city of Florianópolis, Brazil. They observed a positive association between the presence of restaurants around the homes of students (buffer=400 m) and overweight/obesity in schoolchildren (OR=1·52; 95 % CI 1·13, 2·06). Furthermore, being a member of a family that utilizes public markets/greengrocers was also positively associated with overweight/obesity in the sample investigated. They did not observe associations with the presence of supermarkets. Likewise, other studies performed in the USA employing representative national samples of students also found similar associations between the presence of supermarkets and nutritional status( Reference Powell, Auld and Chaloupka 49 , Reference Chen and Wang 54 ). On the contrary, a study performed in Kenya found that buying from supermarkets did not increase the chance of overweight among children and adolescents( Reference Kimenju, Rischke and Klasen 55 ).
Supermarkets and hypermarkets, in general, are characterized as retailers of general merchandise, predominantly food products, while also offering other types of non-perishable goods( 29 ). Brazilians consider supermarkets and hypermarkets as main places to purchase food( Reference Correa, Rossi and Neves 19 , Reference Pearson, Winter and Mcbreen 56 ). Regarding the sale of food in these places, it is possible to find various healthy foods at competitive prices and of better quality compared with other food retailers( Reference Sabin and Kiess 5 , Reference Stanton 39 ), which could increase fruit and vegetable consumption among low-income families as observed in the USA( Reference Rose and Richards 57 ).
However, it is important to note that the role of supermarkets and hypermarkets as proxies of a healthy diet has been discussed lately in the scientific literature, since these establishments not only sell fresh foods but also ultra-processed products with low nutritional quality, as shown by data from the Brazilian Family Budget Survey of 2008–2009( 2 ) analysed by Machado et al.( Reference Machado, Claro and Canella 58 ). It should therefore be emphasized that the display of different types of foods of various nutritional qualities and prices in supermarkets and hypermarkets results in ambiguous conclusions on the role of these establishments in the supply of healthy food to the population( Reference Cobb, Appel and Franco 45 , Reference Lear, Gasevic and Schuurman 59 ).
The present study has the potential to reinforce the importance of environmental determinants in the context of childhood obesity, specifically regarding neighbourhood social deprivation and the food environment. In addition, it provides useful information regarding the food environment characteristics of residential areas which are associated with the prevalence of obesity in children and adolescents enrolled in public schools in a medium-sized Brazilian city. Some limitations of the study can be observed, such as assessment of the food environment using data from secondary sources, which might be inaccurate. Regarding the criteria used for the categorization of food retail establishments, it is important to recognize the difficulty of clustering distinct food retailers who sell at different prices into a single group. In addition, rating them as healthy or unhealthy is a great challenge and may result in inaccuracies. The study evaluated public-school students only, thus the findings should not be extrapolated to all children and adolescents. However, considering that many public policies affect children in public schools, it is a crucial population to be studied. Other contexts were not evaluated, such as the environment around the schools – where the purchase of food can also occur – and recreational centres and facilities for physical activity – which can either stimulate energy expenditure or not. Finally, the use of geo-referenced information can introduce bias due to spatial changes in the establishments over time (temporal dissociation) which could not be captured, resulting in possible under- or overestimations of associations.
For future studies, it is suggested that children and adolescents enrolled in private schools be evaluated and the scope of the food environment for all students be broadened to include the built environment such as recreational centres, facilities for physical activities and public transportation system. Similarly, the built environment must be taken into consideration when analysing the associations between urban spaces and obesity.
Conclusions
The findings of the current study point to the presence of a higher density of all types of establishments that sell predominantly unhealthy foods in areas with the lowest levels of social deprivation and there is an inverse association between the highest density of supermarkets and hypermarkets and the prevalence of obesity in children and adolescents. Thus, the findings reinforce the need for public policies that promote equality in the distribution of healthy food stores in the city. Also, further investigations into the influence of supermarkets and similar establishments on the nutritional status of children and adolescents are required.
Acknowledgements
Acknowledgements: The authors thank the participating children and their families. Financial support: This work was supported by the Brazilian National Council for Scientific and Technological Development (CNPq) (grant number 484946/2013-7). CNPq had no role in the design, analysis or writing of this article. Conflict of interest: None. Authorship: M.M.A., M.A.L. and A.S.C. contributed in the design, data analysis and writing of the final version of the article; A.C.S.A. contributed in the data statistical analysis and writing of the final version of the article; M.C.P. contributed in the critical revision of the final version of the article; M.P.N. contributed in the writing and critical revision of the final version of the article; A.A.C.C. contributed to the study design and in the critical review of the final version of the article; L.L.M. contributed in the study design, writing and critical review of the final version of the article. All authors have approved the final version of the manuscript and declare that they are responsible for all aspects of the manuscript, ensuring its accuracy and integrity. Ethics of human subject participation: This study was conducted according to the guidelines laid down in the Declaration of Helsinki and all procedures involving human subjects were approved by the Ethics Committee on Human Research of the Federal University of Juiz de Fora (protocol numbers 09/2010 and 522.694/2014). Written informed consent was obtained from all subjects.


