


Dietary assessment is a fundamental component in the investigation of relationships between diet and health outcomes. Commonly utilised dietary assessment methods are FFQ, 24 h dietary recalls and food diaries (also known as diet diaries or dietary records), all of which are based on self-reported data. Each method exhibits some degree of imprecision in data collection. It has long been considered that weighed food diaries are the reference method of dietary assessment based on validation against nutrient biomarkers( Reference Bingham, Gill and Welch 1 – Reference Lanigan, Wells and Lawson 3 ) and that the accompanying portion sizes more accurately depict intake than unweighed (estimated) versions; however, more recent research has considered the benefits of using multiple dietary assessment methods to provide more accurate recording of food consumption( Reference Emmett 4 , Reference Carroll, Midthune and Subar 5 ). In addition, recent methodological developments in dietary assessment have seen techniques emerging to capture food intake via web-based programs and mobile devices( Reference Daugherty, Schap and Ettienne-Gittens 6 – Reference Vereecken, Covents and Maes 8 ), which may ease respondent burden and appeal to groups with low compliance but high technology skills.
Beyond the fieldwork, the precision of dietary intake record data entry, together with the reliability of the food composition tables used, is an important determinant of the accuracy of the final estimates of intake. There are numerous commercially available computer-based systems that provide estimated nutrient intakes from dietary data for health-care professionals, schools, caterers or individuals. Research institutes and academic centres often develop their own software or dietary assessment system tailored to their own research needs( Reference Welch, McTaggart and Mulligan 9 – Reference Wise 12 ). Whichever system is used it should be flexible and regularly updated to remain current with the food supply and the consumption patterns of the population group being investigated( Reference Conway, Robertson and Dennis 13 , Reference Stumbo 14 ).
The dietary assessment system developed by MRC Human Nutrition Research (HNR), Cambridge, UK to enter dietary intake data and estimate food consumption and nutrient intakes is an example of a database that has built-in flexibility to evolve as research requirements change. An earlier data-entry system at HNR, DIDO (Data In Diet Out), used a separate analysis program called MWIN and while reliable and feature-rich, the DIDO/MWIN system was complicated to learn, difficult to administer and was limited in the number of available food items. A replacement system was developed in 2005 called DINO (Diet In Nutrients Out), providing an integrated system for dietary data entry and nutrient analysis of food diaries and 24 h recalls which would support the dietary assessment requirements of current research and surveillance projects. Written in Microsoft® Access (Microsoft Office, 2010), DINO provides functionality for future developments and extensive content options via compatibility with SQL (structured query language) servers for data storage.
Methods
DINO background and design
DINO is divided into two platforms: the dietary data-entry interface and food composition tables, which enable both entry of the dietary assessment record and nutrient analysis for calculation of nutrient intakes. The system consists of a front end which incorporates the forms, queries and associated code modules and a back end which contains the data tables. Users have a copy of the front end on their personal computer, while the back-end database is held on a central server, thereby ensuring multiple users can access DINO simultaneously. DINO is protected by user-level security with defined security groups, allowing or denying permissions to certain areas of the system, to which users are added or removed as required. During the development of the data-entry interface, time was dedicated to the design and layout of the screens, with features built in to prompt where more detail was needed or where potential keying entry errors had been made. DINO also contains an integrated context-sensitive help system to assist with training and to offer program support.
Separate versions of the DINO system are maintained by HNR for use in specific dietary assessment projects. Each version of DINO has a similar front-end design for users but the content in the associated back-end data tables is study specific. When projects conclude the data tables can be archived to the SQL server, allowing that version of DINO to then be updated and remain contemporaneous for the next dietary assessment project. The most frequently used version at HNR is the core system using an ‘in-house’ food composition database based on UK food tables but supplemented over the years with information from manufacturers and additional nutrients needed for specific projects. The National Diet and Nutrition Survey (NDNS) rolling programme utilises an NDNS-specific version of DINO, which draws food composition data (FCD) from the UK nutrient databank( Reference Bates, Lennox and Prentice 15 ). MRC Keneba leads many nutrition programmes in the Gambia and utilises a country-specific DINO for its projects, with differences in FCD as well as differences in the coding method, based on a tare system of food additions to support a specific method for recording food intakes( Reference Dominguez-Salas, Moore and Cole 16 ). In the tare system the weight of an empty container, such as a plate, is subtracted from the laden weight of the plate holding food, to determine the weight of the food.
Dietary data entry
Each dietary intake record must contain a unique numerical identification number linking the record back to the study participant. These identification numbers are study specific and not generated by DINO; the acceptance of numerical identifiers serves as a means of enhancing data protection and anonymising dietary records. Date of birth can also be entered as an additional data check. To begin data entry the user inputs respondent gender, diary date, day of the week and meal time slot (6–9 am, 9 am–12 pm, 12–2 pm, 2–5 pm, 5–8 pm, 8–10 pm, 10 pm–6 am) of the first food entry. Checks are carried out with previously entered participant information to ensure that food records are entered under the correct identification number and any discrepancies are highlighted, enabling the participant data to be confirmed. If there are no discrepancies the data-entry screen opens automatically and the food record can be entered. The exact meal time as stated in the food diary for each food entry is entered in 24 h format and must fit within the meal time range previously selected.
The data-entry screen is shown in Fig. 1 and contains functions to assist with searching for foods, which increases accuracy and reduces data-entry time. To restrict the number of food items available in a search, the data enterer can select a food group and further refine the search by using a search string. Wildcard characters (? and *) may be used in the search string, which allows for searching of food items that may have long or difficult-to-remember descriptions. For example, ‘Potato slices, in batter, fried in blended vegetable oil’ may be searched as ‘pot*batter*fried’. All foods matching the description of the search will be displayed in a drop-down list and the most appropriate food item is selected by the user. As well as searching by description, the exact food item number can be entered directly if known. Having chosen a food item the respective portion size options are made available for selection before the next food can be entered.
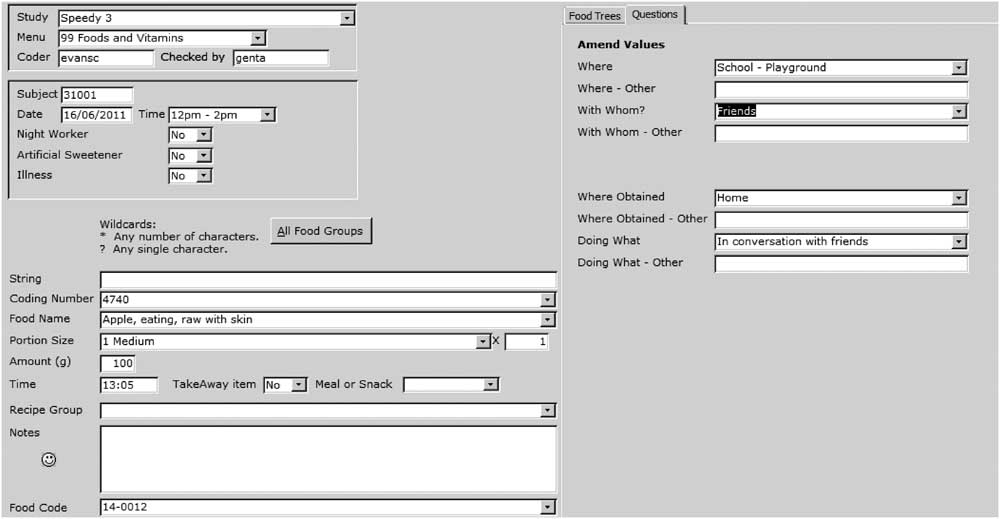
Fig. 1 Coding screen as displayed in the Diet In Nutrients Out (DINO) dietary assessment program, displaying the available coding fields for each food entry including food and portion size entries, together with eating context responses
Food codes and coding foods
DINO contains two screens depicting the food item at different levels, which are referred to as ‘food codes’ and ‘coding foods’, as demonstrated in Fig. 2(a) and (b). Food codes are listed numerically and hold the FCD as well as a full description of the food and the food groups that contain this food. Coding foods are linked separately to a specific food code and provide additional details required during the data-entry process, such as brand names and portion size data. ‘Substitute foods’ are used in DINO where there is a close, but not exact, nutritional match to an existing food item, or for newly emerging foods to assess the food’s popularity before assigning it as a unique food item. Substitute foods are added to DINO by trained nutritionists and are reviewed on a regular basis. The consumption of the substitute foods is monitored by coding frequency and new food items are created with a more precise nutritional profile if frequent consumption occurs. In cases where the information provided in the food record is insufficient, default foods are used; these are based on the food item with the greatest data-entry frequency within the food group. The default cheese, for example, is cheddar. Coding foods can be made available for all or only specific studies, which is a useful feature when projects are based on one age group only (and where consumption of some foods is unlikely) and also eliminates the chance of entering foods and portions that are not applicable to the study dates.
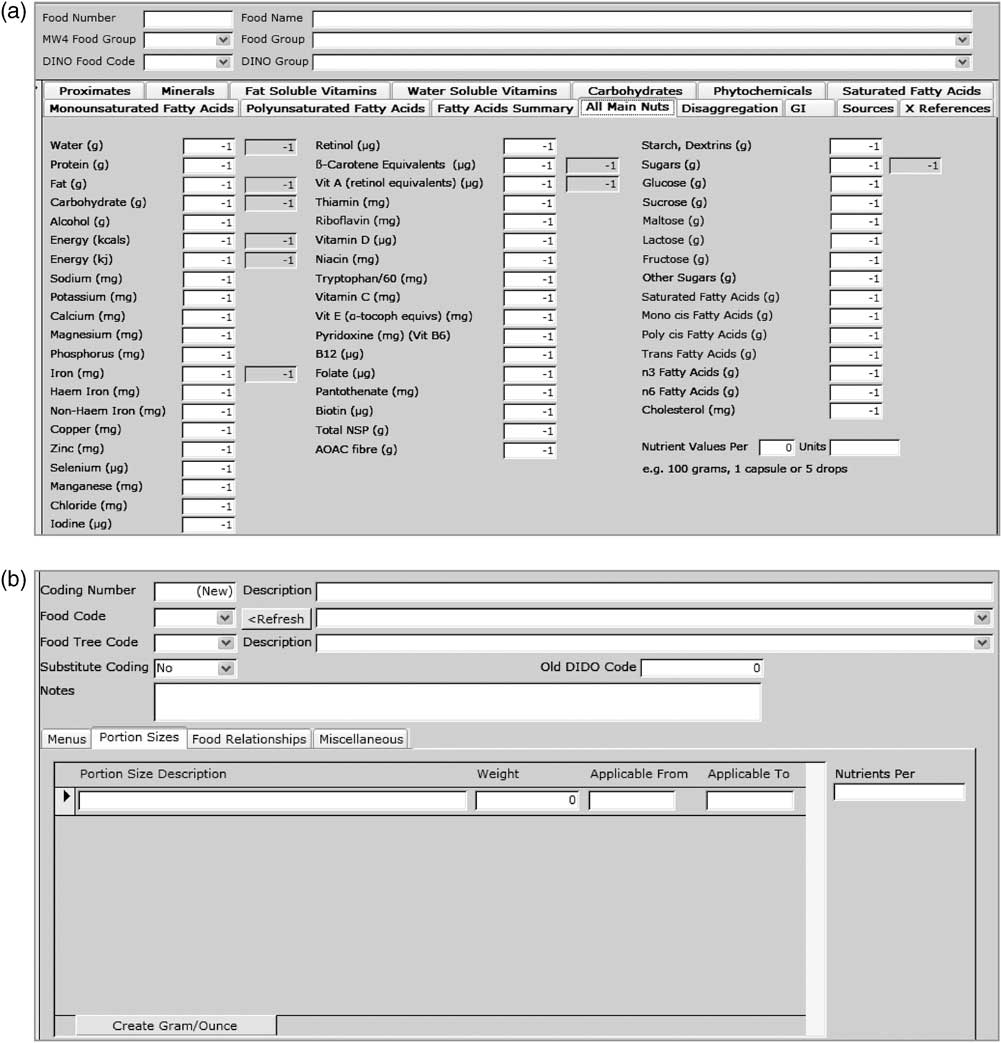
Fig. 2 (a) Blank food code screen in the Diet In Nutrients Out (DINO) dietary assessment program. The full food code description, unique food code number and appropriate food group are required. Nutrients are allocated by manual entry with fields highlighted as −1 representing missing or unknown values. Quality assurance checks for calculation errors are incorporated and shown in the shadow boxes alongside some nutrients. The sources tab enables documentation of data sources and additional notes to be made with each food code. (b) Blank coding food screen in the DINO dietary assessment program. Coding description is entered and a coding number automatically generated to prevent duplication. The corresponding food code is selected together with a food group to facilitate searching using food trees. Portion sizes are added and fields for gram and ounce are automatically entered. Portions are date specific, allowing amendments to be made during coding projects
Food group structure
Early versions of DINO used food groups adapted from the structure of McCance and Widdowson’s The Composition of Foods, fourth and fifth editions( Reference Paul and Southgate 17 , Reference Holland, Welch and Unwin 18 ); however, as new food codes have been added to DINO, these groups have been updated with a new version described as ‘DINO food groups’, which have greater specificity. All food items held in DINO have been allocated to a food group. Within DINO food groups there is a hierarchy of main and subsidiary levels, an example is shown in Table 1.
Table 1 Extract of beverage food groups held in the Diet In Nutrients Out (DINO) dietary assessment program, displaying the three-tier hierarchy structure used to categorise food codes
Food queries
If there is an item in the food record that cannot be entered because of a missing food item or portion size in DINO, it can be flagged as a ‘query’ for resolution when more details have become available or through discussion with more experienced team members. All queries are discussed by nutritionists and resolutions agreed before editing the flagged entry. A food record is complete only when all of the recorded items have been entered and there are no flagged entries remaining. Resolution of queries is logged and entered into spreadsheets separate to DINO so that all data enterers can access the manner in which a particular query was resolved, thereby maintaining consistency.
Portion sizes
Food records contain a measure of the quantity of food consumed for each entry, which is usually an estimated weight or a description using household measures, although some respondents also provide weighed records or a portion size based on weights from food packaging. DINO contains specific portion sizes for each coding food, ranging from universal weights to more precise age-related portions, standard household measures such as spoons and glasses, or unit sizes for discrete items. Each coding food contains a maximum weight portion size. Any portion that is entered above this weight will be highlighted and action taken if incorrect to reduce data-entry errors. A report can be created in DINO which lists all entries where the amount entered is greater than the maximum defined for the specific food item.
Portion sizes for adults were initially populated using the Food Standards Agency’s Food Portion Sizes (third edition)( 19 ), particularly for household measures and standard small, medium or large portions. Subsequent regular reviews have been and continue to be undertaken to add additional portion sizes, such as from the portion size project conducted in 2006 by Wrieden and Barton( Reference Wrieden and Barton 20 ) and from manufacturer’s or other information, which suggest that changes have occurred in portion sizes since the NDNS of adults in 2000/01 on which the third edition of Food Portion Sizes is based. All new or updated portion sizes are given a date to allow the data enterer to select the accurate portion for the time period of the food record. FCD and portion size measures are given in the same units; therefore FCD recorded in grams or millilitres are associated with respective portion sizes by weight or volume. Specific gravity values are used to convert portion sizes stated by participants into volume or weight as required. Specific portion sizes for children and infants have been derived from the literature, largely based on weighed dietary records( Reference Howell Davies, Suleiman and Nicholas 21 , Reference Wrieden, Longbottom and Adamson 22 ).
Food composition data
The FCD used in DINO are based on the UK food composition tables: McCance and Widdowson’s The Composition of Foods series( Reference Paul and Southgate 17 , Reference Holland, Welch and Unwin 18 , 23 ), and updated with new analytical data from the Department of Health’s rolling programme of nutrient analysis( 24 ). Revisions to the FCD are continually made to reflect the foods consumed and their respective nutrient contents at the time of dietary data collection. When estimating nutrient intakes for UK projects, the preference for FCD in DINO is always to UK analytical values; however, there are also estimated values that may be based on similar items described in published literature and other food composition tables outside the UK. Data from such sources are checked for accuracy and quality, including validity of the analytical method used, prior to incorporation in DINO. Through the use of study-specific and dated versions, dietary intake analysis in DINO is undertaken using FCD contemporaneous to the time period of the diet record. New food items and their related FCD are added to DINO on a regular basis, depending on the requirements of the individual project. Each food item contains the FCD for a core of fifty-three nutrients with additional nutrients or dietary compounds incorporated as required by studies; recently DINO was expanded to include data for added sugar, caffeine( Reference Fitt, Pell and Cole 25 ), whole grains, glycaemic index and glycaemic load (further details available from the corresponding author on request). If analytical data are not available, as is the case for added sugar and whole grains for example, DINO has the functionality to compute the FCD via an integrated ‘nutrient profile calculator’ (recipe calculator). This function enables component ingredients of existing food items and their proportions to be used to calculate or update nutrient content and to create a new food item. The methodology of the nutrient profile calculator is in line with the UK recipe calculation system as described by Reinivuo et al. in 2009( Reference Reinivuo, Bell and Ovaskainen 26 ). The majority of food items for manufactured products contain composite FCD, whereby multiple branded foods of the same description and with similar nutrient composition and ingredients are aggregated. Branded food items are available in DINO for foods which are fortified, or have specific composition, to ensure calculated nutrient intakes are as accurate as possible. The philosophy of the FCD held in DINO is to have a minimum number of food items, thereby maintaining manageability of the system and consistency of use among a large team of users, while still enabling all foods available on the market to be accounted for.
Study-specific functions of DINO
Recipes
Dietary assessment methods frequently require study participants to record homemade recipes. A recipe can be entered in DINO using the details provided by the participant for the type and amount of each ingredient and cooking method, enabling a true representation of the meal consumed. Ingredient proportions for recipes are calculated in DINO using a ‘recipe calculator function’, where water losses during cooking, weight gain to cereal products such as pasta and rice with addition of water, and edible portions for meat can be individually accounted for, providing a value for each ingredient as consumed related to the portion size stated for the meal. The method used in recipe calculation is the same as the nutrient profile calculator used to determine the FCD for new food items( Reference Reinivuo, Bell and Ovaskainen 26 ). The resulting ingredient portions are entered separately and linked to a recipe food group description, which is expressed in the nutrient analysis as foods having been consumed together as part of the same meal. The food group to which the recipe is assigned is based on food in the greatest proportion in the recipe or as determined by the type of food, as examined by Fitt et al. in 2008. For example, prawn risotto is grouped as a homemade rice dish as rice is present in the greatest proportion to other ingredients, whereas spaghetti bolognaise may contain more pasta than beef mince but it is the meat content which defines the recipe, so is linked as a homemade beef dish( Reference Fitt, Prynne and Teucher 27 ).
Eating context
If required by a study and included in the recording instrument, each food entry in DINO can be assigned a descriptor relating to eating context. The current eating context categories are: ‘who else is with the participant whilst eating’, ‘where the eating occurrence took place’, ‘whether they ate at a table’ and ‘whether the television was on or off’. These fields can be altered depending on specific study requirements. By capturing these data at the coding stage they can be examined alongside the foods consumed and subsequent nutrient intakes, which provides insight into previously unexamined eating behaviours( Reference Hetherington, Anderson and Norton 28 , Reference Mak, Prynne and Cole 29 ).
Disaggregation
DINO holds many composite food items for both purchased and homemade foods that contain two or more components. In order to provide accurate estimates of the total intake of foods consumed, both on their own and as part of mixed dishes, all composite foods have been disaggregated into a number of main food components: fruit, vegetables, meat, fish and cheese, and these are further subdivided into twenty-eight sub-categories. The composite foods were disaggregated from recipe information that matched the FCD using standard recipes from McCance and Widdowson’s The Composition of Foods series and manufacturer’s product information. Where proportion details could not be found the nutrient information was used to estimate the content of the food category; for example, vitamin A was used to estimate tomato purée content in some sauces. A full explanation of the disaggregation method is provided elsewhere( Reference Fitt, Mak and Stephen 30 ).
Data-entry history
DINO contains a history function for food items frequently consumed by the same respondent, which is particularly useful for entries such as tea and coffee that may be consumed on numerous occasions during the recording period. By placing entries in the history, the food item and portion size are saved for the next occasion for the data enterer to select automatically.
Results
Nutrient analysis
DINO can produce a variety of nutrient analysis reports, depending on user specification and the level of detail required. The primary data set holds the greatest level of detail, where all dietary data entries are provided, split by identification number, diary day and meal time, alongside the food item, food group and nutrient intakes. The secondary data set comprises an aggregate of the primary data as daily nutrient intakes. This data set can also be produced in the form of nutrient intakes by food group. The tertiary-level data sets are those for specific data requirements, where nutrient intakes can be calculated by meal, specific food groups or food item. Having flexibility within DINO shortens analysis time and enables tailored nutrient outputs, thereby minimising risk of error compared with the case if numerous separate data sets were computed and aggregated. The presentation of nutrient analysis data in DINO is subject to the round-to-half-even method, ensuring each nutrient variable is rounded systematically to the required decimals. FCD and resulting data outputs are presented to the decimal places appropriate to the nutrient variable as depicted in UK dietary reference values( 31 ). Data outputs can be presented within DINO as a new Microsoft Access form (as shown in Fig. 3) or exported to Microsoft Excel where they can subsequently be incorporated into statistical and presentation packages.
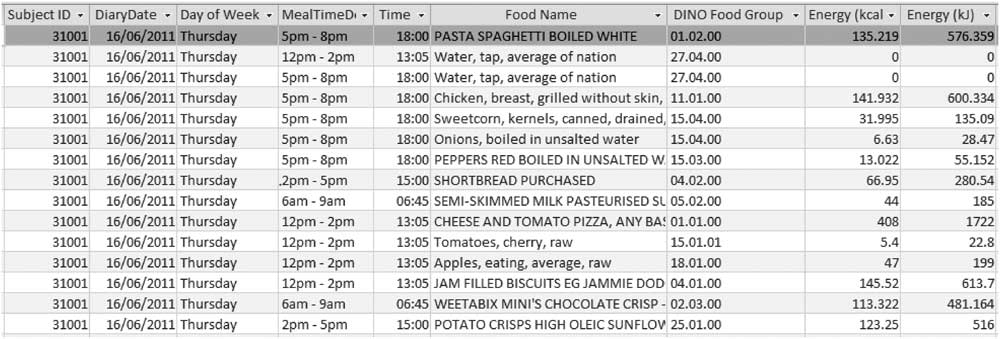
Fig. 3 An example of food and nutrient data output generated by the Diet In Nutrients Out (DINO) dietary assessment program. The variables included in each analysis can be specified by the user to produce tailored output, with nutrient data displayed by individual eating occasions or as mean daily intakes
Nutrient data quality and security
Detailed documentation is maintained by HNR regarding the sources of all FCD and portion size values that are incorporated into DINO. A comprehensive set of training documentation including standard operating procedures, user manuals and training resources has been produced for users to follow when undertaking procedures in DINO, from frequent actions such as adding new portion sizes, to more complex tasks such as generating nutrient intake data. Due to the integrated nature of DINO, entries can be instantly queried for a variety of purposes, such as number of days or number of items entered for each subject per day and identification of missing or erroneous values. Each training document is regularly reviewed and updated in order to ensure continuing data quality. DINO is protected by user-level security with defined security groups, enabling a hierarchy structure for users ranging from data-entry access and editing, to full access for nutrient analysis and redesign of the database. These permissions prevent accidental loss of data perhaps where users may not have received adequate training. DINO is a relational database utilising the concept of referential integrity to track relationships between data tables. This reduces the chance of losing data by ensuring relationships between data tables remain consistent and prevents food codes and coding foods from being deleted if they have been coded against in subject records. DINO is held on a secure server and access to related network folders is controlled by Windows permissions. Data are backed up daily, with ‘snapshots’ also recorded at regular intervals throughout the day.
Discussion
DINO is a user-friendly and adaptable system, with users taking between two and four weeks to become fully trained in entering dietary records, and is written using a database structure that provides flexibility for adding new functionality. It can be modified to accommodate the needs of various projects and has been used simultaneously for several different studies in populations ranging in age from 4 months to older adults. Currently there are over 6000 different food items in DINO, comprising single ingredient foods, generic homemade recipes, purchased brand-specific foods and purchased composite foods containing two or more brands. The number of food items DINO can hold is unlimited, ensuring unrestricted development and the expansion of nutrient fields to ensure that dietary assessment can remain contemporary with nutritional developments.
As with other dietary assessment software there are limitations, but attempts have been made to minimise these restrictions. It can be a challenge to keep up to date with product reformulations of some purchased foods, particularly in recent years during the drive to reduce trans-fat and salt intakes, as well as with the availability of new analytical FCD, which both should be incorporated into DINO in a timely manner. All FCD updates to existing food codes are permanent and retrospective, so FCD once used cannot be updated unless the study in which they have been used is archived and therefore separated from other projects. Any update mid-study might potentially introduce errors for the time period when the food code was used. To address this difficulty we are able to utilise several different versions of the same food, documented by date, in order to accurately capture the nutrient intakes at different time points in the same study. DINO is written in Microsoft Access and ad hoc queries can be written to manipulate, analyse and report data when the built-in routines are not suitable. Microsoft Access is not supported by all operating systems so the use of terminal services or a remote desktop connection may be required. DINO is a constantly evolving system, originally developed using Access 2000 and most recently updated using Access 2010, while remaining in the .mdb format. Through such software updates we can ensure the life span of DINO is maximised. To date DINO has been used primarily to code food diaries and dietary recalls. Consideration will be given to the development of DINO to accommodate additional functions to nutrient intake analysis. Interests are developing around food economics and the impacts of food costs on nutritional intakes. Also, expansion of the FCD data to include branded food information may facilitate the development of user data-entry systems and enable targeted nutritional guidance. These fields are novel in terms of dietary assessment research and, if practicable, the inclusion of such variables of price, barcodes and brand-specific food items in software such as DINO would be advantageous, potentially providing additional outputs from dietary studies.
Acknowledgements
Financial support: This work was supported by the UK Medical Research Council (grant number 5PT40). Conflict of interest: The authors have no conflict of interest to declare. Ethics statement: Ethical approval was not required. Authorship: A.M.S. instrumented the development of DINO and D.C. created the program. D.C., E.F., D.P., A.H., N.Z. and E.S. are currently involved in the use and maintenance of DINO. All authors were involved in the writing and critical review of this paper. Acknowledgements: The authors would like to acknowledge Celia Prynne and other former members of the Dietary Assessment and Population Nutrition Research teams at HNR, who were involved in the design of DINO and its implementation in numerous dietary assessment projects.


