


INTRODUCTION
The Symbol Digit Modalities Test (SDMT) has become the standard for the brief screening of cognitive impairment in multiple sclerosis (MS) (Benedict et al., Reference Benedict, DeLuca, Phillips, LaRocca, Hudson and Rudick2017). Additionally, there are four recommended cognitive screening batteries in MS that include the SDMT as one of two indicators of cognitive processing speed, with the other being the Paced Auditory Serial Addition Test (PASAT). These batteries include the Brief Repeatable Neuropsychological Battery for MS (Rao, Reference Rao1990), the Minimal Assessment of Cognitive Function in MS (MACFIMS) (Benedict et al., Reference Benedict, Fischer, Archibald, Arnett, Beatty, Bobholz and Munschauer2002), the Brief International Cognitive Assessment for MS (Benedict et al., Reference Benedict, Amato, Boringa, Brochet, Foley, Fredrikson and Langdon2012; Langdon et al., Reference Langdon, Amato, Boringa, Brochet, Foley, Fredrikson and Benedict2012), and the MS-Cog (Erlanger et al., Reference Erlanger, Kaushik, Caruso, Benedict, Foley, Wilken and DeLuca2014).
A central goal in the development of the MS Functional Composite (MSFC) was to provide a more comprehensive assessment of functional ability than the Expanded Disability Status Scale (EDSS). The EDSS has been used for decades in MS care and research as an indicator of disability that provides a common point of reference across patients and study samples. However, it primarily reflects ambulation, leaving other important aspects of disability (i.e., cognitive problems, upper motor impairments) out of the equation. The PASAT is used as the one index of cognitive functioning for the MSFC. Although the MSFC addressed some of the limitations of the EDSS and is now widely used, the continued inclusion of the PASAT as the one test of cognitive functioning has been criticized. Specifically, the PASAT is known to generate a high level of anxiety in examinees, such that using it as the only indicator of cognitive dysfunction may be misleading.
The above factors led to a reconsideration of the widespread use of the PASAT and the identification of the SDMT as a possible replacement (Brochet et al., Reference Brochet, Deloire, Bonnet, Salort-Campana, Ouallet, Petry and Dousset2008), given that it is thought to measure a similar cognitive processing speed construct as the PASAT (Erlanger et al., Reference Erlanger, Kaushik, Caruso, Benedict, Foley, Wilken and DeLuca2014) (Rao, Reference Rao1990), but elicits less anxiety (Cohen, Reingold, Polman, Wolinsky, & Sclerosis., 2012). The Multiple Sclerosis Outcome Assessments Consortium (MSOAC) subsequently conducted an exhaustive and comprehensive review of the literature on the usefulness of the PASAT versus the SDMT as a cognitive outcome measure for clinical trials in MS, and concluded that the SDMT was superior (LaRocca et al., Reference LaRocca, Hudson, Rudick, Amtmann, Balcer and Benedict2018). Other work also shows that the SDMT has excellent sensitivity in screening for cognitive impairment in MS (Van Schependoma et al., Reference Van Schependoma, D’hooghea, Cleynhensc, D’hoogec, Haelewyckb, De Keysera and Nagels2014). Finally, guidelines for substituting the SDMT for the PASAT in the MSFC are now available (Drake et al., Reference Drake, Weinstock-Guttman, Morrow, Hojnacki, Munschauer and Benedict2010).
Depending on the test, certain sensory-motor factors can represent confounds in cognitive testing. Despite its strengths relative to the PASAT as a screener for cognitive problems more generally and processing speed difficulties in particular, one potential drawback of the SDMT (like the PASAT) is that it may be sensitive to sensory-motor and other MS symptoms unrelated to cognitive processing speed that could compromise its performance. On a test like the SDMT, rudimentary visual problems (Cohen et al., Reference Cohen, Reingold, Polman and Wolinsky2012) or motor impairments, which are common in MS, could potentially interfere with task performance. As such, it may have some limitations as a pure measure of cognitive processing speed in MS such that poor performance might, in part, reflect noncognitive impairments and dysfunction, as well as processing speed.
There is some evidence that visual impairments contribute significantly to some of the variance in performance on the SDMT in MS. Bruce and colleagues (Reference Bruce, Bruce and Arnett2007) examined a group of 91 relapsing-remitting and secondary-progressive persons with multiple sclerosis (PwMS) and a group of 25 healthy controls (HCs). The SDMT (and other cognitive measures) was administered to participants, as well as the reduced Snellen eye chart at the time of testing. Results showed that the SDMT was significantly correlated (r = .37) with visual acuity, even in these individuals who were initially screened out if they had significant visual problems. Furthermore, PwMS were divided into a group of those with visual acuity worse than 20/30 or better than or equal to 20/30. After covarying age, symptom duration, and disability (EDSS), the poor visual acuity group performed significantly worse than the good visual acuity group on the SDMT. Finally, when PwMS and HC’s were compared on the SDMT, typical of most MS studies, the MS group performed significantly worse. This difference held when the visual acuity index was used as a covariate, although 13% of the group variance in SDMT performance was still due to visual acuity.
The SDMT is typically administered in an oral format to circumvent any motor writing difficulties that may interfere with performance in PwMS who often have difficulties in this realm. However, slowed oral motor speed may also compromise performance. Arnett et al. (Reference Arnett, Smith, Barwick, Benedict and Ahlstrom2008) examined the extent to which oral motor speed deficits in PwMS might be associated with performance on commonly used cognitive screening tasks like the SDMT in PwMS and HCs. Using a rudimentary oral articulation task called the maximum repetition rate (MRR) task, these investigators found that PwMS showed significantly slower articulation speed and worse SDMT performance compared with HCs after controlling for age and education. Subsequent regression analyses with SDMT score as the dependent variable showed that after controlling for age, education, and MRR speed, group differences were still significant. However, the amount of SDMT variance accounted for by MS/HC group differences was reduced from 10% to 6%.
Beyond visual and motor impairment being associated with SDMT performance and the differences observed between PwMS and HC’s, other common symptoms of MS may also be influential. Depression, anxiety, and fatigue are common in MS and have also been shown to be associated with performance on cognitive processing speed tasks. Arnett et al. (Reference Arnett, Higginson, Voss, Wright, Bender, Wurst and Tippin1999) examined SDMT (and other cognitive tests) performance in 20 depressed PwMS and 41 nondepressed PwMS. The depressed MS group performed significantly worse on the SDMT than the nondepressed MS group, illustrating the sensitivity of the SDMT to depression in MS. This study also showed that significantly more depressed PwMS had impaired scores on the SDMT compared with the nondepressed group, reinforcing this core finding.
Though fatigue is one of the most common symptoms in MS, there are a few studies showing that the SDMT is sensitive to fatigue in this patient group. One of the few studies aimed at examining this relationship was conducted by Pokryszko-Dragan and colleagues (Reference Pokryszko-Dragan, Zagrajek, Slotwinski, Bilinska, Gruszka and Podemski2016). In their study, they examined fatigue in relation to the SDMT (as well as some other cognitive variables) in 86 PwMS. The sample was divided into three fatigue groups (without, moderate, and severe), based on Fatigue Severity Scale (FSS) scores. The severe fatigue group performed significantly worse than the other two groups on the SDMT even when controlling for age and disease related variables (e.g., EDSS).
Some studies have examined anxiety in relation to SDMT performance in the MS literature. Julian and Arnett (Reference Julian and Arnett2009) found that the State-Trait Anxiety Inventory (STAI) – State Anxiety scale score negatively predicted a cognitive composite (including the SDMT and some other indices) after controlling for patient and disease characteristics, as well as depression. Another study showed that the higher scores on the Hospital Anxiety and Depression Scale – Anxiety scale were significantly associated with lower SDMT scores (Marrie et al., Reference Marrie, Patel, Figley, Kornelsen, Bolton and Graff2019). Thus, anxiety may be associated with performance on the SDMT.
Although there is some research to support the relationship between sensory-motor difficulties/affective-fatigue variables and SDMT performance, there are no published studies examining the association of all considered together. Given the central role the SDMT has taken as the preferred screening tool for cognitive impairment in MS, the present study was designed to comprehensively explore noncognitive factors that might contribute to SDMT performance. Sensory-motor factors were considered as one set of contributing variables and affective-fatigue factors (depression, fatigue, and anxiety) as another set.
Hypothesis 1a: Sensory-motor and affective-fatigue across all participants will significantly predict performance on the oral SDMT.
Hypothesis 1b: Compared with the HC group, the MS group will perform significantly worse on the sensory-motor factors (visual acuity and oral motor speed) and have higher affective-fatigue scores.
Hypothesis 2a: The MS group will perform significantly worse on the oral SDMT compared with the HC group.
Hypothesis 2b: Sensory-motor and MS affective-fatigue variables will reduce variance accounted for between the MS and HC groups on the oral SDMT.
METHOD
Participants and Procedures
MS group
The study included 51 PwMS. One individual could not be included in the analyses because data from the oral motor task (described later) were lost due to experimenter error. Thus, 50 PwMS (40 women, 10 men) were included in most analyses. Inclusionary criteria were (a) no history of alcohol/drug abuse or nervous system disorder other than MS; (b) no sensory impairments that might interfere significantly with cognitive testing; (c) no developmental history of a learning disability or ADHD; (d) no medical condition other than MS that could substantially affect cognition or motor function; (e) no relapse or corticosteroid use within four weeks of assessment; and (f) absence of severe physical/neurological impairment that would significantly impede testing.
MS diagnoses were confirmed by board-certified neurologists who also assessed disease course based on Lublin’s criteria (Lublin, Reference Lublin2014). Thompson et al.’s (Reference Thompson, Banwell, Barkhof, Carroll, Coetzee, Comi and Cohen2018) revised McDonald criteria were applied for MS diagnoses. A breakdown by course type included relapsing-remitting (n = 29), secondary progressive (n = 14), and primary progressive (n = 7). Duration of illness from symptom onset and from diagnosis, as well as a self-report measure of neurological disability (EDSS; Kurtzke, Reference Kurtzke1983), was also rated. No patient was experiencing a clinical exacerbation at the time of the evaluation. All participants were paid $100 for their participation.
Healthy control group
The HC group consisted of 51 neurologically healthy community-based individuals. One control could not be included in the analyses because data from the oral motor task (described later) were lost due to experimenter error. Another participant was not included due to missing data from the visual screen (described later). Thus, 49 HCs (41 women and 8 men) were included in the analyses. HCs were matched as closely as possible to the MS participants on demographic features (i.e., age, education, and gender). The same relevant inclusionary criteria employed with the MS group were used. HCs were recruited by asking MS participants to recommend a friend, by posting advertisements in public places in the area, and also via a university newswire. Controls were also paid $100 for their participation.
All participants in both MS and HC groups were Caucasian. Participants gave informed consent according to institutional guidelines and were treated in accordance with the ethical standards of the American Psychological Association and the Helsinki Declaration, and the study was approved by the Institutional Review Board at our institution. Participants signed an informed consent form prior to starting the study. All procedures were performed in compliance with relevant laws and institutional guidelines. See Table 1 for participant characteristics.
Table 1. Demographic and illness-related information

EDSS: Self-Report Expanded Disability Status Scale. 1 EDSS value is the median, with the range of scores in parentheses. *groups different p < .05, **groups different p < .005.
Participants completed the oral SDMT in addition to a larger battery of neuropsychological tests, the oral motor test and visual screen, and questionnaires. Demographic information (including age and education) was obtained via a psychosocial interview conducted prior to the cognitive assessment. Cognitive tasks, the oral motor tasks, visual screener, and the depression, anxiety, and fatigue measures were administered on the same day.
Measures
Education
Years of education was collected as part of a semi-structured psychosocial interview.
Premorbid IQ
Premorbid IQ was assessed using the Wechsler Test of Adult Reading (WTAR; Psychological Corporation., 2001). The WTAR is a 50-item single-word reading test that has been shown to be a reliable and valid measure of premorbid IQ. This vocabulary-based measure was considered the best index of premorbid functioning, as vocabulary skills are typically minimally affected by most neurological disease processes, including MS.
Neurological disability
The EDSS is a measure of MS disease progression and neurological impairment (Kurtzke, Reference Kurtzke1983) and a common metric of disability used across many MS studies. Participants were asked to rate their functional abilities in a number of different physical domains and then EDSS ratings were determined by a clinical neuropsychologist experienced in MS (P.A.) who calculated EDSS scores after patients reported their symptoms on a self-report measure. Scores on the EDSS range from 0 (no neurological impairment) to 10 (death from MS). Self-report instruments such as the measure we used have been shown to be have high levels of validity. For example, Solari et al. (Reference Solari, Amato, Bergamaschi, Logroscino, Citterio, Bochicchio and Filippini1993) found high (r = .84) intraclass correlations between a patient self-administered version of the EDSS and neurologists’ independent ratings.
Sensory-motor tests
Oral-motor speed
MRR of Syllables and Multisyllabic Combinations (Kent, Reference Kent and McNeil1997). The MRR is commonly used to measure oral motor speed in speech and language research and patient care. It has been recommended for use as a control for oral motor slowing deficits in MS as part of the MACFIMS (Benedict et al., Reference Benedict, Fischer, Archibald, Arnett, Beatty, Bobholz and Munschauer2002). The task requires examinees to repeat the “pa, “ta,” and “ka” syllables as quickly as possible using one good breath and assessed for 6 s. The syllables are repeated in separate trials and then a final trial requiring the repetition of “pa-ta-ka” in sequence is conducted. Data for each of the four tasks were converted to syllable/second, and a grand mean was used as the variable of interest.
Visual acuity
Reduced Snellen Near Vision Eye Chart. This chart was placed onto a stand, and a measuring tape was used to ensure that the chart was 14 inches away from the participant’s eyes. Participants were told to read the letters on the chart without moving their heads starting with the largest letter. They used both eyes and wore corrective lenses, as needed. The dependent variable was total number of correct letter identifications on the seven-line stimulus card (27 total possible).
MS affective-fatigue measures
Depression
The Beck Depression Inventory-Fast Screen (BDI-FS; Beck, Steer, & Brown, Reference Beck, Steer and Brown2000). The BDI-FS is a commonly used self-report measure of depression created for use in medical populations and is well-validated in MS (Benedict, Fishman, McClellan, Bakshi, & Weinstock-Guttman, Reference Benedict, Fishman, McClellan, Bakshi and Weinstock-Guttman2003; Strober & Arnett, Reference Strober and Arnett2015). The seven items on the BDI-FS are mostly mood and negative evaluative symptoms (e.g., sadness, past failure, and self-criticalness), avoiding the neurovegetative symptoms that are thought to overlap more with MS disease symptoms (e.g., fatigue, sexual dysfunction, etc.). Examinees rate themselves on a 0–3 scale, selecting the one statement per item that best describes the way they have been feeling over the past 2 weeks.
Fatigue
FSS (Krupp, LaRocca, Muir-Nash, & Steinberg, Reference Krupp, LaRocca, Muir-Nash and Steinberg1989). The FSS has been widely used in MS studies. Examinees are asked to rate themselves on nine items on a 1–7 Likert scale (1 = “Strongly Disagree” to 7 “Strongly Agree”). Higher scores represent greater levels of fatigue. The dependent variable was the mean score per scale item.
Anxiety
STAI (Spielberger, Reference Spielberger1983). The STAI consists of two 20-item scales, one measuring Trait anxiety, and the other measuring State anxiety. Items are rated from 1 (almost never) to 4 (almost always). The State anxiety index was used in the present study, as state anxiety was thought to be most likely to interfere with cognitive functioning on tasks like the SDMT.
Key outcome variable
SDMT (Oral Form; Smith, Reference Smith1982). The SDMT is considered a measure of cognitive processing speed, but also measures working memory (Lezak, Howieson, & Loring, Reference Lezak, Howieson and Loring2012). Only the oral trial was used, and total correct in 90 s was the dependent variable.
RESULTS
Data Analyses
The Statistical Package for Social Sciences (SPSS) version 25 was used for all data analyses.
Preliminary analyses
First, the MS and HC groups were compared using t-tests on demographic variables. As shown in Table 1, the HC group was significantly younger and more educated than the MS group. Correlational analyses among all key variables can be found in Table 2. As illustrated, the SDMT outcome was significantly correlated with age and education, so these variables were controlled for in the key hypothesis-testing analyses.
Table 2. Pearson correlations among key study variables
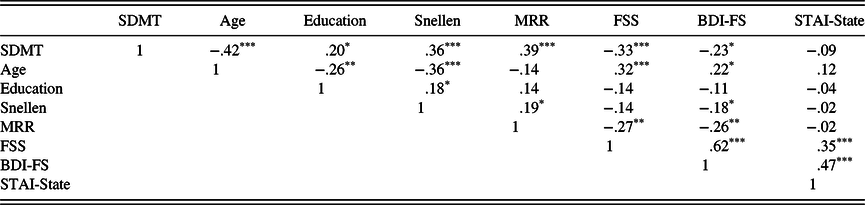
* = p < .05,
** = p < .01,
*** = p < .001. SDMT, Symbol Digit Modalities Test, Oral Trial; Snellen – Snellen Eye Chart Total; MRR, maximum repetition rate task (grand mean); FSS, Fatigue Severity Scale (mean item score); BDI-FS, BDI – Fast Screen; STAI – State-Trait Anxiety Inventory.
Hypothesis testing analyses
Hypothesis 1a: Sensory-motor and affective-fatigue across all participants will significantly predict performance on the oral SDMT. As shown in Table 2, the oral SDMT was significantly correlated with both sensory-motor variables (Snellen and MRR scores), as well as two of the three affective-fatigue variables (FSS and BDI-FS, but not the STAI-State).
Hypothesis 1b: Compared with the HC group, the MS group will perform significantly worse on the sensory-motor factors (visual acuity and oral motor speed) and have higher affective-fatigue scores. Compared with the HC group, the MS group performed significantly worse on the Reduced Snellen Chart and the MRR task. The MS group also reported significantly more depression and fatigue compared with the HC group, but the groups did not differ on state anxiety (see Table 3).
Table 3. HC and MS group differences on secondary factors and SDMT
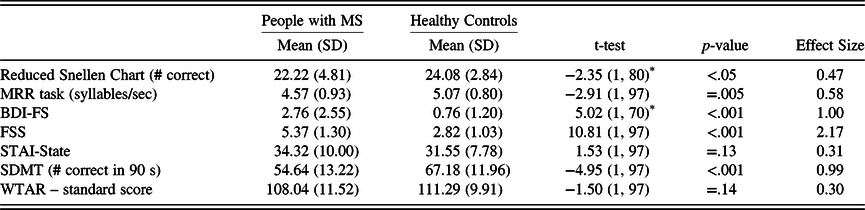
HC, healthy control; MS, multiple sclerosis; MRR, maximum repetition rate; BDI-FS, Beck Depression Inventory – Fast Screen; STAI, State-Trait Anxiety Inventory; FSS, Fatigue Severity Scale; SDMT, Symbol Digit Modalities Test, Oral Trial; WTAR, Wechsler Test of Adult Reading.
* Degrees of freedom are lower because the Levene’s Test for Equality of Variances was significant in each case, with the corresponding lower df estimate. Effect size refers to Cohen’s d.
Hypothesis 2a: The MS group will perform significantly worse on the oral SDMT compared with the HC group. Compared with the HC group, the MS group performed significantly worse on the oral SDMT (see Table 3).
Hypothesis 2b: Sensory-motor and MS affective-fatigue variables will reduce variance accounted for between the MS and HC groups on the oral SDMT.
Prior to this key hypothesis testing analyses, a linear regression analysis including only age and education at step 1 and MS/HC group at step 2 was conducted to illustrate how much variance between the groups was accounted for before considering the sensory-motor and affective-fatigue variables. As shown in Table 4a, 10% of the variance in oral SDMT performance was accounted for by the MS/HC group after controlling for age and education.
Table 4a. Regression analyses predicting symbol digit performance (a) regression demographics and MS/HC group as predictors of symbol digit performance
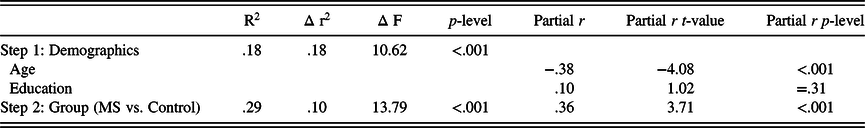
Table 4b. Regression examining all predictors of symbol digit performance
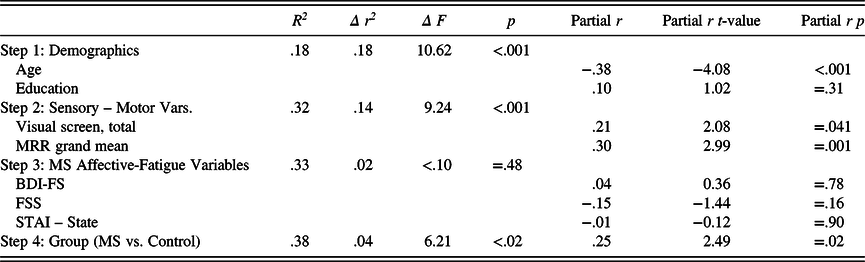
MS, multiple sclerosis; partial r, partial correlation; HC, healthy control; MRR, maximum repetition rate; BDI-FS, Beck Depression Inventory – Fast Screen; STAI, State-Trait Anxiety Inventory; FSS, Fatigue Severity Scale; Sensory – Motor Variables, Snellen Chart Scores and MRR Scores; MS Affective-Fatigue Variables, BDI-FS, FSS, and STAI – State scores.
A second linear regression analysis was next conducted to evaluate the key hypothesis for the study, specifically, that sensory-motor and affective-fatigue variables would reduce variance accounted for in the MS/HC group differences on oral SDMT. After again entering age and education at step 1, the sensory-motor variables for visual acuity and oral motor speed were entered at step 2. At step 3, the affective-fatigue variables were entered. We entered the sensory-motor variables at step 2 for conceptual reasons, as we viewed these as more rudimentary contributors to SDMT performance than the affective-fatigue variables that were entered at step 3. Finally, the MS/HC group variable was entered in at step 4 of the analysis.
As Table 4b illustrates, the sensory-motor factors accounted for 14% of oral SDMT performance after age and education were entered; however, the affective-fatigue variables entered at step 3 did not account for significant variance. Finally, when the MS/HC group variable was entered at step 4, it still accounted for a significant amount of variance in the oral SDMT (p < .05); however, the variance accounted for was 4%, contrasted with the 10% of the variance explained without the sensory-motor and affective-fatigue variables considered.
Follow-up analyses
To further evaluate the extent to which the sensory-motor factors were associated with oral SDMT performance in the MS group and to underscore the clinical significance of these findings, follow-up analyses were conducted. Two MS groups were created: One “intact sensory-motor” group and a “below average sensory-motor” group. The latter was composed of all PwMS in the sample who scored a half standard deviation or more below HC’s on both the Snellen (≤22.66) and MRR (≤4.67) (n = 14). The “intact sensory-motor” group included those PwMS who scored above a half standard deviation below HCs on both the Snellen and MRR scores (n = 14). These groups were then compared on the oral SDMT. The remaining 22 participants were excluded from these analyses.
As shown in Table 5, the groups did not differ significantly on any of the illness or demographic variables but did differ on WTAR IQ estimate. Given this, the latter was included as a covariate in an analysis of covariance (ANCOVA). This analysis showed that the below average sensory-motor group had significantly lower scores on the oral SDMT compared with the intact sensory-motor group, F(1,25) = 4.55, p < .05. Also of note, the scores of the intact sensory-motor group were almost identical to the HCs on the Snellen chart and the MRR (compare with Table 3). The mean-corrected (for WTAR IQ estimate) oral SDMT score of the intact sensory-motor group was about two-thirds of a standard deviation (.68 SDs) below the HC group, whereas the score of the below average sensory-motor group was nearly 1.5 standard deviations (1.47 SDs) lower.
Table 5. Intact and below average sensory-motor MS group differences on the SDMT and demographics
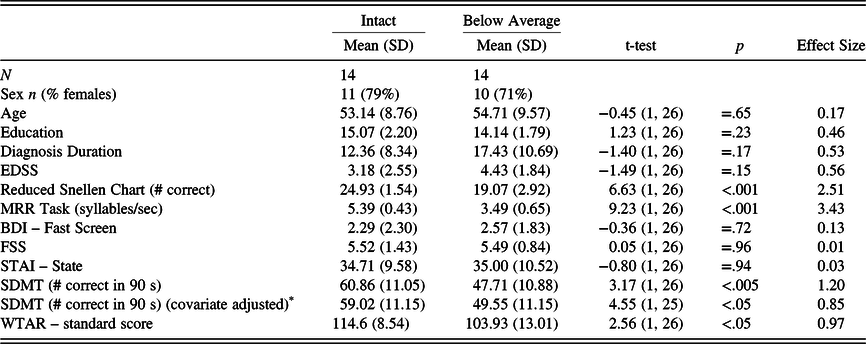
MS, multiple sclerosis; EDSS, Expanded Disability Status Scale; BDI-FS, Beck Depression Inventory – Fast Screen; FSS, Fatigue Severity Scale; STAI, State-Trait Anxiety Inventory; MRR, maximum repetition rate; SDMT, Symbol Digit Modalities Test, Oral Trial; WTAR, Wechsler Test of Adult Reading.
* Values reflect WTAR IQ covariate-adjusted means, and value in “t-value” column is an F-value from the analysis of covariance (ANCOVA).
Finally, the intact sensory-motor and the below average sensory-motor MS groups were compared on the proportion of impaired scores they had on the oral SDMT. To determine impaired scores on the oral SDMT, the latter were converted to standard scores based on the HC sample from this study. Scores below a standard score of 80 (10th percentile) using this metric were considered impaired. As shown in Figure 1, compared with the intact sensory-motor MS group, significantly more participants in the below-average group were impaired on the oral SDMT (71% vs. 14%), X2 (1, N = 28) = 9.33, p = .006 (Fisher’s Exact Test).
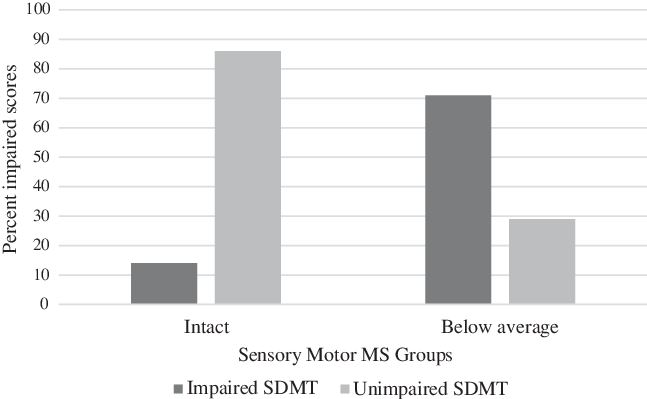
Fig. 1. Percentage of Impaired SDMT Scores in Intact Versus Below-Average Sensory-Motor MS Groups1.
1 n = 14 for both the Intact and the Below-Average Sensory-Motor MS Groups. SDMT = Symbol Digit Modalities Test – Oral Trial; Intact MS = above one-half SD below the mean of healthy controls (HCs) on both the Snellen chart and maximum repetition rate (MRR); Below average MS: A half standard deviation or more below HCs on both the Snellen and MRR scores. X2 (1, N = 28) = 9.33, p = .006 (Fisher’s Exact Test).
DISCUSSION
The present study was designed to examine the contribution of noncognitive factors to performance on the oral SDMT in PwMS. Although past work has typically examined sensory-motor and affective-fatigue variables in isolation, our study examined all within one sample. Generally consistent with hypotheses, we found that both sensory-motor variables (visual acuity and oral motor speed) and two of the three affective-fatigue variables (fatigue and depression, but not state anxiety) were correlated with oral SDMT performance. Also, generally consistent with predictions, we found that, compared with the HC group, our MS group performed worse on both sensory-motor variables and two of the three affective-fatigue variables (with state anxiety again being the lone exception). Additionally, in line with our hypotheses and many prior MS studies, the HC group performed significantly better on the oral SDMT compared with the MS group.
Regarding the central hypothesis of the study, we found partial support. In particular, we found that the sensory-motor variables substantially reduced the variance accounted for in group differences between the MS and HC groups on the oral SDMT from 10% to 4%. Because sensory-motor variables proved to be the most important factors predicting oral SDMT performance, we examined a subset of PwMS who had intact sensory-motor abilities and compared them with a group with below average sensory-motor skills. This analysis brought the findings into sharp relief. PwMS with below average sensory-motor abilities had mean oral SDMT scores that were significantly lower than PwMS who had intact sensory-motor skills. Also, the below average group had mean oral SDMT scores that were nearly 1.5 standard deviations below the mean of HCs. Finally, 71% of the below-average group was impaired on the oral SDMT compared with only 14% of the intact group.
Our findings clearly show that PwMS who have combined rudimentary visual acuity and oral motor speed problems perform worse on the SDMT than those PwMS who do not have such difficulties. These findings could not be attributed to the somewhat higher premorbid IQ of the intact sensory-motor group, as the differences held when premorbid IQ was controlled for in the analyses.
Our findings have significant clinical implications. In particular, when the oral SDMT is used as the sole screening tool for cognitive impairment in MS or used as the only measure of cognitive processing speed, clinicians and investigators should be aware that limitations in visual acuity and rudimentary oral motor speed are important factors associated with performance on this commonly used task. As such, it is important that visual acuity and rudimentary oral motor speed be routinely screened in both clinical work and research to clarify what is being measured by the oral SDMT when it is given to PwMS. Using the metric we spell out above of a half standard deviation or below HC’s on both the Snellen and MRR task (values equivalent to 22.66 and 4.67, respectively), it could be fairly straightforward to identify PwMS who may be likely to show impaired oral SDMT scores associated with visual acuity and rudimentary oral motor impairments. In our study, almost three-fourths (71%) of PwMS with at least mild sensory-motor difficulties ended up being impaired on the oral SDMT. When PwMS with impaired SDMT scores also have some of these sensory-motor limitations, other neurocognitive tests could be brought to bear before concluding that any particular PwMS had cognitive impairments that actually went beyond these noncognitive factors.
With all of this said, another important take home message from this study is that even when sensory-motor and affective-fatigue variables are taken into account, the oral SDMT still accounts for significant variance between MS and HC groups. This suggests that the oral SDMT is robust as a screening tool for cognitive difficulties in MS even when taking sensory-motor and affective-fatigue variables into account. However, by considering the association of sensory-motor factors with performance on this important screening task, clinicians and researchers can be more precise in characterizing the nature of oral SDMT difficulties in any given individual with MS. When a patient does not have sensory-motor difficulties but still performs poorly on the oral SDMT, then the latter is more likely to be reflective of true cognitive difficulties. However, when patients do poorly on the oral SDMT in the context of also having some sensory-motor difficulties, then the task may be less reflective of cognitive impairment (though still reflecting this to some degree).
Interestingly, once the sensory-motor variables were entered into the analysis, the affective-fatigue variables did not significantly predict MS/HC group differences. Still, both fatigue and depression were significantly associated with oral SDMT performance when sensory-motor factors were not taken into account first. This suggests that these affective-fatigue variables are still important in oral SDMT performance, but might be accounted for by sensory-motor limitations that may go along with both depression and fatigue.
Our study was not without limitations. First, although our results did show a reduction in MS/HC group variance accounted for when sensory-motor factors were considered first, our cross-sectional design precluded making clear temporal causal statements. Second, our sample size was relatively small, especially for our follow-up exploratory analyses. Finally, our sample was homogeneous in terms of ethnicity. Future work could address these limitations to explore the generalizability of our findings.
Though speculative and with the understanding that our data preclude clear causal conclusions, an important final consideration of these issues concerns the relative meaning of how affective-fatigue factors and sensory-motor factors might impact performance on the oral SDMT. Affective-fatigue factors could presumably lead to genuinely slower cognitive processing speed in PwMS because individuals with affective-fatigue problems do actually think more slowly than those without. In contrast, PwMS with sensory-motor problems presumably perform worse because they cannot see the SDMT stimuli adequately and cannot speak quickly. Thus, in the case of PwMS who have affective-fatigue problems, their oral SDMT score is an accurate reflection of their cognitive processing abilities, whereas for PwMS who have sensory-motor problems, the oral SDMT is not an accurate measure of their true cognitive processing speed because they cannot see the stimuli adequately or speak quickly enough.
In summary, we found that the sensory-motor variables of rudimentary oral motor speed and visual acuity accounted for substantial variance in the difference in oral SDMT performance between PwMS and HCs. Affective-fatigue factors also predicted oral SDMT performance, but their contribution to group differences between PwMS and HCs was negligible after accounting for sensory-motor differences. Although our findings suggest caution when interpreting performance on the oral SDMT in PwMS, especially when sensory-motor limitations are present, we conclude that the oral SDMT is still a reasonably good screening tool for cognitive impairment in MS. Future work could explore how well the SDMT can predict cognitive performance as a whole (i.e., on a more extensive neuropsychological battery) when oral motor and visual acuity are taken into consideration. That is, does the SDMT remain a sentinel test for cognitive impairment in this case? Future work could also explore other variables that may account for the oral SDMT – sensory-motor relationship, such as underlying measures of brain integrity between PwMS and HCs. Sensory-motor problems in MS may be a proxy for reduced brain integrity. Alternatively, sensory-motor factors could still account for oral SDMT performance regardless of brain integrity status.
ACKNOWLEDGMENTS
The authors thank the many neurologists in the Pennsylvania region who contributed their time to verifying MS diagnoses and ratings and of course, for the MS participants in the project. The authors also thank Megan Smith, Fiona Barwick, Joseph Beeney, and Andrae Laws for their help with various aspects of the study.
FINANCIAL SUPPORT
This investigation was supported (in part) by a grant to the first author from the National Multiple Sclerosis Society (PP0978).
CONFLICTS OF INTEREST
Ms. Guty, Ms. Riegler, Dr. Cadden, Dr. Roman, and Mr. Thomas do not have any conflicts of interest to report. Dr. Arnett has served as part of a paid speaker series sponsored by EMD Serono. He has also served as a consultant for Biogen IDEC and Roche Pharmaceuticals.


 Open access