


How does one develop a research design based on process-tracing? This question highlights a major challenge in teaching and adopting process-tracing methods. Although there is an expanding body of work on the approach (Beach and Pedersen Reference Beach and Pedersen2013; Bennett and Checkel Reference Bennett, Checkel, Bennett and Checkel2015; Humphreys and Jacobs Reference Humphreys and Jacobs2015; Mahoney Reference Mahoney2012; Rohlfing Reference Rohlfing2014), we are still faced with Collier’s (2011, 823) lamentation: “Too often this tool is neither well understood nor rigorously applied” (see also Blatter and Blume Reference Blatter and Blume2008, 318; Zaks Reference Zaks2017). One central concern is that there are few instructional materials in the qualitative-methods canon (Elman, Kapiszewski, and Kirilova Reference Elman, Kapiszewski and Kirilova2015; Kapiszewski, MacLean, and Read Reference Kapiszewski, MacLean and Read2014). This article provides a short, practical guide for developing a process-tracing research design. The corresponding online appendix applies this guide to four examples, thereby offering a tool for researchers seeking to employ and instructors planning to teach this method.
The material is organized in the form of a checklist that provides introductory guideposts to help researchers structure their research designs. This article is not a comprehensive literature review (Kay and Baker Reference Kay and Baker2015), and neither is it the final word on what constitutes good process-tracing (Waldner Reference Waldner, Bennett and Checkel2015). There remains much work to be done in defining, delineating, and developing process-tracing methods, and we advise graduate students and advanced researchers to become familiar with these debates (Beach and Pedersen Reference Beach and Pedersen2013; Bennett and Checkel Reference Bennett, Checkel, Bennett and Checkel2015). Instead, our contribution is to make process-tracing accessible and more readily applicable to beginners without being distracted by ongoing methodological discussions.
The discussion is limited to one type of process-tracing: theory testing (Beach and Pedersen Reference Beach and Pedersen2013). Specifically, we focus on the systematic study of the link between an outcome of interest and an explanation based on the rigorous assessing and weighting of evidence for and against causal inference. By defining process-tracing in these terms, we emphasize the role of theory and the empirical testing of hypotheses. The challenge is to assemble a research design equipped to do so.
THE CHECKLIST
To craft a research design based on process-tracing, we suggest that researchers must (1) define their theoretical expectations, (2) give direction to their research, and (3) identify the types of data necessary for testing a theory. Stated differently, the steps outlined in figure 1 set the stage for implementing best practices (Bennett and Checkel Reference Bennett, Checkel, Bennett and Checkel2015). In the online appendix provided to assist with teaching, we show how this checklist can be applied in four different examples: the rise of the Japanese developmental state; the electoral success of the Thai Rak Thai party in Thailand; the standardization of English in Singapore; and the bureaucratic reforms of the Philippines irrigation agency. We recommend that instructors start with the checklist before having students read the appendix; these materials should be paired with Collier (Reference Collier2011). Alternatively, instructors can present both the checklist and the appendix simultaneously and then assign students to use the checklist to evaluate a separate article based on process-tracing methods (e.g., Fairfield Reference Fairfield2013 and Tannenwald Reference Tannenwald1999). The goal is to ingrain in students’ minds what process-tracing is and how it can be used. In the following discussion, we reference the example of Slater and Wong’s (Reference Slater and Wong2013) process-tracing analysis of why strong authoritarian parties sometimes embrace democratization.
Figure 1 Process-Tracing: The Checklist
Step 1: Identify Hypotheses
We adopt the maxim “Theory saves us all.” Research designs and empirical analyses for causal analysis should be theoretically guided. Therefore, establishing testable hypotheses based on our theories is the first step in good process-tracing. In this sense, building a research design for process-tracing is the same as in any other attempt at causal inference. There is, however, one important distinction. In process-tracing, we are concerned not only with our theory of interest; we also must juxtapose rival explanations that we intend to test (Hall Reference Hall2013; Rohlfing Reference Rohlfing2014; Zaks Reference Zaks2017). It is important that the concerned hypothesis is evaluated against alternative(s) in a Lakatosian sense, creating a “three-cornered fight” that pits our observations against both our primary theory and at least one alternative (Lakatos Reference Lakatos, Lakatos and Musgrave1970).
The checklist is structured to allow for the testing of multiple—that is, as many as required—rival hypotheses. In an oft-used comparison, detectives in criminal cases begin their investigation by focusing on those closest to the victim and then eliminating suspects (i.e., hypotheses) along the way. Social scientists should act similarly, remembering Ockham’s razor: seek first hypotheses that are clearly related to the outcome, simple, and testable before employing more complex explanations. These theoretical expectations should be plainly established before moving to step 2.
In an oft-used comparison, detectives in criminal cases begin their investigation by focusing on those closest to the victim and then eliminating suspects (i.e., hypotheses) along the way. Social scientists should act similarly, remembering Ockham’s razor: seek first hypotheses that are clearly related to the outcome, simple, and testable before employing more complex explanations.
Step 2: Establish Timelines
The second step is to sequence events. Timelines should be bookended according to the theoretical expectations. The conclusion of the timeline will be at or shortly after the outcome of interest—that is, the dependent variable. The challenge is to identify how far back in time we must go to seek out our cause. A good timeline begins with the emergence of the theorized causal variable. For instance, we hypothesize that the compounded effect of antecedent party strength, ominous signals, and legitimization strategies causes strong authoritarian parties to embrace democratization (Slater and Wong Reference Slater and Wong2013). Therefore, we begin our timeline with the foundations of the vital components of the theory—namely, the antecedent strength of the party—and end it with the democratic transition.
The timeline has several purposes. First, it clarifies the researcher’s thought process. Second, it establishes temporal precedence. Third, it provides what can be constituted as a “face-validity” test for the argument. Fourth, it helps to identify major events that could have shaped the outcome of interest. In doing so, this allows us to revisit our hypotheses and to ascertain whether we might be missing an obvious probable cause for the concerned outcome. In essence, we give ourselves the opportunity to verify whether the events in question fit the hypotheses. Analogously, criminal investigators also use timelines to establish the victims’ histories and points where they may have met foul play. Although these timelines rarely find their way into published works, they are an imperative step in the research process. Researchers should keep their timelines readily available with updates as they progress through the many stages of fieldwork. Timeline development is a critical exercise before initiating evidence collection.
Step 3: Construct Causal Graph
After sequencing the timeline, the next step is to construct a causal graph (Waldner Reference Waldner, Bennett and Checkel2015). This type of graph identifies the independent variable(s) of interest. It also provides structure, allowing us to focus on the link between the explanation and the concerned outcome. In other words, a causal graph visually depicts the causal process through which X causes Y. With a causal graph, we can identify all moments when the concerned actor (e.g., individual, government, party, or group) made a choice that could have affected the result. This endogenous choice need not be contentious, but it does need to be theoretically relevant.
We depart slightly from Waldner (Reference Waldner, Bennett and Checkel2015), however, in two ways. First, we contend that just as not all choices are relevant moments, not all relevant moments are choices. They also can be exogenous events—that is, critical junctures that emerge from events such as the discovery of oil or a natural disaster. What matters is that these moments are “collectively sufficient to generate the outcome” (Waldner Reference Waldner, Bennett and Checkel2015, 131). Second, our use of causal graphs potentially includes events that may not fit clearly into the causal process being identified. We distinguish these events with dashed lines. In contrast, the causal process remains outlined with solid lines. This highlights and clarifies—especially for students—that not all interesting events are variables of interest.
For an example, we offer a simple causal graph of Slater and Wong’s (Reference Slater and Wong2013) theory about why strong authoritarian-party states democratize (figure 2). Slater and Wong began by presenting their scope condition: democratic transitions under the watch of dominant authoritarian ruling parties. Given this situation, our theoretical expectation would be a low likelihood of democratization. Yet, Slater and Wong (2013, 719) claimed that “dominant parties can be incentivized to concede democratization from a position of exceptional strength” under a set of three specific conditions. First, they must enjoy a high degree of antecedent strengths—that is, confidence that the party can still dominate post-transition politics. Second, this strength, however, must have been challenged by ominous signals that the party is past its authoritarian prime. Third, leaders must strategically choose to adopt democratic legitimation strategies.
Figure 2 Causal Graph of Slater and Wong (Reference Slater and Wong2013)
Causal graphs follow the initial timeline; they build on the series of events that are identified in the timeline. In other words, we can pinpoint the hypothesized explanation and the outcome in a temporal chain. We can specify where and which types of empirical information are necessary for the analysis. The timeline and the causal graph can be developed together iteratively. Whereas the sequence of events will not change, the creation of the causal graph might cause us to revisit the timeline to clarify links or highlight important missing information.
Step 4: Identify Alternative Choice or Event
At each relevant moment in the causal graph, a different choice could have been made or another event could have happened. For each distinct moment, we identify these alternative(s). It is important, however, that these alternatives are theoretically grounded. There must be a reason that the choice could have been made or that the event could have manifested differently.
Step 5: Identify Counterfactual Outcomes
Next, for each moment, we identify the counterfactual outcome that would have happened if the alternative choice had been taken or the alternative event had transpired. Counterfactuals are vital to process-tracing, especially when no alternative cases are considered (Fearon Reference Fearon1991). When treating hypothetical predictions, it is imperative that another outcome was possible. If there is no plausible theory-informed alternative outcome, then no real choice or event has taken place. Thus, the link between the input and the outcome was predetermined; hence, process-tracing provides little value added. Note that steps 4 and 5 are closely linked.
An approach in lieu of counterfactuals is the use of controlled comparisons, wherein the case of interest is compared with empirical alternatives rather than a hypothetical counterfactual (Slater and Ziblatt Reference Slater and Ziblatt2013). However, if a researcher is primarily focused on one single case—or perhaps multiple cases that are not explicitly comparable via the research design—then this counterfactual exercise is important. Even if a researcher does use controlled comparisons, we still recommend considering counterfactuals. Note, however, that counterfactuals are heuristic devices that allow us to identify hypothesized outcomes and thus potential data to collect; they are not evidence per se.
It is important that steps 1 through 5 be conducted before data collection. These activities are part of the background work that must be accomplished before engaging in any type of fieldwork—from visiting archives to conducting interviews, from administering surveys to observing participants. They are essential to the process of theory testing because they establish expectations about what researchers should encounter during their data-collection process. Because process-tracing often is iterative, researchers likely will revisit these steps throughout the research project—especially in light of new data. However, an initial plan for data collection should be designed based on these five steps.
These activities are part of the background work that must be accomplished before engaging in any type of fieldwork—from visiting archives to conducting interviews, from administering surveys to observing participants.
Step 6: Finding Evidence for Primary Hypothesis
After we have established a timeline, outlined our causal graphs, and identified our theoretical expectations, we can design the data-collection portion of our research project. At each identified relevant moment, we must plan to systematically find evidence that the variable germane to the primary hypothesis was the reason the concerned actor pursued the timeline path. It is important that as we design our data collection, we must recognize that not all evidence types are the same (Bennett Reference Bennett2014; Collier Reference Collier2011; Mahoney Reference Mahoney2012; Rohlfing Reference Rohlfing2014). Some data are necessary to establish causation; others sufficient—and then there are data that are neither or both. We suggest drawing on Van Evera’s (Reference Van Evera1997) four types of evidence, summarized in table 1: straw-in-the-wind, hoops, smoking gun, and doubly decisive. Due to space constraints, we do not explain these evidence types in detail (see Collier Reference Collier2011 for an extensive discussion). Figure 1 utilizes these evidence types and the appendix demonstrates their application.
Table 1 Types of Evidence for Process-Tracing
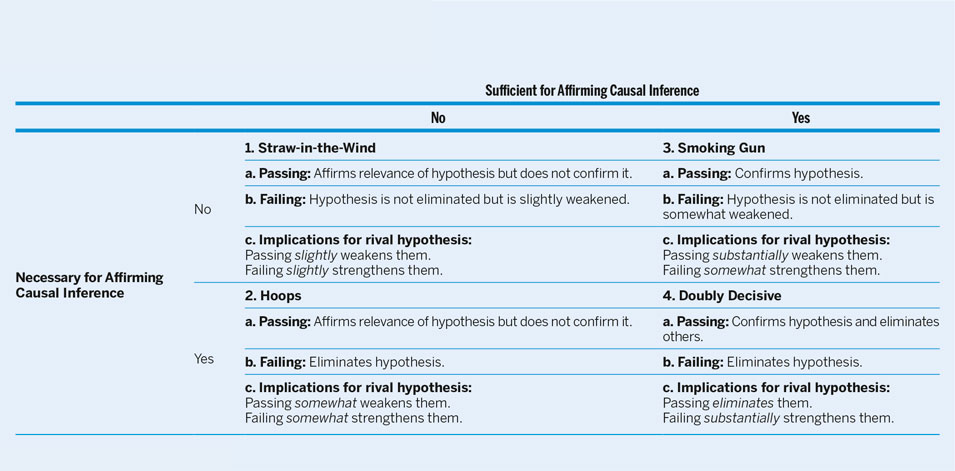
Source: Collier (2011, 825)
When creating a data-collection plan, it is common for researchers—especially those who spend time in the field—to accumulate data in a “soak-and-poke” fashion. We do not condemn such efforts; however, we encourage researchers to think carefully about the evidence types they are collecting because most information gathered will be of the straw-in-the-wind type. Stated differently, whereas much data gathered may offer weak support for—or at least not negate—the primary hypothesis, it is not the most useful for testing purposes. When designing research, it is absolutely vital to remain cognizant of the evidence type collected and its ability to support or negate the larger claims (Fairfield Reference Fairfield2013). The causal graph is particularly useful at this point because it identifies the links that must be made between our variables of interest to establish causation. For instance, certain evidence types simultaneously can support our proposed theory and eliminate a rival one. Van Evera (Reference Van Evera1997) called this doubly-decisive evidence. If such a datum is found, then we can exclude all other hypotheses and step 6 becomes the final one in our process-tracing efforts. Unfortunately, these cases are rare. Therefore, we must increase our evidence pool to demonstrate that our hypothesis is the best fit from a set of possible explanations. This is outlined in step 7.
For step 6, we exhort researchers to make clear their expectations about the evidence types needed to (1) further support their argument, and (2) negate the rival hypotheses. For instance, consider Slater and Wong’s (Reference Slater and Wong2013) assertion that democratization can emerge from strategic decisions by a ruling party. Here, we want smoking-gun evidence that links antecedent strength, ominous signals, and legitimation strategies directly to the decision to democratize. This type of evidence can be found in interviews—for example, with military advisers from the authoritarian period who relayed growing disloyalty among the armed forces and recommended the leadership to concede. It also can be ascertained from archival documents—for example, minutes from cabinet meetings discussing different electoral rules for the party to adopt on transition. Conversely, evidence describing the personalities active in alternative rival parties might be considered straw-in-the-wind. Although interesting, these data are not vital to establishing the strength of the theory; more important is information on the level of threat they posed to the ruling party. When we design data collection, we must be careful to focus on the evidence types that matter lest we be left building our evidentiary house with a pile of straw.
Process-tracing involves rigor and attention to details and logic of causal inference similar to that of a detective or a medical examiner.
Step 7: Find Evidence for Rival Hypothesis
Our final step is to repeat step 6; at each choice node, the focus now should be on alternative explanations. This step may require multiple iterations depending on the number of rival hypotheses. The objective is to dismiss as many explanations as possible, leaving only one hypothesis as the most likely. Here, the most important evidence type is the exclusionary or—per Van Evera (Reference Van Evera1997)—the hoops test. Hoops evidence, if absent, can eliminate a hypothesis from consideration. If the hypothesized variable was not present when the event happened, then we can dismiss the rival hypothesis.
If the rival explanation is not easily discarded, we must move on to other data types. Wherever possible, we look for opportunities to dismiss the hypothesis. However, if at some point we find evidence to the contrary, we cannot reject it. Instead, we must consider that a rival hypothesis could explain the phenomenon of interest better than the primary one.
Because political phenomena are complex, it is possible that the different explanations may not be mutually exclusive (Zaks Reference Zaks2017). Therefore, pitting competing hypotheses against one another can result in instances in which multiple hypotheses all seem to have explanatory leverage. When these conditions manifest, we must rely on a deep understanding of our cases to weigh the evidence and judge which hypothesis best explains the outcome. As in a criminal investigation, we must discern which theory of the crime has the strongest evidence and proceed as best we can to trial.
CONCLUSION
Despite the popularity of process-tracing in empirical research, discussions on how to develop effective research designs based on the method are largely absent in political science—especially when we consider teaching materials. Frequently, there is a disjuncture between theoretically driven research designs and rigorously evaluated empirics. Beyond this, to those who do not regularly engage in process-tracing, the method can be poorly understood. The prime advocates of process-tracing continue to make strides in pushing methodological understanding and boundaries. This work, however, does not necessarily lend itself to introducing the tool to the uninitiated. As a result, critics have dismissed process-tracing as being ineffective in explaining political phenomena beyond a singular case—if even that. We understand but do not agree with these positions.
Process-tracing involves rigor and attention to details and logic of causal inference similar to that of a detective or a medical examiner. It requires establishing a sequence of events and identifying a suspect pool. With each piece of evidence, we can eliminate a variable and/or strengthen one hypothesis against another. We conduct this iterative process until we are ready for trial. In this spirit, we offer our checklist to help researchers develop a causal research design and then evaluate pieces of evidence systematically against it. Such practical guidance is largely missing in the process-tracing literature. This guide and the applications in the online appendix attempt to address this shortcoming and to demonstrate how process-tracing can be done rigorously. We challenge advocates to adopt these standards in their own work and skeptics to conceptualize process-tracing as more than glorified storytelling. We also hope that the method can be integrated easily and clearly as a component of political science courses—not only in methods classes but also in substantive courses. Indeed, through careful application, process-tracing can serve as a strong tool for hypothesis testing.
SUPPLEMENTARY MATERIAL
To view supplementary material for this article, please visit https://doi.org/10.1017/S1049096518000975
ACKNOWLEDGMENTS
We thank Marissa Brookes, Jason Brownlee, José Cheibub, Travis Curtice, Jennifer Cyr, John Donaldson, Richard Doner, Zach Elkins, Michael Giles, Anna Gunderson, Nicholas Harrigan, Abigail Heller, Allen Hicken, Laura Huber, Kendra Koivu, James Mahoney, Eddy Malesky, Joel Moore, Ijlal Naqvi, Sari Niedzwiecki, Rachel Schoner, Dan Slater, Hillel Soifer, Kurt Weyland, and the anonymous reviewers for helpful comments on this article. An earlier version was presented at the 2016 Southwest Mixed Methods Research Workshop at University of Arizona. We were able to convert this project from an idea to an article under the auspices of the Short-Term Research Collaboration Program at Singapore Management University. Any errors belong to the authors.


