


Introduction
Diarrhoeal disease is the second leading global infectious cause of under 5 mortality and can be caused by a variety of viral, bacterial, protozoan and macroparasitic agents [Reference Liu1, Reference Lanata2]. Most of these enteric infectious diseases (EID) exhibit some kind of seasonality, their incidence peaking at a particular point in the annual cycle and receding at others each year [Reference Neuzil and Kotloff3]. These patterns may vary with latitude and climatic zone and, for diseases with multiple routes of transmission, different mechanisms may come to dominate their relative contribution to overall burden at different points in the annual cycle [Reference Sarkar, Kang and Naumova4]. Improving understanding of the pathogen-specific seasonality of EID is methodologically challenging but critical to informing policy on the timing of preventive measures and to forecast the impact of climate change on future disease burden trends [Reference Grassly and Fraser5, Reference Levy, Hubbard and Eisenberg6].
Seasonality of health outcomes can be assessed using Serfling models, regression models fitted to time series data with a harmonic component, wherein sinusoidal transformations of the time metric are introduced in pairs to capture the oscillating pattern characteristic of seasonally varying outcomes when plotted over time [Reference Naumova, MacNeill, Auget, Balakrishnan, Mesbah and Molenberghs7]. This approach has the advantage of treating cyclical calendar time as a continuous predictor, rather than categorising it into 12 bins representing each month of the year [Reference Altman and Royston8]. Furthermore, harmonic pairs can be introduced in a stepwise manner, to capture increasing complexity of a seasonal pattern [Reference Naumova, MacNeill, Auget, Balakrishnan, Mesbah and Molenberghs7]. This approach was first developed for use on passive surveillance or health-facility based data sources, which tend to cover long-time periods but are, by their nature, restricted to reportable morbidity- or mortality-related outcomes which manifest only as severe, symptomatic or fatal cases [Reference Serfling9]. Often this also means that the outcome is rare, necessitating aggregation of weekly, monthly or seasonal summary statistics [Reference Fisman10].
For EID episodes, which may be mild, self-limiting or sub-clinical, a promising alternative source of data is active surveillance of community-based cohorts, which can capture the underlying infection status as transmission occurs in the community as well as potential time-varying covariates [Reference Sarkar, Kang and Naumova4, 11]. While such observational studies tend to span a shorter length of follow-up time and are not guaranteed to detect sufficient numbers of cases, Sarkar and colleagues have demonstrated that it is still possible to make statistically valid inferences about pathogen-specific seasonality of EID – namely, rotavirus diarrhoea episodes – by applying the harmonic method to data from a small birth cohort with follow-up spanning <5 years [Reference Sarkar, Kang and Naumova4]. Such analyses must take careful account of the interaction between age and risk of infection, loss to follow-up and within-subject correlation, and, since a consensus has yet to be reached on the precise methodology for doing so, results should be interpreted cautiously and in light of prior findings.
The objective of this paper is to apply an adapted Serfling approach to data on rotavirus infections from a multi-site cohort study in order to characterise this EID's seasonality in eight different locations. Infection with this segmented, double-stranded RNA virus is a near-ubiquitous feature of infancy, with around 95% of children globally experiencing at least one rotavirus infection before 5 years of age prior to the introduction of the vaccine in, as of the time of writing, 92 countries [Reference Bernstein12, 13]. Recent meta-analyses and review articles have concluded that, while the long-recognised pattern of sharp winter peaks receding to negligible levels in the offseason holds in temperate, mid-latitude regions, tropical regions exhibit more sustained, year-round rotavirus transmission with discernible, but less pronounced relative peaks [Reference Levy, Hubbard and Eisenberg6, Reference Ahmed, Lopman and Levy14–Reference Jagai19]. In tropical South Asia, moreover, biannual peaks in rotavirus are observed, with a large spike in winter followed around 6-months later by a smaller, secondary uptick coinciding with the monsoon rains [Reference Sarkar, Kang and Naumova4, Reference Patel16, Reference Jagai19, Reference Rahman20]. Questions remain about how consistently these patterns hold across different climatic zones, about the relative contribution of environmental drivers and host-related factors such as asymptomatic infections, and whether year-round transmission in tropical regions acts as a reservoir for the seasonal reintroduction of the virus to temperate zones [Reference Sumi21, Reference Cook22]. We attempt to address these knowledge gaps using data from the Interactions of Malnutrition & Enteric Infections: Consequences for Child Health and Development project (MAL-ED).
Methods
Study population
The MAL-ED project offers a unique opportunity for a long-called-for comparative analysis that can apply the same approach to data from multiple locations and on different pathogens in order to elucidate the patterns and determinants of their seasonality [Reference Sarkar, Kang and Naumova4, Reference Grassly and Fraser5, 11]. The study was established in 2009 with the aim of investigating the risk factors for enteric infection, diarrhoeal disease, undernutrition and other related adverse outcomes. Birth cohorts were recruited and monitored in eight communities, each in a different low- and middle-income country (LMIC) – Bangladesh, Brazil, India, Nepal, Pakistan, Peru, South Africa and Tanzania – across three continents. The MAL-ED study used molecular diagnostics and standardised surveillance protocols and assays to track data on EID incidence, nutritional and anthropometric outcomes, cognitive development and biological markers [11, Reference Houpt23]. The resulting longitudinal dataset contains, among other things, data on infection status for more than 30 enteric pathogens in 40 500 stool samples collected from 2199 infants from ages 0 to 24 months between November 2009 and March 2014. These samples were routinely collected as part of active surveillance on, or within 2 days of the monthly anniversary of the child's birth [Reference Houpt23]. Additional, off-monthly samples of diarrhoeal stool were collected in between the monthly assessments on days in which the caregiver reported that the child was having a diarrhoeal episode [11]. In this way, the study was able to detect mild and even asymptomatic cases, a more proximal indicator of endemic pathogen transmission and a less rare outcome than clinical manifestations [11]. At the time of data collection, three of the countries in which the study sites are located – Brazil, Peru and South Africa – had introduced the rotavirus vaccine into their routine childhood immunisation schedules.
Outcome variables
Stool samples were tested for the presence of shed rotavirus using enzyme-linked immunosorbent assay methods that were standardised across sites [Reference Houpt23]. The outcome of interest in this analysis was, therefore, the time-varying, stool sample-level, binary infection status variable, for which a value of 1 signifies that a stool sample was found to be positive for rotavirus and 0, negative. To ensure that a single episode of rotavirus infection was not counted multiple times, rotavirus-positive stool samples were excluded from the dataset if they were collected within 14 days of a previous positive sample, without being separated by an intermediate negative sample (this being a plausible maximum duration of viral shedding in immunocompetent persons) [Reference Hamborsky, Kroger, Wolfe and Rotavirus24, Reference Rouhani25].
Statistical methods
This analysis applied a Serfling model to the binary rotavirus infection status data to test for and quantify the effects of seasonal patterns in prevalence at each MAL-ED site. Because this is a multi-site study, with cohorts selected from communities located in different parts of the globe each with their own seasons and climate, the analysis was performed separately for each site to model the rotavirus isolation rate – the proportion of positive stools – over time [Reference Sumi21]. This was approximated by the probability of a stool sample being positive for rotavirus, which in turn was estimated from the regression coefficient values for equation (1) (adapted from Stolwijk et al.) [Reference Stolwijk, Straatman and Zielhuis26]:
 $$\eqalign{{\rm logit}P(Y_{it} = 1) & = \beta _0 + \beta _1 \times {\rm sin}\left( {\displaystyle{{2\pi t} \over {365.25}}} \right) + \beta _2 \times {\rm cos}\left( {\displaystyle{{2\pi t} \over {365.25}}} \right) \cr & \quad + \beta _3 \times {\rm sin}\left( {\displaystyle{{4\pi t} \over {365.25}}} \right) + \beta _4 \times {\rm cos}\left( {\displaystyle{{4\pi t} \over {365.25}}} \right) \cr & \quad + \mathop \sum \limits_j \left( {\gamma _j \times {\rm tim}{\rm e}_{\rm t}} \right) + \mathop \sum \limits_k \left( {\theta _k \times {\rm ag}{\rm e}_{it}} \right)} $$
where
t = the date of follow-up
P(Y it = 1) = The probability of a stool from individual i being positive for rotavirus on date t
β0 = the mean log odds of positivity over the entire follow-up period
β1 and β2 = sine and cosine coefficients for the first harmonic
β3 and β4 = sine and cosine coefficients for the second harmonic (to be included based on a comparison of the quasi-likelihood information criteria (QIC) for the model compared with a null model that includes only the first harmonics)
γj = a series of j cubic spline terms for calendar time in months on date t (centred at the mid-point of follow-up)
θk = a series of k cubic spline terms for individual i’s age in months on date t (centred at 12 months of age)
The model was fitted using generalised estimating equations (GEE) to account for the considerable within-subject clustering of rotavirus infections. The primary exposures of interest in this longitudinal analysis were the four Fourier series functions (first and second harmonic sine and cosine transformations of the day of the year ranging from 0 to 365), which were added as terms to the model with stepwise selection of the second harmonic pair based on the QIC statistic [Reference Pan27]. The time metric was continuous calendar time in days, a variable that was included in the model as a covariate centred on the mid-point between the earliest and latest observation in the dataset, to adjust for potential secular trends in rotavirus transmission over the course of follow-up. Restricted cubic spline terms for this variable were included with degrees of freedom and knot positions determined separately for each study site using a multivariable regression spline fitting algorithm [Reference Royston and Sauerbrei28]. This was to account for the potential confounding effects of isolated outbreaks, which might give the appearance of seasonality, due to being heavily clustered over a short period within a single year. The infants’ age in continuous months at the time of the stool sample (centred on the first birthday) was also included using site-specific cubic splines to account for the non-linear association between rotavirus risk and age in this cohort [Reference Mohan29]. By including this smooth function for age the cumulative acquisition of immunity within the study population could also be adjusted for [Reference Imai30]. Infection by a given rotavirus genotype confers only partial, homotypic immunity that diminishes the severity of, but does not prevent, subsequent infections [Reference Linhares31]. Repeated rotavirus episodes within the same individual are therefore common, but may be less likely to become clinically apparent in older infants. Since the cumulative incidence of rotavirus infection necessarily rises steadily over the first 2 years of life, age can be used as a proxy for acquired immunity.
The timing, amplitude and number (single or double) of the annual peaks in the rotavirus isolation rate were estimated for each study site from the output of the model. The primary peak was defined as the highest probability predicted by the model and its amplitude was calculated as the difference between this value and the lowest predicted probability over the year. The secondary peak was defined as the peak with the lower maximum value and its amplitude was also calculated relative to the lowest predicted probability (the global, as opposed to the local minimum). The overall statistical significance of the seasonal pattern was assessed based on the Wald test for the combined contribution to the model of all included harmonic terms. Finally, the seasonal pattern was visualised by plotting the predicted probability of rotavirus positivity for each study site against the day of the year. The shapes of these plots were compared with those obtained from lowess smoothed averages and restricted cubic spline models to assess their fit. The combined significance of the age terms, the calendar time terms and the harmonic terms were each assessed using the Wald test while the overall model fit was assessed by calculating QIC statistics for the final models. To compare the seasonality patterns between symptomatic and asymptomatic infection episodes, the analysis was repeated first on only the stool samples obtained according to the monthly schedule (by active surveillance), and secondly on those collected during diarrhoeal episodes (by passive surveillance), to approximate the rate of, respectively, symptomatic and asymptomatic transmission. Analyses were carried out using Stata 13.1 [32].
Results
Exploratory analysis
Figure 1 shows the locations of the eight MAL-ED study sites in relation to the Equator and Tropics of Cancer and Capricorn. Half of the sites lie in the Southern hemisphere with three of these – Brazil, Peru and Tanzania – situated close to the Equator and the fourth close to the southern edge of the tropics. Of the sites in the Northern hemisphere, one (India) is located in the tropics, and the remaining three are within the mid-latitudes.

Fig. 1. Locations of the eight MAL-ED study sites in relation to the Equator and Tropics of Cancer and Capricorn.
Table 1 summarises the number of study subjects, the number, percentage and clustering of rotavirus-positive samples, the length of follow-up time and the proportion of participants that were lost to follow-up in each of the MAL-ED study sites. The largest number of rotavirus infections (227), the highest stool positivity rate (4.1%) and the highest proportion of study subjects who experienced at least one rotavirus infection episode (the cumulative probability of first infection – 57.4%) were seen in the Bangladesh site, while the site where the corresponding statistics were all lowest – respectively 17%, 0.6% and 7.0% – was in Brazil, The Brazil site also had the smallest number of study participants, total number of samples and months of follow-up. Among the sites located in countries that have introduced the rotavirus vaccine, the Peru site had the highest stool positivity rates and the cumulative probability of rotavirus infection, as well as the longest follow-up time and the largest number of study subjects and stool samples collected of any site. There were large differences between sites in the percentage of stool samples in the dataset that were diarrhoeal (off-monthly) ranging from 2.9% in Tanzania to 35.8% in Pakistan. The level of within-subject clustering of rotavirus infections was high enough to justify the use of GEE (>10% of episodes occurring in infants experiencing two or more episodes) at all sites. In Bangladesh and Peru within-subject clustering was high, with more than half of infants who experienced one rotavirus infection going on to experience a second and more than 20% experiencing a third. In Brazil, no study subject experienced three rotavirus infections over the course of follow-up. The loss to follow-up was defined as the proportion of the total number of participants for whom no observation was recorded after age 23.5 months and exceeded 10% in all sites except India and Nepal. In the Brazil and Nepal sites, these levels of attrition were considerable with more than a third of the initial participants lost to follow-up by 24 months of age. Exploratory analysis of the missingness patterns (not reported) indicated that the probability that an observation was missing did not depend on the subjects’ history of observed rotavirus episodes, suggesting an underlying mechanism of Missingness Completely at Random (MCAR).
Table 1. Number of study subjects, number, percentage and clustering of positive samples and follow-up time for rotavirus in each of the MAL-ED study sites

The percentage of rotavirus episodes occurring in subjects that experienced two or more and three or more episodes.
a Country in which the rotavirus vaccine had been introduced at the time of the study.
Figure 2 shows needle plots of the observed daily distribution of rotavirus infections (included positive samples) for each site along with the overall length of follow-up time. With the possible exception of the Peru site, infections appear to be sparsely distributed at the beginning and end of the follow-up period and occur with more density during the middle period suggesting a non-linear association with age. Some clustering of infections at certain times of year are discernible in most sites with the exception of Brazil, in which the distribution was too sparse to discern a pattern, and South Africa, where two isolated outbreaks within a single year (2012) are the only obvious clusters.
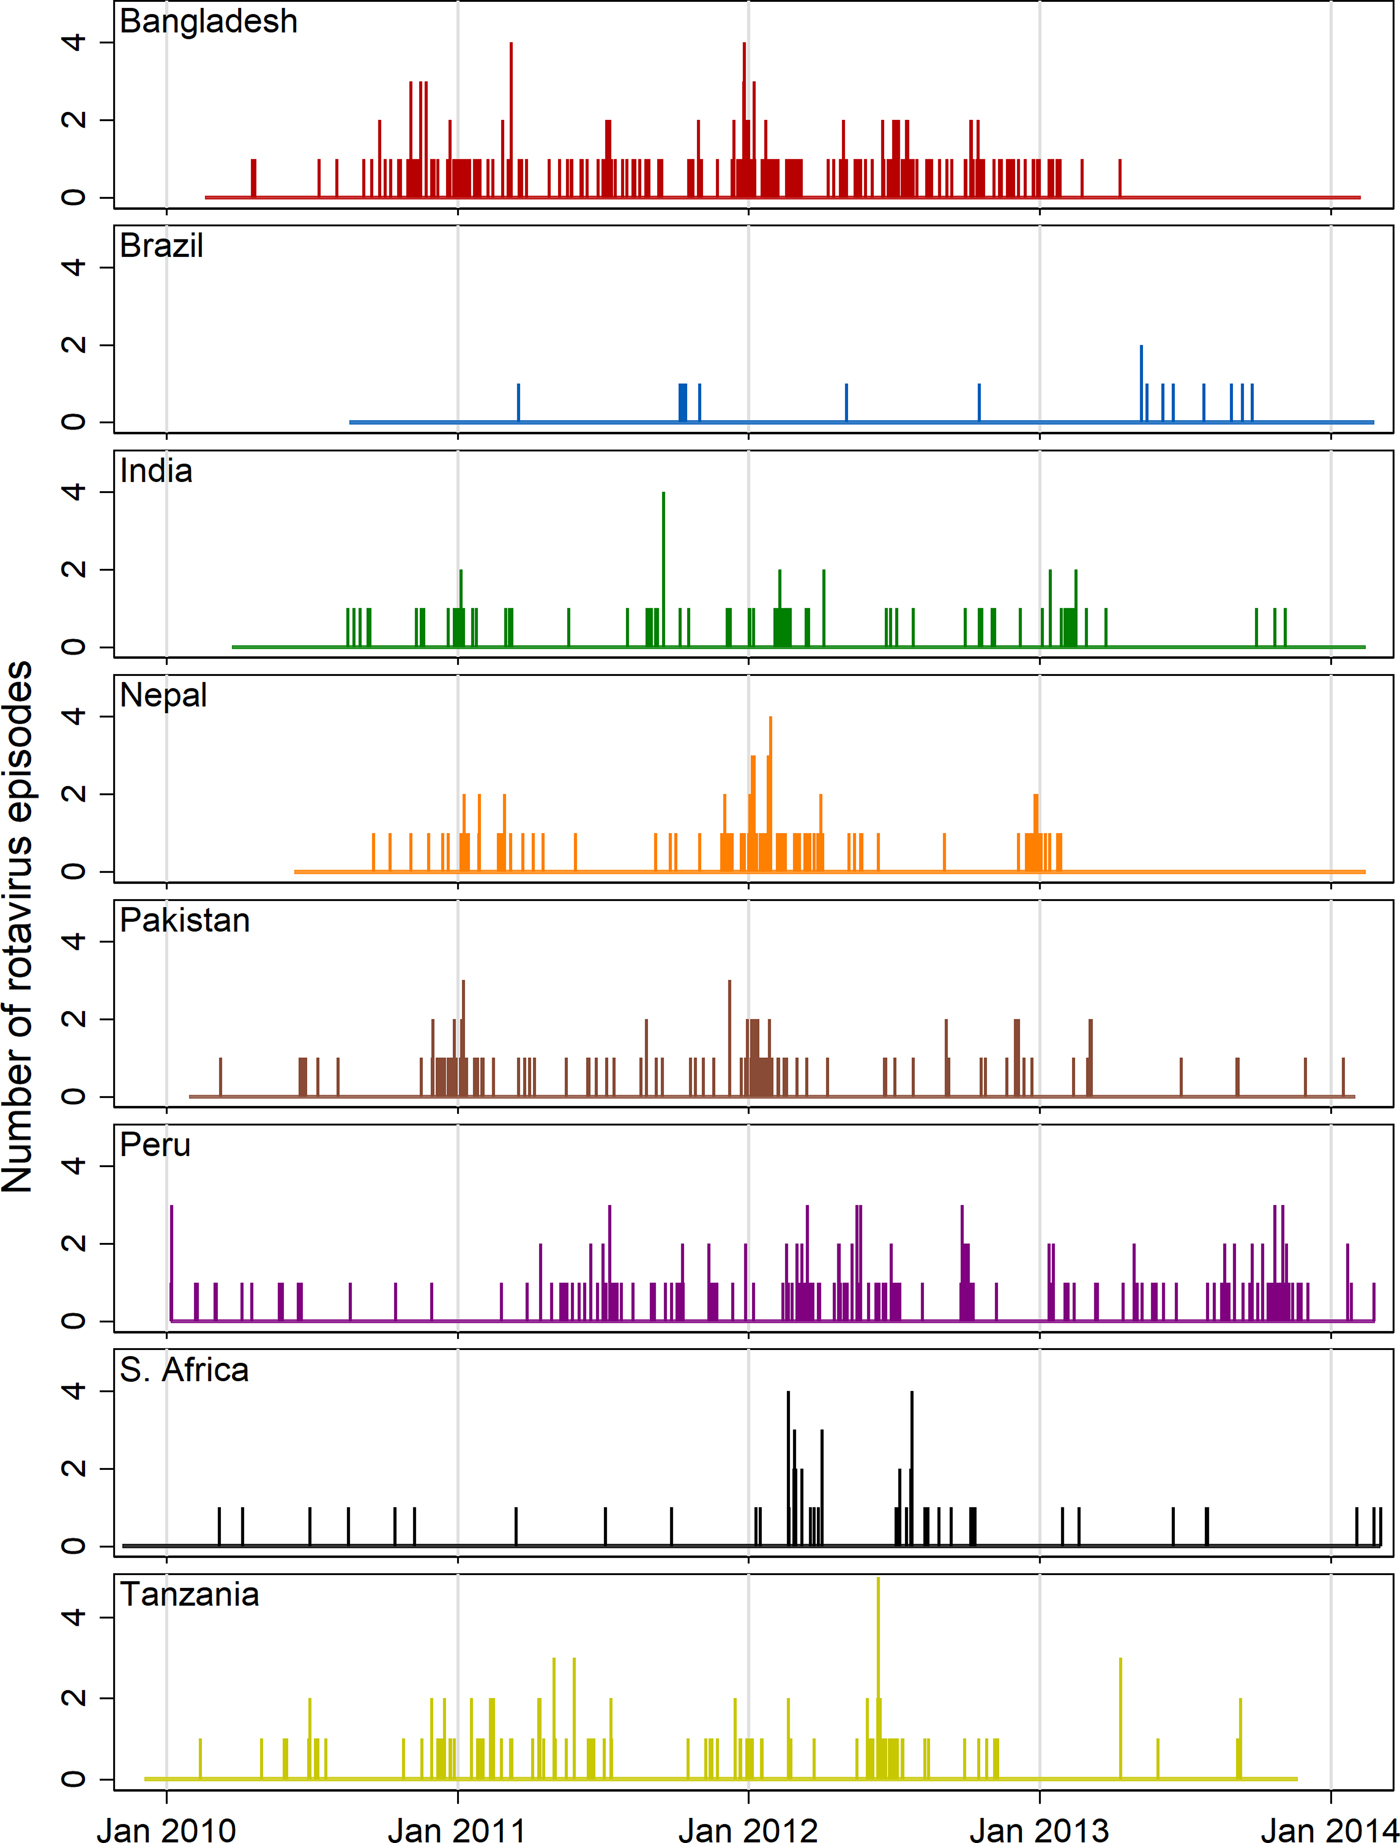
Fig. 2. Needle plots of the daily distribution of rotavirus-positive stool samples recorded at each MAL-ED site (rotavirus-negative samples not shown).
Model results
Table 2 summarises the Wald test chi-squared statistics for the combined significance of the terms for each of the covariate predictors (i.e. the cubic spline terms for age and time and the harmonic terms for seasonality) as well as the seasonality parameters predicted by the logistic model fitted with GEE. The test statistic for the combined contribution of the harmonic terms to the model was highly statistically significant in all sites with the exception of Brazil and South Africa where it was only slightly significant. In all sites except Pakistan and South Africa, the model that included both the first and second harmonics (4 degrees of freedom) was a better fit for the data than an equivalent that only included the first harmonic according to stepwise selection based on the QIC statistic. At the Nepal, Pakistan and South Africa sites, the models predicted a single annual peak in transmission, whereas at the other sites, both a primary and a smaller secondary peak were predicted. The highest predicted probability of rotavirus infection in absolute terms was the single annual peak in Nepal (10%) followed by the primary peak in Bangladesh (8%). The highest amplitude – the largest difference between the highest and lowest annual values – was also seen in Nepal (9 percentage points’ difference) followed by India (7 percentage points).
Table 2. Wald test chi-squared statistics for covariate predictors (with degrees of freedom) and seasonality parameters predicted by logistic model fitted with GEE
a Country in which the rotavirus vaccine had been introduced at the time of the study.
†††p < 0.001, ††p = 0.001–0.01, †p = 0.01–0.05. Numbers in parentheses indicate degrees of freedom – the number of model terms selected for that covariate.
Figure 3 shows a graphic visualisation of the annual seasonal pattern in rotavirus prevalence predicted by each of the eight site-specific models with the approximate period of the year with the highest precipitation shown in blue-grey. In all four of the South Asian sites, the primary peak in rotavirus prevalence occurred between the end of December and the very beginning of February coinciding with the dry season. In addition, at the Bangladesh and India sites, the models predict a smaller secondary peak during the second half of the year, whereas in Nepal and Pakistan, transmission appears to recede to a very low level during the off-season. In Brazil, for which only a very small number of episodes were recorded in the dataset, biannual peaks were also predicted but with very small amplitude values, wide confidence intervals and a lower level of statistical significance. With the data from the Peru site, the model predicted a subtle but highly statistically significant pattern of two small peaks in early May and October followed by slightly lower levels of transmission in the period from December to February. While the seasonal pattern in South Africa attains a slight level of statistical significance, the small amplitude of the predicted peak and the low overall level of transmission are not suggestive of strong evidence for variation during the annual cycle.
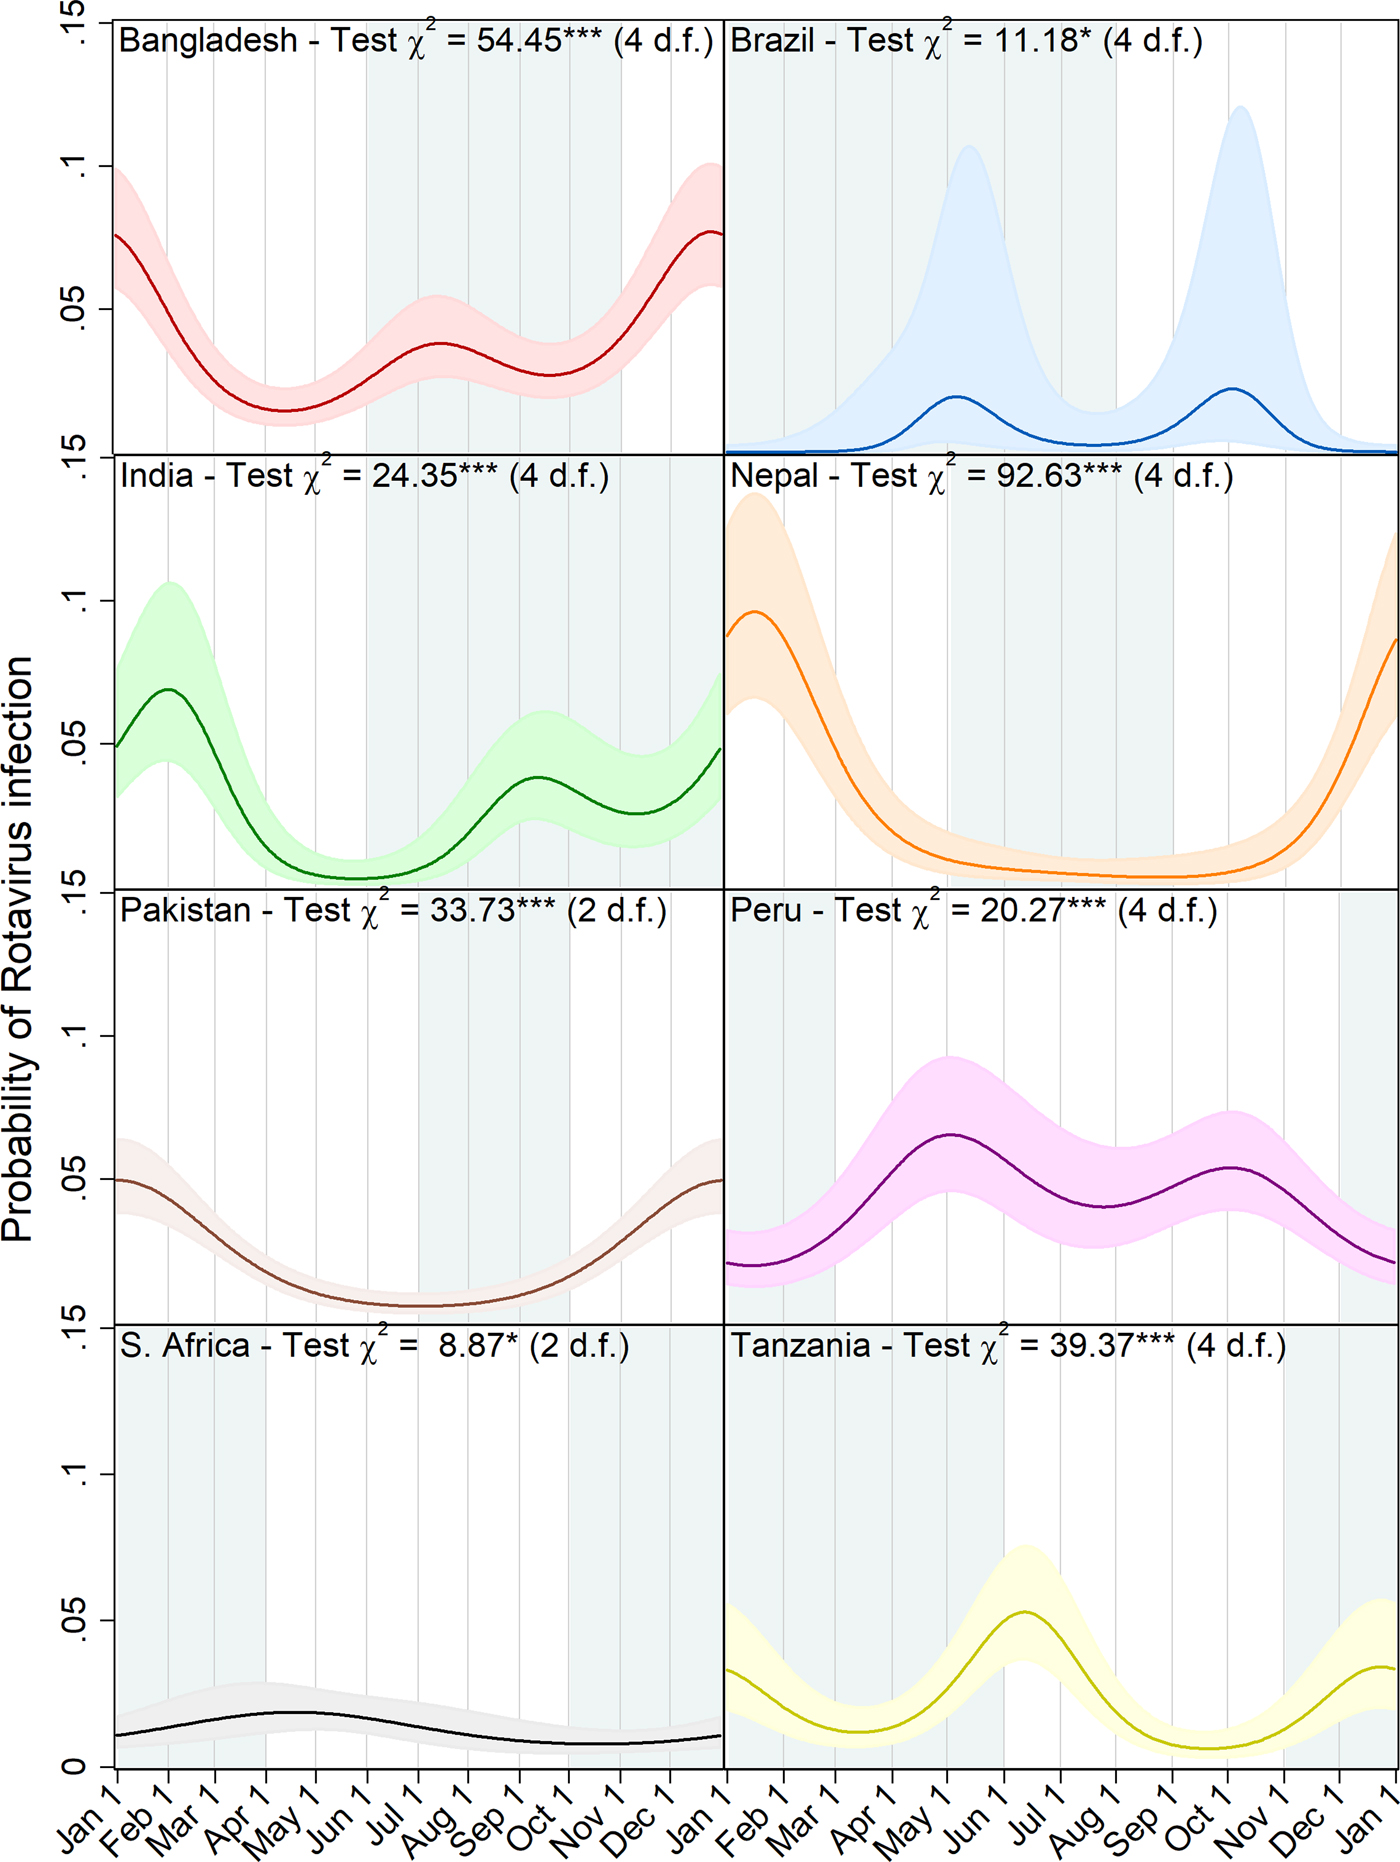
Fig. 3. Predicted probability of rotavirus infection by day of the year with 95% confidence intervals, Wald test chi squared statistics and degrees of freedom (d.f.) for harmonic terms (***p < 0.001, **p = 0.001–0.01, *p = 0.01–0.05). Local rainy seasons are shaded blue-grey.
Table 3 presents the equivalent seasonality and model statistics resulting from restricting the analysis first to only the monthly samples, and then to the diarrheal samples. In the Bangladesh and India sites, the seasonal pattern of rotavirus prevalence in diarrhoeal stools exhibited more pronounced primary and secondary peaks and attained a higher level of statistical significance than in monthly stools and the timing of both peaks was broadly similar across the three analyses. In Nepal too, the maximum value and amplitude of that site's single peak were of a larger magnitude in the diarrhoeal samples and smaller in the monthly than in the full dataset and both improved upon the fit of the original model considerably according to the QIC statistic. Brazil was the only site at which the peak prevalence of rotavirus in monthly samples was considerably higher and the peak in diarrheal samples lower than when the two sample types were combined. The data from the Pakistan site exhibited a summertime secondary peak in prevalence in monthly samples that was not apparent in the diarrhoeal samples or full data and had a more statistically significant seasonal pattern than either. In Peru, the timing of the primary and secondary peaks was reversed in the monthly samples compared with the other analyses. Neither of the stool samples types showed a statistically significant pattern at the South Africa site and in Tanzania, the seasonal pattern in the monthly stools was similar in terms of peak timing and significance to the full model, but the pattern in diarrhoeal stools was not statistically significant.
Table 3. Wald test chi-squared statistics for harmonic terms (with degrees of freedom) and seasonality parameters predicted by logistic model fitted with GEE by sample type

†††p < 0.001, ††p = 0.001–0.01, †p = 0.01–0.05. Numbers in parentheses indicate degrees of freedom – the number of model terms selected for that covariate.
a Country in which the rotavirus vaccine had been introduced at the time of the study.
Discussion
Despite widespread recognition of the seasonal nature of the epidemiology of EID, the mechanisms underlying this phenomenon are poorly understood compared with other disease groups [Reference Grassly and Fraser5, Reference Altizer33]. With some notable exceptions, most studies of the seasonality of these diseases have been hindered by data being aggregated up to weekly, monthly or quarterly cumulative incidence, rather than daily estimates [Reference Patel16, Reference Naumova34]. There is also a paucity of studies on seasonality of EID coming from developing countries – particularly Africa and South America – and those in the tropics and the southern hemisphere [Reference Ahmed, Lopman and Levy14]. Because of its unique design, the MAL-ED study has the potential to address many of these knowledge gaps and elucidate the drivers of seasonality by comparing pathogen-specific patterns across sites, and multiple pathogens within the same location.
In this analysis, we applied a flexible statistical approach to characterising cyclical patterns in prevalence to data on rotavirus infection status in the eight MAL-ED birth cohorts and obtained results that are consistent with those reported in the prior literature, while also being suggestive of novel insights that merit further exploration. In the four South Asian sites, our model predicted marked primary peaks in the December to January dry season, congruent with a hypothesised inverse relationship with air humidity [Reference Nathanson and Kew35]. Furthermore, at the Bangladesh and India sites (and at the Pakistan site when restricted to monthly samples only), secondary monsoon-season peaks were predicted, in line with similar findings documented in the literature [Reference Sarkar, Kang and Naumova4]. In two of the sites in rotavirus vaccine countries – the urban community in Brazil with relatively widespread access to improved water and sanitation [Reference Lima36], and the remote, rural location in South Africa [Reference Bessong37] – the amplitude of the seasonality predicted by the model was much smaller and less statistically significant than elsewhere, in a way that was proportionate to the lower background endemicity of the virus in those locations. This is consistent with the documented ‘blunting’ of the annual rotavirus peaks following the introduction of the vaccine [Reference Richardson38]. Low amplitude seasonality was also evident in the site in Peru – the third vaccine country – however, where the pattern was nonetheless highly statistically significant. While both peaks at the Peru site occurred during the drier part of the year, this apparent correlation should be interpreted with caution, since that location is subject to year-round rainfall, which means that the rainy season is far less marked than at the other sites [Reference Yori39]. In Tanzania, the biannual peaks predicted by the model both had a similar amplitude with the slightly larger of the two coinciding with the mid-year dry winter and the smaller with the November to May rainy season [40].
Seasonal patterns of rotavirus positivity were broadly similar when the analysis was repeated on both the monthly and the diarrheal stool subsets (with the exception of the diarrhoeal stools at the Tanzania site, which may be explained by their representing by far the smallest proportion of the overall data at any site). The amplitude of the peaks in diarrheal stools appear to have a greater magnitude, but this analysis did not adjust for the underlying seasonal variation in diarrhoeal episodes of any aetiology. Our results suggest that symptomatic and sub-clinical rotavirus episodes do not differ substantially in their seasonal patterns and contribute roughly equally to the overall annual trend.
Since human rotavirus has no known animal reservoir, it has been speculated that tropical regions with year-round endemic transmission are the main reservoir from which the virus spreads poleward each year at the start of the rotavirus season when conditions favour its reintroduction into temperate zones [Reference Cook22]. Findings from Török and colleagues that the start of the annual rotavirus season in the USA occurs earliest in the southwest and progresses sequentially northeastward over the course of the winter, lend weight to this theory [Reference Török41]. Some of the results presented here are consistent with this hypothesis. In the higher latitude sites of Nepal, Pakistan and South Africa, off-season transmission appears to recede to negligible levels, while the more tropical Bangladesh, Peru and, to a lesser extent, Tanzania sites experience more sustained low season transmission. The exceptions to this pattern are the Brazil site (perhaps due to the success of the vaccine in reducing transmission there) and India, a tropical location in which transmission recedes almost entirely for a significant part of the year.
The high level of within-subject clustering detected in the sites with the highest rates of rotavirus infection is of interest in light of increasing evidence as to the role of histo-blood group antigen-controlled host ranges in determining age-specific susceptibility to rotavirus infection [Reference Jiang, Liu and Tan42]. This was perhaps most striking in the Peru site, which, despite being in a rotavirus vaccine country, had levels of within-subject clustering comparable to that of the Bangladesh site. A previously published analysis of the MAL-ED data has shown that the high rotavirus incidence in the Peru site is largely concentrated in the 12–24 month age range and may be due to waning vaccine-induced protection during this period of infancy [Reference Mohan29]. In all eight sites, more than 50% of rotavirus infection episodes occurred in the quintile of the study subjects that experienced the most infections. In Brazil and South Africa, all cases occurred in this quintile due to the apparent overall low levels of endemicity, but in Peru, this proportion was 61.2%. These statistics suggest that a large proportion of the burden of rotavirus is borne by a relatively small proportion of the study subjects and the extent to which this clustering is attributable to host factors (such as immunity conferred by gut microbiota composition) and host secretor status as opposed to environmental variables merits further investigation.
Although we have identified statistically significant seasonal patterns, caution should be exercised in deriving inferences about the underlying pathways driving these trends, particularly when extending the approach to other pathogens. While these results may seem highly suggestive of an overlapping environmental influence, such as cyclical changes in the weather constraining the transmission and survival of the disease agent, the influence of co-seasonal social, behavioural and immunological determinants of transmission risk cannot be ruled out on the basis of these findings alone [Reference Grassly and Fraser5, Reference Fisman10, Reference Wu43]. In reality, the true mechanisms underlying infectious disease seasonality include multifarious environmental, behavioural and immunological drivers that are specific to particular pathogens, their human (and non-human) hosts and their locations [Reference Grassly and Fraser5]. These can interact to produce subtle periodic fluctuations in either the reproductive number or the fraction of the population susceptible to infection at a given time of the year [Reference Fisman10]. For some diseases, the influence of the weather may indeed be fairly direct, whereas, for others, they may be mediated through changes in behaviour of the human host such as rainfall altering patterns of contact between infected and susceptible individuals as they congregate indoors [Reference Chan, Fu and Hwang44]. Furthermore, even for pathogens for which weather has a direct influence on transmission, competing mechanisms may come to dominate their relative contribution to overall burden at different points in the annual cycle. The example of rotavirus in South Asia is illustrative of this. The large winter peak noted here and elsewhere in the literature may be accounted for by airborne transmission on dried dust substrates, while the smaller monsoon peak may be due to the wider dispersal of the virus in floodwater and runoff promoting water-borne transmission [Reference Levy, Hubbard and Eisenberg6]. Analysis of the influence of specific seasonally varying climate variables (beyond basic comparisons with the timing of the site-specific rainy seasons presented here) are beyond the scope of this paper, but have the potential to provide further insights into rotavirus transmission dynamics and will be explored in subsequent MAL-ED publications.
The approach presented here is sufficiently flexible to be adapted to other pathogens or outcomes in the MAL-ED dataset or to similar studies in other locations, to further characterise and explore seasonal patterns in their occurrence. The Serfling approach may be applied to other ways of modelling these outcomes, such as log incidence [Reference Sarkar, Kang and Naumova4], case counts (modelled as a Poisson distribution) [Reference Naumova34] or a hazard function in a survival analysis. Furthermore, the method can be used not just to test for the statistical significance of seasonality but also to control for it as a potential confounder of the main association of interest [Reference Imai30]. Investigations into the association between climate and seasonally varying health outcomes may incorporate harmonic terms to assess whether they retain their statistical significance in the presence of specific hydro-meteorological parameters, a sign that host factors and other non-environmental drivers may be playing a causal role. Future research into the relative contribution of these causal pathways may also adjust for confounding by behavioural and sociodemographic factors such as access to improved water and sanitation, socioeconomic status, dietary intake, fertility rates and contact with animals as well as highly temporally disaggregated climate data [Reference Patel16].
The findings presented here have practical implications for the evaluation of programmes and interventions that aim to reduce EID incidence. Attempts to quantify the impact of such measures should take into account the point in the seasonal cycle at which the outcome is ascertained in order to avoid misattributing to the intervention trends that are in fact consistent with the normal annual patterns. As this study demonstrates, these patterns can vary considerably between neighbouring countries – as is evident from comparing the results for the Tanzania and South Africa MAL-ED sites – or show similarities across large geographic areas – as seen in the four South Asian sites – so knowledge of the local context is critical.
Acknowledgements
The authors are grateful for the invaluable contributions of the parents and caregivers of the study participants. We also thank Professors William Checkley, Justin Lessler and David Sack and Dr Elizabeth Colantuoni for their insightful comments and feedback.
Financial support
The Etiology, Risk Factors, and Interactions of Enteric Infections and Malnutrition and the Consequences for Child Health and Development Project (MAL-ED) is carried out as a collaborative project supported by the Bill & Melinda Gates Foundation, the Foundation for the National Institutes of Health and the National Institutes of Health, Fogarty International Center. Additional support was obtained from the Sherrilyn and Ken Fisher Center for Environmental Infectious Diseases of the Johns Hopkins School of Medicine.
Conflict of interest
None.
Ethical standards
Ethical approval for MAL-ED was given by the Johns Hopkins Institutional Review Board as well as from the respective partner institutions at each site. Written consent was obtained from all participants.


