


INTRODUCTION
Dengue is the most common arthropod-borne viral (arboviral) disease worldwide and is caused by one of four serotypes of dengue virus (DENV-1 to DENV-4) that are transmitted by mosquitoes of the genus Aedes. Dengue infections can be asymptomatic, lead to a flu-like illness called dengue fever or progress to a more severe condition known as severe dengue (SD) or dengue haemorrhagic fever (DHF), characterised by haemorrhage, difficulty in breathing, organ impairment or increased vascular permeability, which can lead to hypotension and shock [1]. Within the last decade, the incidence of clinically apparent dengue cases has dramatically increased, with about half of the world's population now at risk of infection [1]. In 2010, there were approximately 390 million infections worldwide, 96 million of which were symptomatic. Seventy per cent of symptomatic infections occurred in Asia (34% of the global total in India alone), 16% in Africa and 14% in the Americas, of which Brazil and Mexico bore over 50% of cases in the region [Reference Bhatt2].
In 2015, ~80 million new dengue cases occurred worldwide [3], with 18 400 deaths attributed to the disease [4], and Brazil registering an astonishing record of 1·65 million dengue cases alone [5]. Moreover, the emergence of Zika virus (ZIKV) in the Americas in 2015, and its rapid spread in 2016, renewed the interest in dengue virus, given their phylogenetic proximity and shared mosquito vector species: Aedes aegypti and Aedes albopictus, also known as the yellow fever mosquito and Asian tiger mosquito, respectively [Reference Ikejezie6].
Dengue caused approximately 1·89 million disability-adjusted life years (DALYs) in 2015 [7] and from a societal perspective, poses a substantial economic burden that is estimated at US$ 468 million in Brazil [Reference Martelli8]. While the disease affects all age groups, the morbidity and mortality are higher among children under the age of 15 in Southeast Asia and the northern part of Latin America [Reference San Martín9, Reference Halstead10]. In central and southern South America, severe cases occur primarily in adults, though, the proportion of individuals under the age of 10 affected by SD significantly increased in the last decade [Reference San Martín9, Reference Teixeira11, Reference Burattini12].
All four virus serotypes are now circulating in the Americas, Africa and Asia [Reference Guzmán13]. While infection with one dengue virus serotype results in lifelong type-specific immunity, secondary infection with a different serotype frequently progresses to more severe disease [Reference Alvarez14]. The circulation of the DENV-2 serotype was especially found to be associated with greater mortality [Reference Díaz-Quijano and Waldman15]. In contrast, tertiary dengue infections rarely cause SD [Reference Alvarez14]. To date, there is no specific treatment for dengue. The first dengue vaccine, tetravalent live-attenuated Dengvaxia (CYD-TDV) by Sanofi-Pasteur, was registered in Mexico in December 2015 and later approved by the Philippines, Brazil, El Salvador, Costa Rica, Paraguay, Guatemala, Peru, Indonesia, Thailand and Singapore [16]. However, the WHO only recommends its use in high-endemic areas for individuals that are at least 9 years of age, since it probably increases the severity of the first natural dengue infection in seronegative recipients [17]. Several other vaccine candidates are currently in clinical development [Reference Vannice, Durbin and Hombach18].
In Brazil, about 5 million cases were reported from 2001 to 2011 [Reference Paixão19] – and an active surveillance cohort study to access the efficacy of a new vaccine estimated that the true number of cases might be ten times higher [Reference Sarti20]. The number of dengue epidemics in this country is rising, with a dramatic increase in the number of dengue-related hospitalisations and deaths since 1995 [Reference Díaz-Quijano and Waldman15]. Between 2000 and 2011, the dengue mortality rate increased 39-fold, and the risk of dying from SD rose from 3·5% to 11·8% [Reference Paixão19]. The higher severity of dengue infections was a trend observed in all regions of the country and across all age groups [Reference Paixão19]. However, the disease affected predominantly young adults until 2005, whereas a higher proportion of children were affected by the severe form in recent years [Reference Teixeira11]. It has been reported that among those under 15 years of age, the highest risk of dying from dengue in Brazil in 2010 was among babies within their first year of life, with case fatality rates increasing from 0% in 2001 to 25% in 2005 [Reference Paixão19].
It is well established that dengue epidemics worldwide show a strong seasonality and are correlated with higher temperatures, precipitation and relative humidity, leading to increased abundance and activity of mosquitoes [Reference Naish21]. For disease transmission to occur, standing water is required for mosquito breeding. Furthermore, high temperatures are necessary for rapid larvae development and virus replication, as well as a mosquito lifespan that is long enough to become infectious [Reference Naish21]. It has been proposed that the rapid global expansion of the vector has been favoured by international trade and travel, an increase in temperature and rainfall in certain regions and urbanisation, which may have increased the prevalence of mosquito breeding sites as well as the survival and reproduction of mosquitoes [Reference Bhatt2]. For example, water accumulated in used tires and plastic vessels or stored in large containers close to homes in urban areas is a perfect habitat for the larvae of the insect vector [1]. Socioeconomic factors also play a role because of inadequate infrastructure and insufficient resources to prevent or manage dengue infections in impoverished areas [Reference Chang22].
Although dengue cases are reported throughout the year in Brazil, there is a seasonal pattern of outbreaks and hospitalisations, which peak during the season from January to June, characterised by higher rainfall and temperatures [Reference Teixeira11]. Brazil provides a unique context to examine the spatial and seasonal patterns of dengue cases due to its large size, socioeconomically diverse population and heterogeneous climate. In this study, we analysed the seasonal patterns of the incidence of dengue hospitalisations across the different states of Brazil (as an estimate of the occurrence of SD in the country), while taking age groups as well as particular characteristics of epidemic events in each state into account. We thereby discovered a new spatial pattern of dengue that may be of relevance for public health preparedness and policies.
METHODS
Data
We used the public database of hospital stays of the Brazilian Unified Health System (Sistema Único de Saúde, SUS) for the period from 1998 to 2015 [23]. This database captures the records of all hospitalisations paid by the public system in Brazil for public hospitals at the federal, state and municipal levels as well as private and non-profit hospitals under contract with the SUS [Reference Coelho24]. For each case, we used information on the primary or secondary cause of hospitalisation, age, municipality of residence, dates of admission and location. Consultations and treatments in other settings (e.g. health clinics, medical offices and emergency wards) were not included. All cases of dengue were retrieved from the database by searching for the ICD-10 codes A90 and A91. The records that fulfilled the criteria were aggregated and organised in a 3D (three-dimensional) matrix with the following dimensions: time (in months), spatial location (Brazilian state, Fig. 1) and age (groups as listed in Fig. 2c and 3; Supplementary Fig. S1).
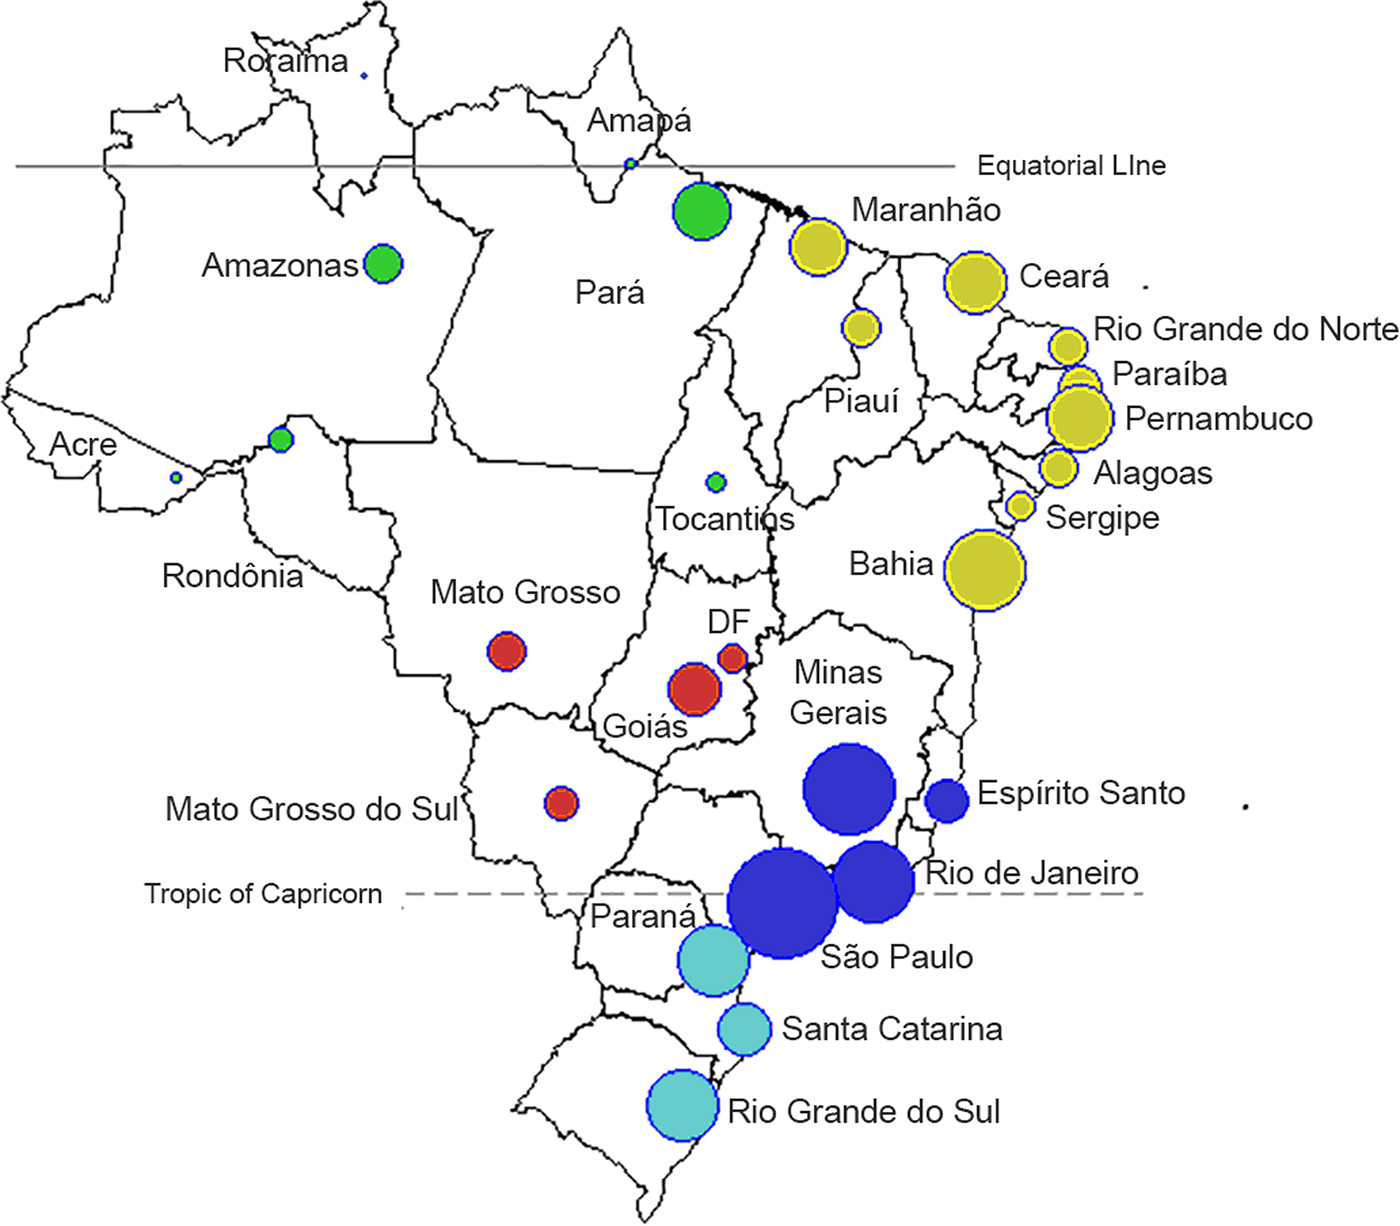
Fig. 1. Map of 26 administrative states and the Capital District (Distrito Federal, ‘DF’). Each state is represented by a circle, where the size of the symbol is proportional to the population of each state (log10 scale). The colours refer to the five Brazilian administrative regions: North (green), Northeast (yellow), Southeast (dark blue), South (light blue) and Central-West (red).
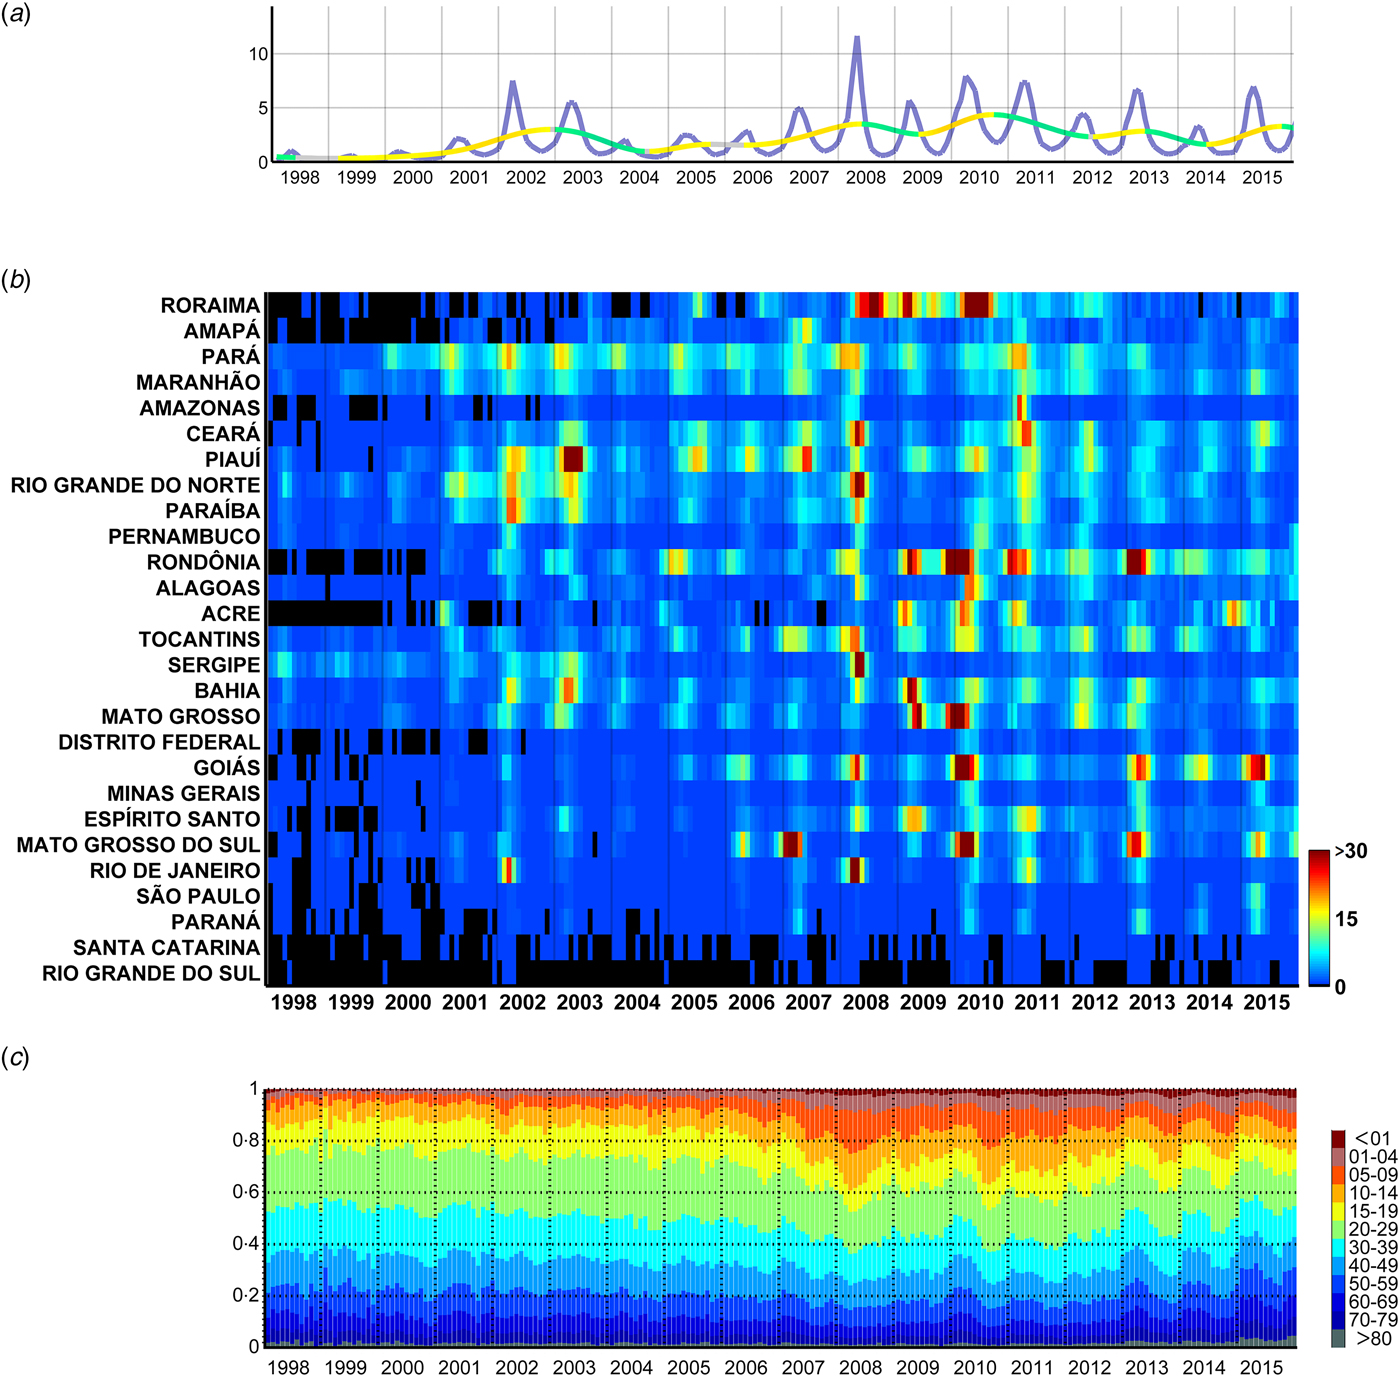
Fig. 2. Monthly dengue hospitalisations in Brazil between 1998 and 2015. (a) Monthly incidence of hospitalisations (per 100 000 people) attributed to dengue in Brazil (purple line) and moving trend (warmer and colder colours highlight the rate of increase and decrease, respectively). (b) Monthly incidence per state per 100 000 people, sorted by the latitude of their capitals. (c) Proportion of hospitalisations per age group.

Fig. 3. Primary peaks of dengue hospitalisations in different states of Brazil. The primary peak time of dengue hospitalisations was colour-coded by month (see key of colours at the bottom right) and each state is represented by a circle in the corresponding colour at the location of its capital.
In order to obtain a matrix of incidence rates, we divided the matrix above by the population of Brazil [25] and multiplied these values by 100 000. The population matrix was structurally identical to the hospitalisation-related counterpart and was obtained through a process of temporal interpolation of data for each age group and state from the Brazilian decadal censuses (Alonso et al., in press).
Data on mean monthly vapour pressure, temperature, number of wet days and precipitation for the years 2001 to 2014 and with a spatial resolution of 0·5° were obtained from the monthly global datasets CRU CY vs. 323 from the Climatic Research Unit of the University of East Anglia (http://badc.nerc.ac.uk/data/cru [Reference Harris26]).
Data analyses
Visual inspection of the dengue hospitalisations dataset was performed with regard to the relative contribution of each age group to the total number of hospitalisations per month (Fig. 2a ), the monthly incidence per month and state (Fig. 2b ) and the cubic spline model of the average monthly values of each year in order to detect relevant inter-annual periods of increase or decrease in hospitalisations (Fig. 2c ).
We also used Fourier analyses to characterise the seasonal patterns of dengue hospitalisation per state. With this frequency-domain method, the periodic variability of the detrended monthly time series is partitioned into harmonic functions. Through summation of these harmonics, we obtained a model of the Periodic Annual Function (PAF) that can be considered an average seasonal signature of the original series, in which year-to-year variations are removed but seasonal variations within the year are preserved [Reference Rogers, Hay and Packer27, Reference Alonso and McCormick28]. Once the PAF was calculated, we obtained the relative amplitudes and timing of the ‘primary’ (or ‘major’) peak of hospitalisations. The relative amplitudes of the peak were calculated by dividing the wave height (the difference between the maximum and minimum values) by the absolute value of the peak of the PAF. Once the geographical pattern of primary peaks was detected (see Results section), we compared it with the primary peaks of each climatic variable, using the same technique as described above. Due to the problems caused by multicollinearity among climatic variables when trying to discern causality in epidemiology [Reference Alonso, McCormick and Schuck-Paim29], we kept our analyses at an exploratory level and looked for variables that had a spatial seasonality pattern similar to that of dengue epidemics.
Software
Data extraction was conducted using scripts written in Matlab R2007 (MathWorks © ). Microsoft © Excel programs were used to archive data once they were aggregated from the original source. Popweaver was used to interpolate census population tables [Reference Alonso, López and Schuck-Paim30]. Data analyses were performed and figures generated using the freely available software Epipoi [Reference Alonso and McCormick28].
Reproducibility of analyses
To allow for inspection and reproducibility of the analyses performed here and for further inspections and analyses, the extracted data is available at this repository: http://www.epipoi.info/dengueBr/. Please cite relevant original sources [23, 25, Reference Harris26] if used for publication.
RESULTS
There has been an overall upward trend in the hospitalisation rate per month and per 100 000 inhabitants attributed to dengue during the period from 1998 to 2015 in Brazil (Fig. 2a ). Between 1998 and 2000, monthly hospitalisations rates were below 1 and increased to values of ~5–7 during the summers of 2002 and 2003. This was followed by lower rates of ~2 in 2004, after which the rates resumed their upward trend and reached values of ~12 in 2008 and ~8 in 2010. In more recent years of this series, the monthly rates of hospitalisations went down to the levels of 2002/2003. The described effect is, however, geographically highly heterogeneous (Fig. 2b ). For instance, dengue hospitalisation numbers had remained relatively low in Santa Catarina and Rio Grande do Sul until 2006. 2008 stands out as the year with the most hospitalisations due to severe outbreaks in the states of Rio de Janeiro, Roraima, Pará, Tocantins, Ceará, Rio Grande do Norte, Sergipe and Paraíba. Some states, however, had a strong epidemic in 2007 instead of 2008 (e.g. Amapá, Piauí and Mato Grosso do Sul). Also, while some states (Espírito Santo, Acre and Bahia) experienced a series of subsequent epidemic years after 2008, there was a gap in 2009 in others (Rio de Janeiro, Rio Grande do Norte, Goiás, Ceará, Paraíba, Pernambuco, Alagoas, Amazonas). Rondônia, Mato Grosso and Mato Grosso do Sul had strong peaks in the summer of 2010, and again in 2013. Goiás (and with less intensity the Federal District, which is landlocked by Goiás) had important consecutive epidemics in the summers of 2013, 2014 and 2015 subsequent to the strongest in 2010.
The age distribution of the incidence of dengue hospitalisations also changed over time (Fig. 2c and Supplementary Fig. S1). Until 2005, children between 0 and 9 years of age represented only ~7% of dengue hospitalisations, but this proportion increased rapidly in the following years with the largest yearly average in 2008 (22%; monthly average for April 2008: 25%). When inspecting the series of monthly hospitalisations in each state, we noticed that a higher proportion of younger individuals were hospitalised due to dengue precisely at times of large outbreaks (especially in 2008 and 2010).
Despite strong inter-year variations, dengue hospitalisations have a marked seasonality both at the national (Fig. 2a ) and state level (Fig. 2b ). Apart from Roraima, all states had their main peak in the first half of the year, mainly around March and April (Fig. 3 and Table 1). These months correspond to the end of summer/beginning of autumn for the states that are more distant from the equator, and to the rainy season for the states closer to the equator.
We then examined whether there was a spatial pattern of the times of the year at which the primary peak of hospitalisations due to dengue occurred in the different states (Fig. 3). As opposed to the analyses based on latitudes of the states (Table 1; Supplementary Fig. S2a), the analyses based on longitudes of the states (Fig. 4; Supplementary Fig. S2b) showed a clear gradient (linear regression: F 1,25 = 56·6, P < 0·0001; r 2 adj = 69% with all states but Roraima, the only one in the northern hemisphere). Peak hospitalisation numbers were observed early in the year (in January/February) in the West of Brazil, and moved progressively to the month of May in eastern parts of the country. The state Roraima in the northern hemisphere is the only exception to this trend, as detailed in Supplementary Figs. S2 and S3.

Fig. 4. Months of the primary peak in dengue hospitalisations and climatic variables in the Brazilian states plotted against the longitude of the capitals of those states.
Table 1. Main trends and seasonal components of dengue in Brazil. Time series (1998–2015) of monthly hospitalisations due to dengue in Brazilian states sorted by the latitude of their capitals
The timing of the peaks of climatic variables shows spatial patterns, as shown in the maps in Supplementary Fig. S4. However, not all of these patterns were clearly associated with that of the number of dengue hospitalisations when the months of the primary peaks were plotted against the longitude of the states (Fig. 4, Supplementary Fig. S5). The total monthly precipitation is highest around the turn of year (i.e. beginning of summer) for most of the states in the South, Southeast and Central-West, and during the first half of the year for the equatorial regions (Supplementary Figs. S4a and S5a). Average temperatures peak during summer (especially in February) in the nine southernmost states, and in the last three months of the year in the Central-West, North and (a bit later) Northeast (Supplementary Figs. S4b and S5b). Apart from the three eastern Amazonian states, where vapour pressure peaks at the end of the year (Supplementary Figs. S4c and S5c), this variable is highest in the summer months of February and March in most states, and one month later in the easternmost states of the Northeast of Brazil as well as in Pará and Amapá in the North region. The greatest number of rainy days is observed between December and February in most states, while some equatorial states have more wet days between April and May (Supplementary Figs. S4d and S5d). When the months of the primary peaks of dengue hospitalisations and of climatic variables in the Brazilian states are plotted against the longitude of these states (Fig. 4), the primary peaks of dengue hospitalisations and of those of mean vapour pressure differ by approximately 1 month (0·7 ± 0·9 (mean ± standard deviation)) for most states with the exceptions of the western Amazonian states Acre, Amazonas and Roraima, where the primary peaks of dengue hospitalisations coincide mostly with those of total precipitation.
DISCUSSION
Here we describe for the first time that the seasonality of dengue hospitalisations has a clear West–East gradient in Brazil, characterised by the progression of primary hospitalisation peaks from West to East during the first half of the year (Fig. 3, Supplementary Fig. S2b), which may be associated with vapour pressure and rainfall patterns (Fig. 4). There was a high coincidence between the annual peak of vapour pressure and the peak of dengue hospitalisations in most states. Interestingly, a study in northwestern Argentina showed that vapour pressure had the highest overlap in timing with A. aegypti oviposition [Reference Estallo31].
In some of the northern states within the Amazon area, dengue hospitalisation peaks did not overlap with vapour pressure peaks, but with total precipitation peaks instead (Supplementary Figs. S2b and S5). Precipitation in the Northeast region peaks 1 month later than the North region (March/April instead of February/March), and the dengue season also occurs a bit later (between April and May instead of February and April). Roraima is the only Brazilian state in which dengue hospitalisations peak in the second half of the year and also the only state apart from Amapá that is mainly located north of the equator (Fig. 1 and 3). Here, the humidity and total monthly precipitation are highest in June (as opposed to April for Amapá), with the number of dengue hospitalisations peaking in July (Fig. 3, Supplementary Figs. S2 and S5a).
There was an overall increase in the monthly hospitalisation rate caused by dengue between 1998 and 2015, along with an increment in the proportion of children hospitalised, thus confirming the findings by Teixeira et al. [Reference Teixeira11]. Paixão et al. [Reference Paixão19] described a similar change in the age distribution of patients that died from SD. Burattini et al. [Reference Burattini12] analysed data on dengue cases reported to the Brazilian Ministry of Health between 2000 and 2014 and also found an overall increase in the number of cases, with complicated forms occurring more frequently among individuals under the age of 10. These findings support the validity of the use of hospitalisation data for the analysis of dengue [Reference Coelho24].
Interestingly, the number of dengue cases was much higher in 2013 compared to 2008 according to a recent study [Reference Burattini12], whereas there were fewer hospitalisations in 2013 than in 2008 (Fig. 2a ). This may be due to the fact that the more virulent serotypes DENV-2 and DENV-3 were most prevalent in 2008, while DENV-1 and DENV-4 were the predominant serotypes in 2013 and are associated with a lower risk of hospitalisation [Reference Burattini12]. So even though there were more dengue cases in the last few years, the severity of the disease seems to be lower compared to the outbreak in 2008.
After dengue virus was absent in Brazil for over 20 years (except for an epidemic caused by DENV-1 and DENV-4 in Roraima in 1981 and sporadic cases), DENV-1 was reintroduced into Brazil in 1986 [Reference Schatzmayr and Nogueira32]. It spread throughout the country by 1995 due to the nationwide dispersion of the vector A. aegypti and was the predominant serotype until 2002 [Reference Teixeira11]. DENV-2 was reintroduced in 1990 and DENV-3 in 2000 [Reference Barreto and Teixeira33, Reference Nogueira34]. DENV-2 has been associated with significantly increased mortality and case fatality rates [Reference Díaz-Quijano and Waldman15], and was the most prevalent serotype during the large outbreaks in 2007/2008 [Reference Burattini12]. The DENV-2 lineage that circulated in Brazil from 2007 to 2010 (lineage II) was different from lineage I, which was detected from 1990 to 2003. Both lineages belong to the Southeast Asian genotype and may be the result of an introduction of new viral lineages from the Caribbean [Reference Faria35]. DENV-4 re-emerged in 2010 and seems to originate from Southeast Asia [Reference Nunes36]. All four serotypes (now including DENV-4) have been identified during the outbreaks in 2010 [Reference Burattini12].
The overall increase in the proportion of children among hospitalised individuals within the last decade has been associated with an accumulation of multitypic immunity in adults during the 30 years after the re-emergence of dengue virus in 1986. Assuming that monotypically exposed individuals have the highest risk of developing SD, the higher probability for children to be susceptible or monotypically immune may have led to more severe infections among this age group [Reference Rodríguez-Barraquer37]. Similarly, in Mexico, Honduras and Venezuela, where DENV circulates since the 1970s, most severe cases were observed among children under the age of 15 [Reference San Martín9].
A recent study by Bardina et al. [Reference Bardina38]. suggests that prior infection with dengue may exacerbate the clinical symptoms caused by Zika infection and that antibodies produced in response to dengue infection may facilitate host cell entry and replication of the closely related ZIKV during a subsequent infection [Reference Bardina38]. The authors argue that this could explain the higher rates of Zika-related birth defect microcephaly in areas of Brazil in which dengue is common. However, microcephaly cases are concentrated in the Northeast of the country and both DENV and ZIKV circulate throughout Brazil apart from the southernmost states [Reference Bhatt2, Reference Ikejezie6]. Instead, more severe outcomes of Zika virus disease may be due to the fact that the Northeast is the poorest region of Brazil, where the highest frequency of DHF among the clinical forms of dengue and the highest hospitalisation risk due to dengue have also been reported, possibly due to malnutrition, poor housing conditions, public services and public health structure [Reference Burattini12].
A novel contribution of this study is that the proportion of hospitalised children was especially high during the strong outbreaks in 2007/2008 and 2010 (Fig. 2a and c ). These abrupt changes in age distribution cannot be explained by the accumulation of multitypic immunity in adults and are temporally associated with the emergence and spread of the more aggressive viral lineage II, which belongs to the DENV-2 Southeast Asian genotype [Reference Faria35]. The higher severity of the outbreaks mentioned above could be due to a higher replication rate of this genotype, leading to higher viraemia among infected individuals, which would cause an increased incidence of severe disease and a higher probability of transmission, facilitating the spread of the virus within the population. The higher proportion of children affected may be explained by a more severe hypovolaemic shock upon secondary dengue infection due to a greater baseline microvascular permeability in this age group [Reference Gamble39]. Furthermore, large outbreaks may have led to an increased awareness of the severity of the disease among parents and paediatricians, resulting in an increment in hospital admissions of dengue cases.
A result that is quite puzzling is the great diversity among the Brazilian states regarding the number of dengue hospitalisations during the study period. Large secondary outbreaks occurred in the years following an initial epidemic in some geographic regions and much later in others (Fig. 2b ). Whether this is due to differences in the distribution of different virus subtypes in the country, regional variations in the density of vector populations, regional policies or particular climatic anomalies remains an open question.
Current interventions to stop dengue transmission focus on vector control, including the reduction of standing water as well as the use of insecticides and window screens [1]. However, these efforts did not prevent the increasing number of dengue epidemics. To address the global spread of dengue, an interdisciplinary approach is necessary. That should include an improvement of domestic infrastructure and access to health care, integrated vector management (IVM) for a more efficient, cost-effective and sustainable control of mosquitoes, community empowerment through educational programmes, continued support from local governments, international cooperation for the control of vector transmission across borders, and vaccine development [1, Reference Chang22]. Moreover, awareness of paediatricians and other clinicians that prompts dengue suspicion, diagnosis and adequate supportive care is essential, especially in areas that have not experienced dengue outbreaks for extended periods of time.
SUPPLEMENTARY MATERIAL
The supplementary material for this article can be found at https://doi.org/10.1017/S0950268817002801
ACKNOWLEDGEMENTS
The authors are grateful to the Department of Vital Statistics, a branch of the Brazilian Ministry of Health, for providing the data on hospitalisations, and to the Climate Research Unit of the University of East Anglia for the climatological dataset. We thank the two anonymous referees for their valuable suggestions on our manuscript.
DECLARATION OF INTEREST
None.


