


Introduction
Avena sativa, or common oat, is an important break crop for the Irish arable sector. Of the 261 k hectares (ha) devoted to cereal production in 2018, 18 kha were utilized for the cultivation of oats (Anon, 2019), primarily for the horse feed and milling industries. The cool, moist and bright maritime summer climate of Ireland leads to high yield potential in cereal crops (Kennedy et al., Reference Kennedy, Bingham and Spink2017), while consistent summer rainfall allows for high levels of grain fill with low levels of plant stress. The relatively mild, temperate winter climate allows Irish producers to plant spring oat genotypes in the autumn/winter due to the relatively low number of frost days enabling the production of high yield potential crops (Marshall et al., Reference Marshall, Cowan, Edwards, Griffiths, Howarth, Langdon and White2013).
Approximately a quarter of the Irish oat crop is utilized by the milling industry to enter the high value human consumption market. There has been an increased interest in the inclusion of oat grain in human diets globally due to health benefits (Marshall et al., Reference Marshall, Cowan, Edwards, Griffiths, Howarth, Langdon and White2013; Rasane et al., Reference Rasane, Jha, Kumar and Unnikrishann2015), with a niche market recently developing in Ireland targeting the production of oat grain suitable for inclusion in celiac diets. The global area dedicated to oat production is in continual decline (FAOSTATS, 2019) but with the area dedicated to oat production in Ireland stable. There is an opportunity for Irish oat producers to target high value niche markets as they continue to develop into the future.
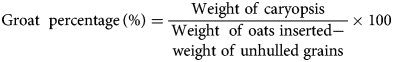
Oats produced for the high value milling market must have acceptable test weight (>52 kg/hl), have low levels of screenings (<8%) and pass a specific inspection of colour, contamination and general condition (Burke et al., Reference Burke, Browne and White2001; Doehlert, Reference Doehlert2002). Where the desired market is for inclusion in celiac diets, the cultivation, handling and processing of the oat grain must be in the absence of other cereals. Test weight has been widely shown to be a poor determination of kernel yield (Meyer and Zwingelberg, Reference Meyer and Zwingelberg1981; McGarel and White, Reference McGarel and White1997) yet is still the most widely quoted parameter in the purchase and trading of oat grain. The valuable proportion of oat grain is the caryopsis which typically accounts for 65–80% of grain weight. The remainder is accounted for by the husk which consists of the lemma and the palea which make up approximately 25% of grain weight (Browne et al., Reference Browne, White and Burke2002) and is of no nutritional value to non-ruminants (Stuthmann and Granger, Reference Stuthmann and Granger1977). It is now widely agreed that the kernel content of oat is the most accurate determination of final kernel yield (Doehlert et al., Reference Doehlert, Ohm, McMullen and Riveland2009). This is the proportion of the weight of the oat sample accounted for by the caryopsis. The lemma and the palea tightly enclose the caryopsis, with the efficiency of the oat milling process also affected by the rate at which the caryopsis will come free from the husk during the dehulling process. The ease at which an oat sample will dehull efficiently is referred to as its hullability (Browne et al., Reference Browne, White and Burke2002).
The factors influencing test weight are well understood, with applied N rate and cultivar choice of key importance (Chalmers et al., Reference Chalmers, Dyer and Sylevester-Bradley1998; Doehlert et al., Reference Doehlert, McMullen and Hammond2001; Browne et al., Reference Browne, White and Burke2003; White et al., Reference White, Mc Garel and Ruddle2003; Finnan et al., Reference Finnan, Burke and Spink2019a), but its use as a predictor of kernel content and milling yield requires further investigation. Doehlert et al. (Reference Doehlert, Ohm, McMullen and Riveland2009) reported that test weight and kernel content are linked through kernel density, with the differences in packing proportion leading to the weakness of the test weight in predicting kernel content. This relationship was evaluated as part of this study. The factors influencing kernel size, hullability and kernel content are not well understood and are rarely reported on in the literature. White and Watson (Reference White and Watson2010) reported a key relationship between kernel size and hulling efficiency when comparing cultivars. Browne et al. (Reference Browne, White and Burke2003) reported that the agronomic effects of seed rate, applied N rate and the application of plant growth regulator on milling quality parameters were small when compared to cultivar effects under Irish conditions. LaFond et al. (Reference Lafond, May and Holzapfel2013) reported kernel content was the only parameter which was not impacted by increased applied N rate under dryland Australian conditions while Yan et al. (Reference Yan, Fregeau-Reid, Ma, Pageau and Vera2017) commented that applied N rate and cultivar selection were complementary in the production of high-quality oats under Canadian conditions, increasing both hullability and kernel content. Zhou et al. (Reference Zhou, Robards, Roberts, Glennie-Holmes and Helliwell1998) observed an increase in kernel content in response to increased seed rate and reported no effect of applied N rate. Oats have a nutritionally superior amino acid composition than wheat, barley and rye and contain a higher level of essential amino acids (Yeoh and Watson, Reference Yeoh and Watson1981). The factors affecting grain protein content in oat genotypes under Irish conditions are unclear and poorly reported in the literature. Identifying the factors which affect total grain protein under Irish climatic conditions was another target of this research.
Establishing the response of modern oat cultivars to agronomic factors is therefore the key objective of the current study due to the climate-specific variation reported in the literature for these parameters. Unravelling the interdependencies between grain quality traits forms an interesting secondary objective.
Materials and methods
This research was conducted at experimental sites in the east of Ireland from 2016 to 2019. ‘Spring-sown’ oat crops were sown at two sites in 2016 and at one site in 2017 and 2018, with ‘Winter-sown’ crops at a single site in 2017, 2018 and 2019 (Table 1). Therefore, comparisons between sites also involve different growing seasons and while the term ‘site’ is used through this document, the growing season aspect is recognized as being an important element within this. All sites had been in long term continuous arable cropping for >20 years and are regarded as optimal soil types to produce oats. Soils with high mineralization of N were avoided based on cropping history based on the soil index system developed by Wall and Plunkett (Reference Wall and Plunkett2016) with soil fertility information also presented in Table 1. Meteorological data including monthly precipitation and mean daily temperatures were obtained from Met Eireann (2020, www.met.ie). Rainfall and temperature data were sourced from locations <5 km from the growing crops.
Table 1. Experimental site description
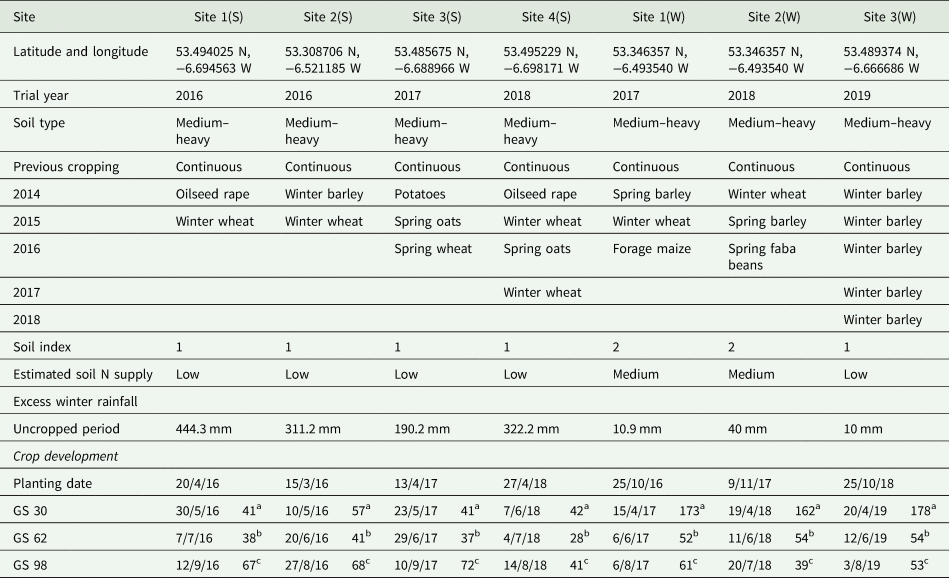
a Time in days from planting to GS30.
b Time in days from GS30 to GS62.
c Time in days from GS62 to GS98.
Experimental design
Trial areas were selected in fields destined for commercial oat production at each location. Experiments were laid out in a factorial arrangement within a randomized complete block comprising three replications in both 2016 spring sowings and the 2017 winter sowing, with all other experiments in 2017, 2018 and 2019 having four replications. The plots were 15 m long with a 1 m discard to avoid fertilizer overlap.
Crop husbandry
Seedbeds were prepared using a reversible mouldboard plough to a depth of approximately 25 cm and a tilth was created using a power harrow at all locations. Seed was weighed out to target plant populations (250, 350 and 450 seeds/m2) according to expected germination levels and thousand grain weight (TGW). All trials were planted using a 1.5 m Wintersteiger XL plot drill (Wintersteiger AG, Austria) equipped with Lemken double-disk seed coulters (Lemken GmbH, Alpen, Germany) with a row spacing of 150 mm. All plots were sown using certified seed with each cultivar lot originating from the same source each season. The cultivars selected (Husky and Keely) are widely grown under Irish conditions with suitable agronomic characteristics for intensive input production systems.
In-field assessments and operations
All spring-sown crops received 40 kg N/ha, 25 kg P2O5/ha and 60 kg K2O in a pre-planting compound blend. Winter-sown crops received 50 kg N/ha, 25 kg P/ha and 60 kg K/ha in early spring when ground conditions facilitated fieldwork. The remaining applied N was applied at growth stage (GS) 21 (Zadoks et al., Reference Zadoks, Chang and Konzak1974) in the form of calcium ammonium nitrate (27.5% N) to bring the N allocation up to the prescribed levels of 40, 70, 100, 130, 160 and 190 kg N/ha on spring-sown crops and 80, 110, 140, 170 and 200 kg N/ha on winter-sown crops. These high N rates were chosen in order to investigate trends and ultimately test cultivar resilience beyond common practice.
Plant growth regulation was based around the use of Chlormeqaut chloride (CCC) and Trinexapac-ethyl (TE) during early stem elongation. Spring-sown crops were treated with CCC + TE at 1.2 + 0.1 L/ha at GS 30 (Zadoks et al., Reference Zadoks, Chang and Konzak1974) and GS 32/33 at all sites using an Azo plot sprayer. Spring-sown crops received insecticides for aphid control while application was not deemed necessary on winter-sown crops. Fungicides and herbicides were applied at recommended rates and timings to minimize yield losses to external factors.
Plot yields were measured at full maturity using a Sampo Rosenlow 2025 plot combine (Pori, Finland), with an electronic weight cell. Where lodging occurred, harvesting was in the direction of lodging at slow speed to maximize grain recovery. A 1 kg grain sample was taken from each plot to perform grain quality analysis. The weight of each plot was recorded and adjusted to 85% dry matter to determine grain yield.
A wide range of yield component measurements were also taken from these experiments and are published separately (McCabe and Burke, Reference McCabe and Burke2021).
Grain quality determination
Specific weight (kg/hl) values were determined using a calibrated condrometer. Kernel size distributions were determined by weighing out 100 g of each sample and passing it over 2.5, 2.25 and 2.0 mm slotted sieves on a Pfeuffer Sortimat (Pfeuffer Gmbh) for a period of 2 min. TGW was determined by weighing out 1000 seeds as counted by a Pfeuffer Contador (Pfeuffer Gmbh).
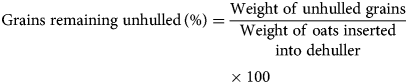
Kernel content and unhulled grain values were obtained using a Codema LH-5095 laboratory oat huller. The kernel content is expressed as the percentage of grain weight made up of the internal caryopsis. Samples for dehulling were selected from the proportion of grain which was >2.0 mm following kernel size determination. Samples were then dried to 87% DM prior to dehulling in line with recommendations in the literature. A 25 g sample was then inserted into the huller for a period of 30 s at 80 psi. Kernel content and grains remaining unhulled values were then calculated as follows. Hullability is therefore inversely presented as the percentage of grains remaining unhulled following dehulling. A high proportion of unhulled grains would indicate poorer hullability.
Grain protein levels were determined by the use of a Pertens DA 7250 NIR analyser which was calibrated using a standard determined by the Dumas method on a LECO auto analyser (LECO Corporation, St. Joseph, MI, USA) and was expressed as protein on a dry matter basis.
Statistical analyses
Experimental sites were combined for the purpose of statistical analysis, with the spring-sown data set representing four trials, with three trials reflected in the winter-sown data set. Heterogeneity of variance attributable to site effects was observed on all measured variables in these combined Spring and Winter-sown data sets. This heterogeneity of variance was handled using the GROUP = option in the analysis. A full factorial analysis was performed using the PROC MIXED procedure of SAS 9.4 (SAS Ltd) using the following model:

where Y is the observation, μ is the overall mean, O, P and Q represent all possible two, three and the four-way interaction between the agronomic variables, respectively. Site and block effects within sites were considered random in the model with all interactions between site and agronomic variables also considered random.
Due to high heterogeneity within the combined data sets, two sets of correlations and regression coefficients are presented: the combined site equations and the site-specific equations. High variation between sites led to the detection of highly significant relationships with r 2 values in a low range in the combined data sets, while site-specific equations give a reliable indicator of the relative importance of N rate. Regression coefficients are not presented for seed rate due to the relative unresponsiveness of the measured parameters. Correlation data from the combined data sets differ dramatically from the site-specific data due to substantial differences in growing conditions across the experiments contained within. These correlations are limited as they disregard the complex experimental design but nonetheless provide valuable insights into the relationships between quality parameters.
Results
Yield component data sets from these experiments including grain number, TGW and grains/panicle have previously been published (McCabe and Burke, Reference McCabe and Burke2021) and are also included in the Supplementary material attached.
Climatic conditions
Monthly rainfall and mean temperatures for the spring and winter-sown oat experiments are presented in Figs 1 and 2. Rainfall levels were not limiting at spring-sown Sites 1(S), 2(S) and 3(S) but Site 4(S) experienced moisture stress due to lack of summer precipitation in the summer of 2018. High levels of August rainfall led to significant lodging at Sites 1(S), 2(S) and 3(S). Total rainfall levels were similar between Site 1(W) and Site 2(W), but the pattern of rainfall varied greatly. Rainfall at Site 1(W) was consistent throughout the season, with a high level of precipitation recorded during the winter at Site 2(W) with very low levels recorded during the summer months (2018). Site 3(W) had consistently high rainfall levels recorded throughout the season. The influence that the dry summer exerted on experimental sites led to significant difficulties regarding heterogeneity of variance between sites.
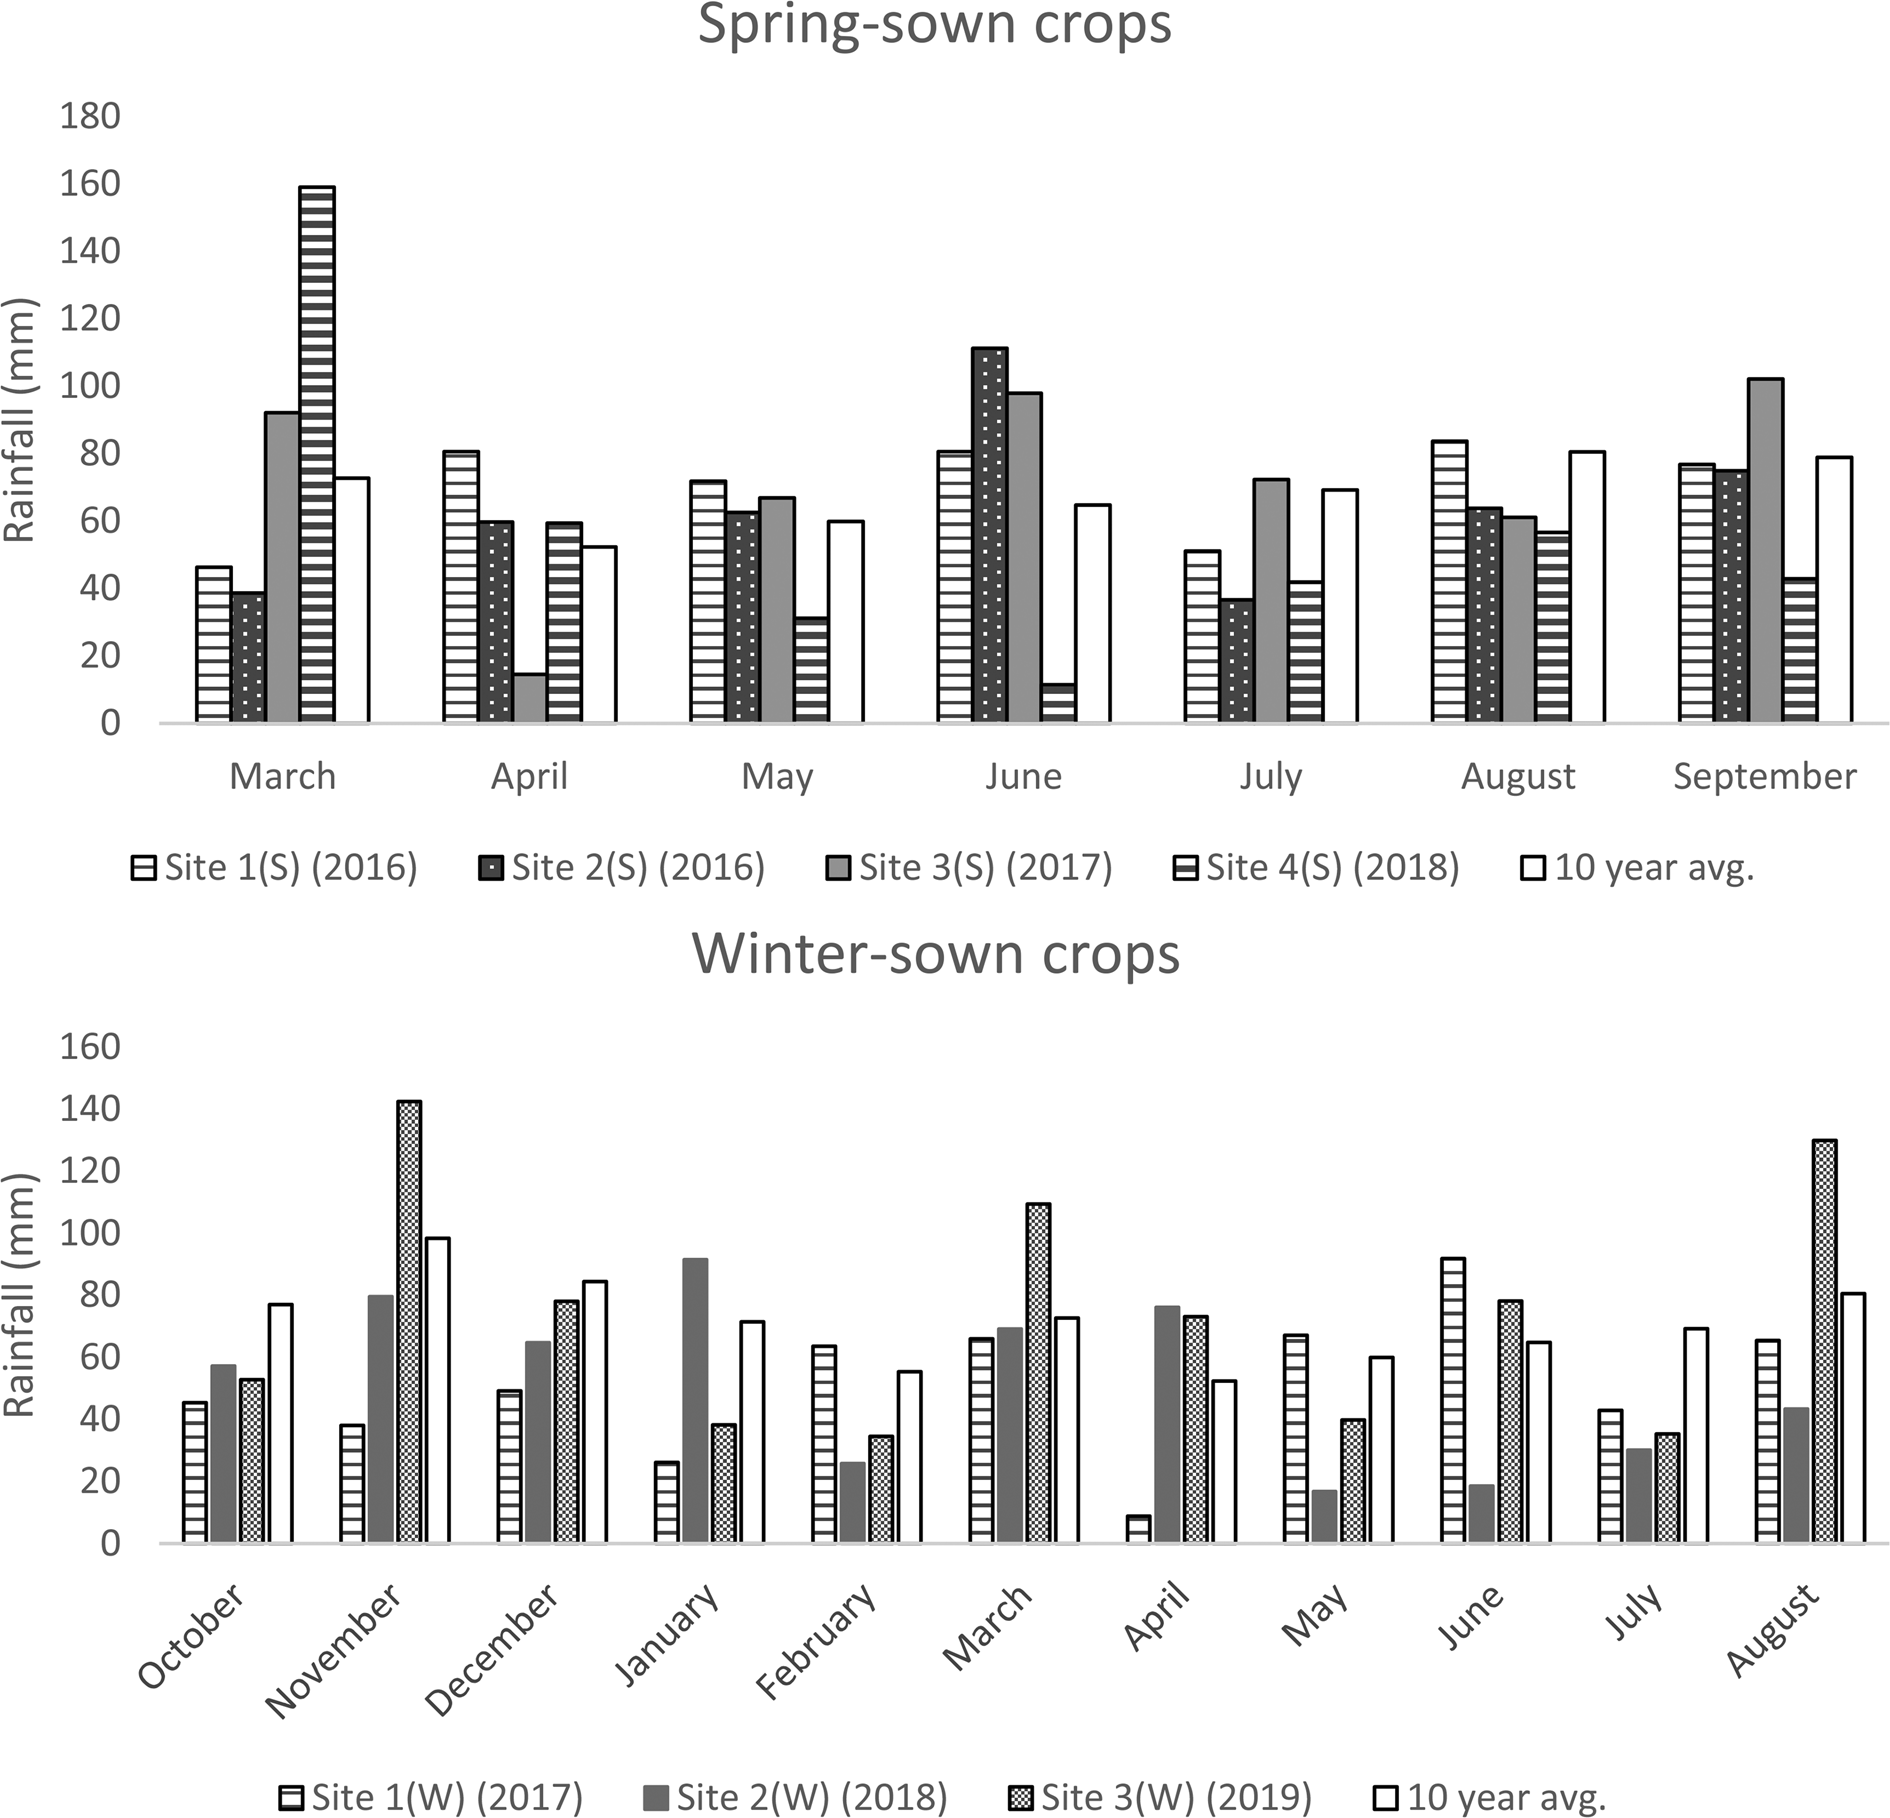
Fig. 1. Monthly total rainfall values (mm) from March to September for spring-sown and October to August for winter-sown crops.
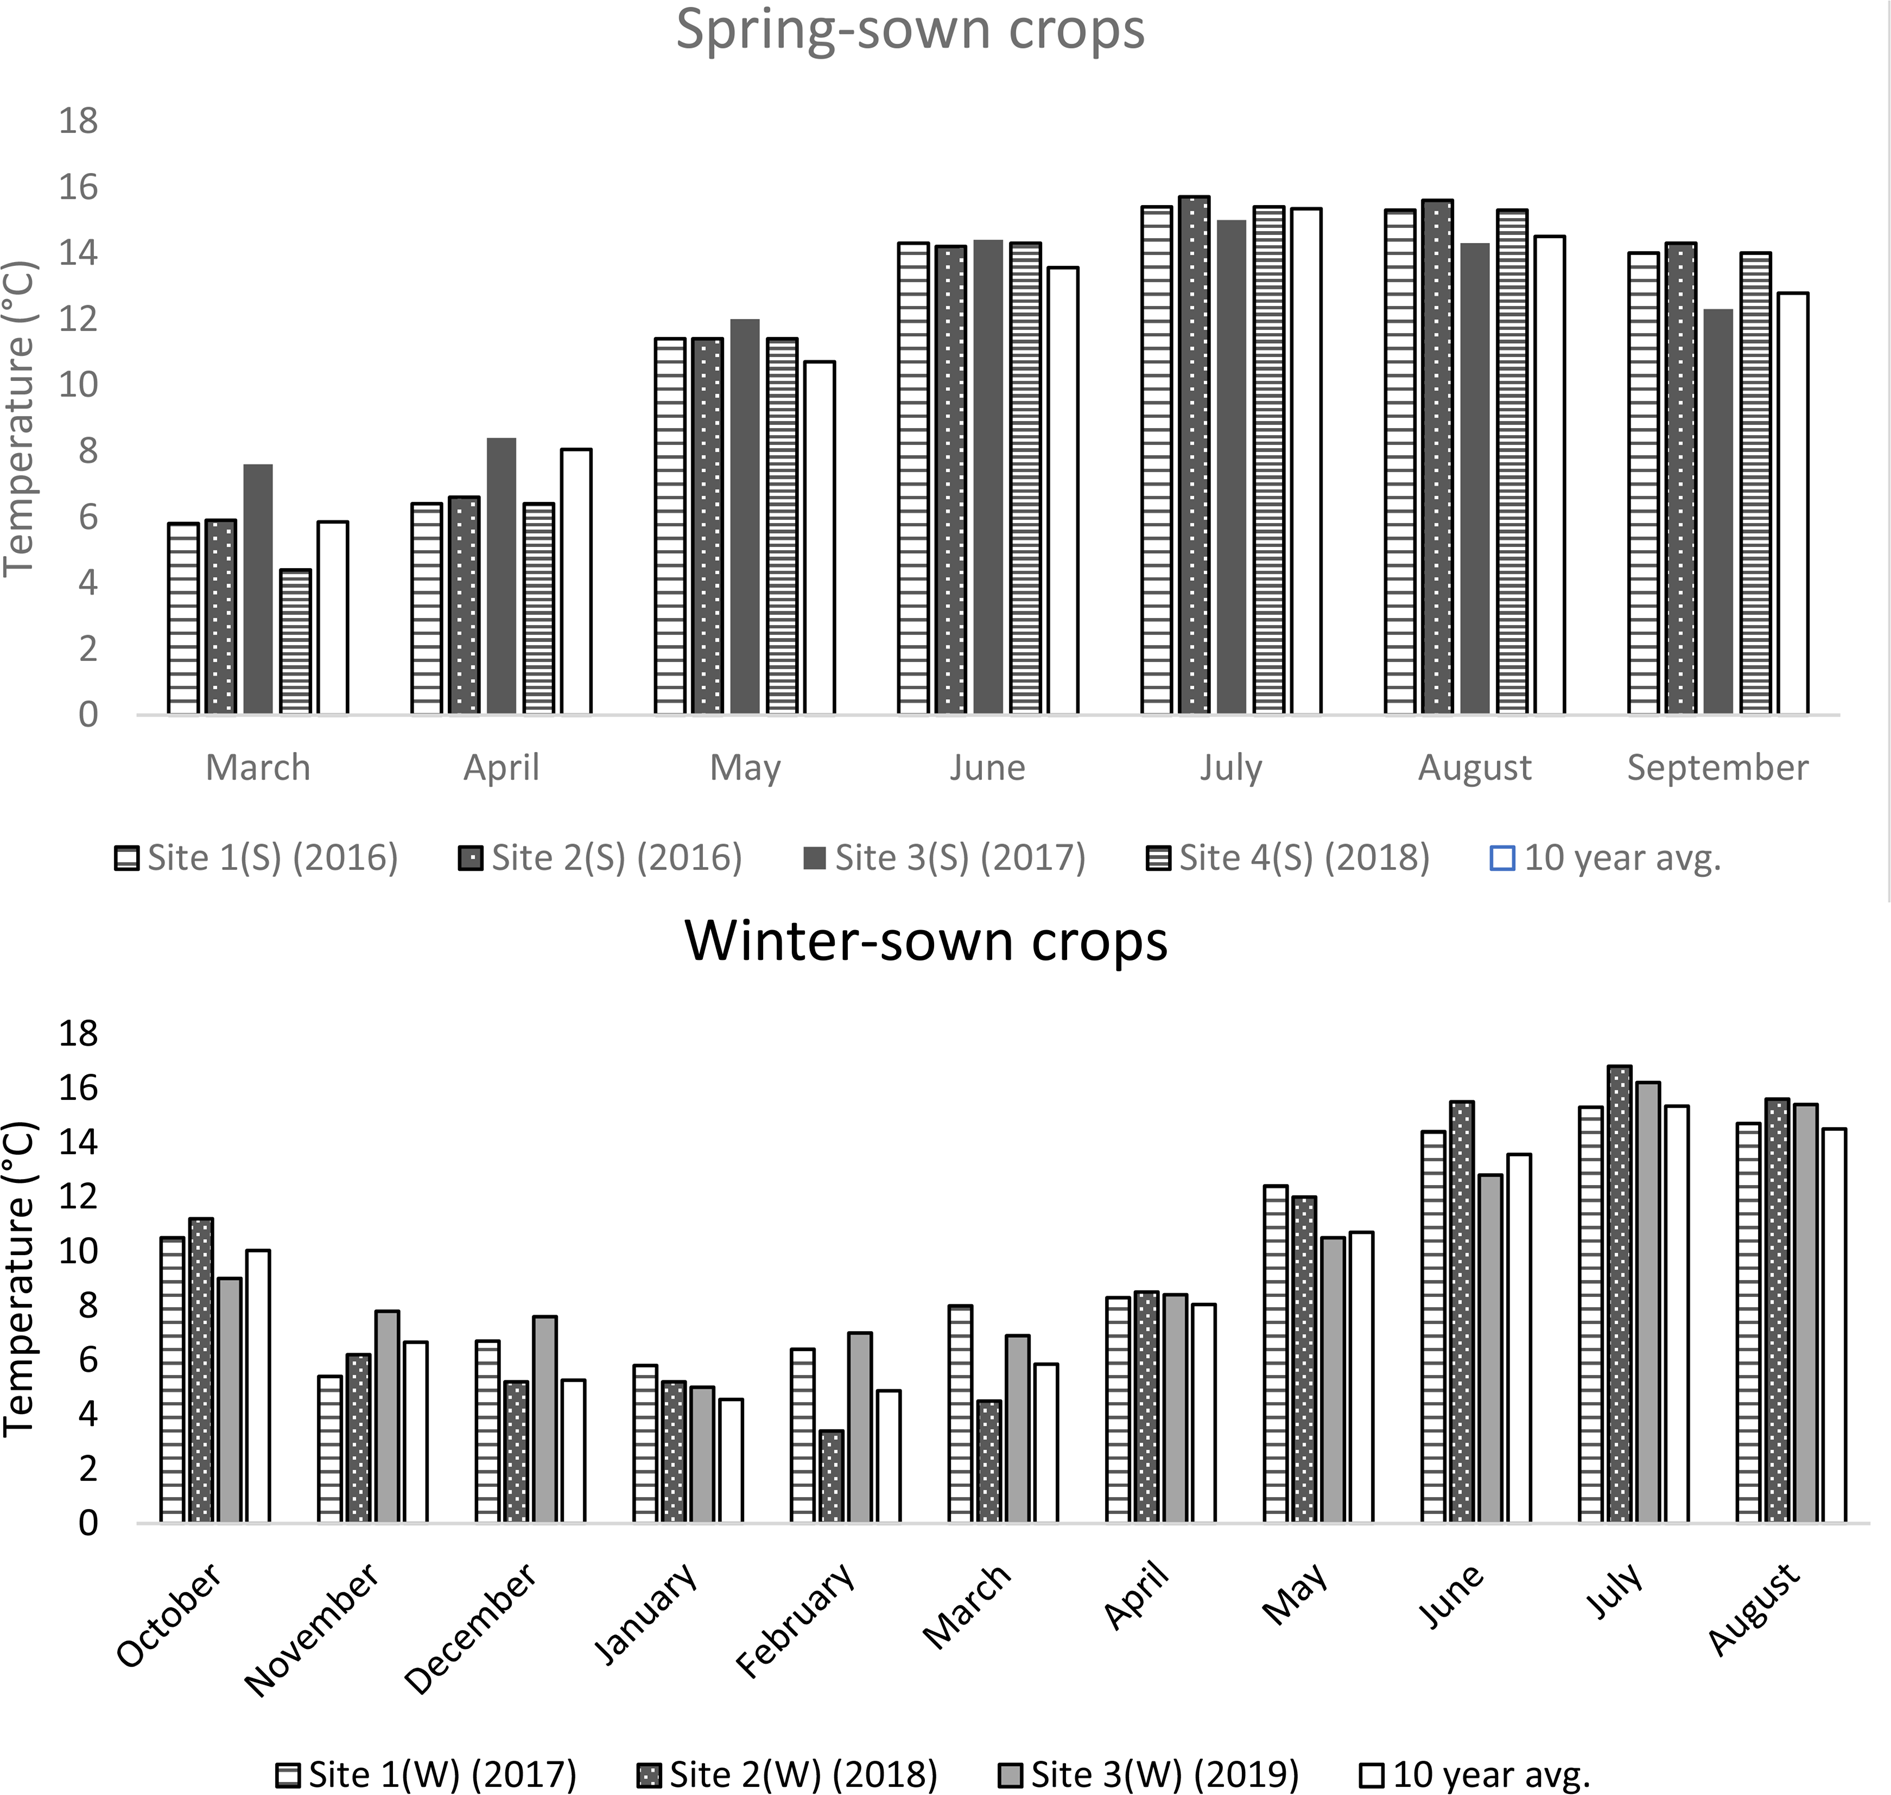
Fig. 2. Monthly mean air temperatures (°C) from March to September for spring-sown and October to August for winter-sown crops.
Specific weight
The effects of agronomic factors on the specific weight of oats are presented in Table 2 (spring-sown) and Table 3 (winter-sown). Specific weight values were high in spring and winter-sown oats in this study and were consistently above the critical milling specification of 52 kg/hl. Cultivar and seed rate had no effect on specific weight in spring or winter-sown oats. Specific weight was negatively associated with increases in applied N rate in spring-sown oats with no response observed where winter-sown. In the combined site regression analysis (Table 4), N rate accounted for 6.9% of variation in specific weight in spring oats and 0% in winter oats. At individual sites, N rate accounted for 0–14% of variation in spring oats (Table 4) and 0–11% in winter oats (Table 5). The application of PGR significantly reduced specific weight in spring-sown oats. No significant interactions between agronomic variables were observed for specific weight.
Table 2. Grain quality trait means and ANOVA of agronomic effects on grain quality in spring-sown oats
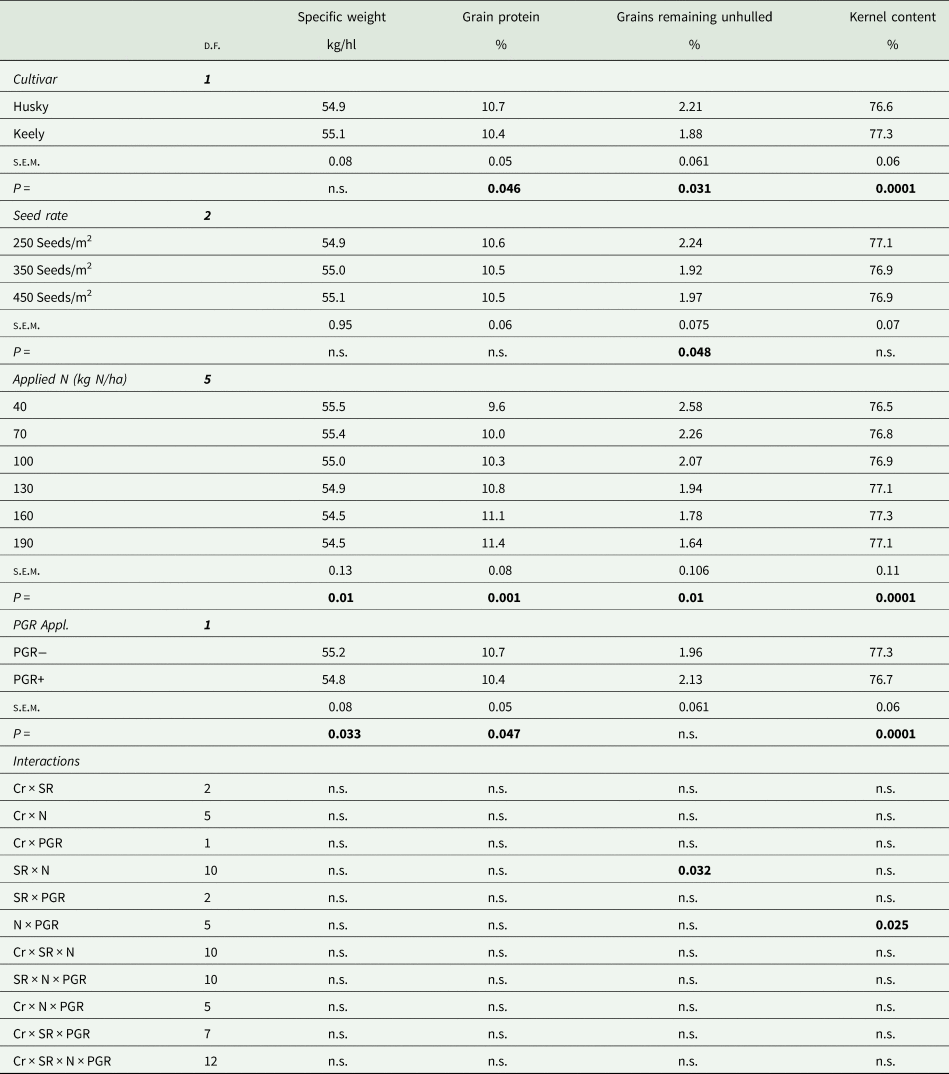
Cr, cultivar; SR, seed rate; N, applied N rate; PGR, plant growth regulation.
Values in bold significant at p = 0.05.
Table 3. Grain quality trait means and ANOVA of agronomic effects on grain quality in winter-sown oats
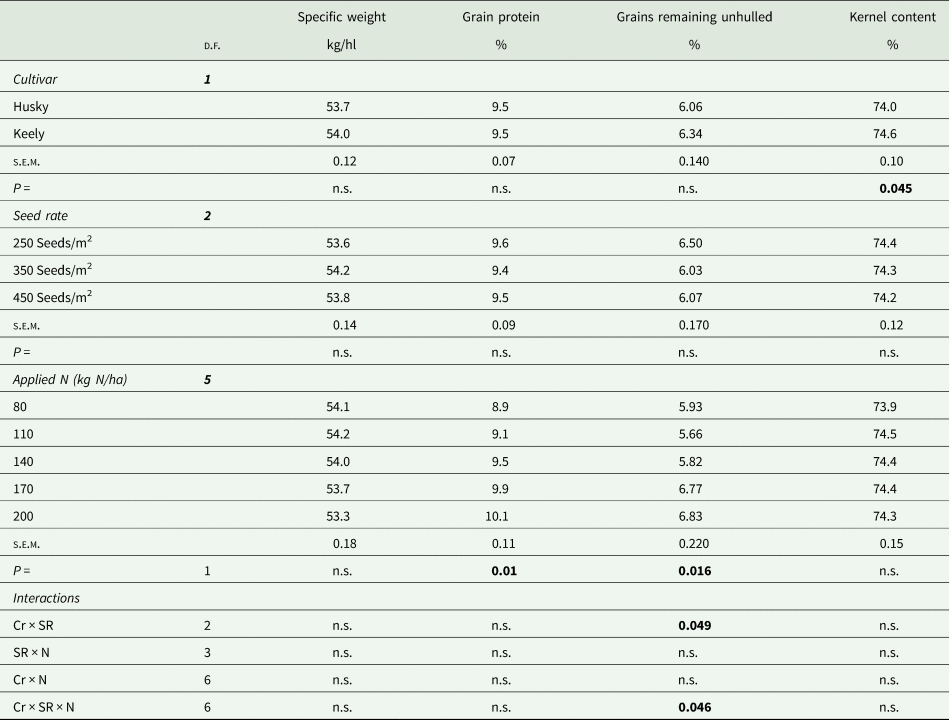
Cr, cultivar; SR, seed rate; N, applied N rate.
Values in bold significant at p = 0.05.
Table 4. Regression coefficients of applied N rate on grain quality parameters in spring oats: Site-specific values
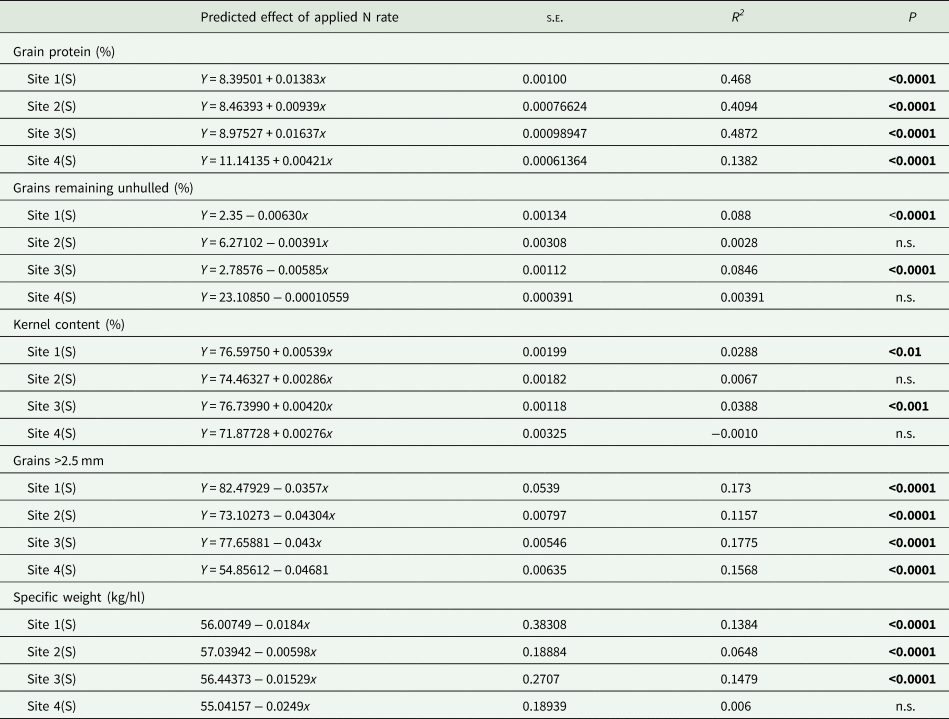
Values in bold significant at p = 0.05.
Table 5. Regression coefficients of applied N rate on grain quality parameters in winter oats: site-specific values
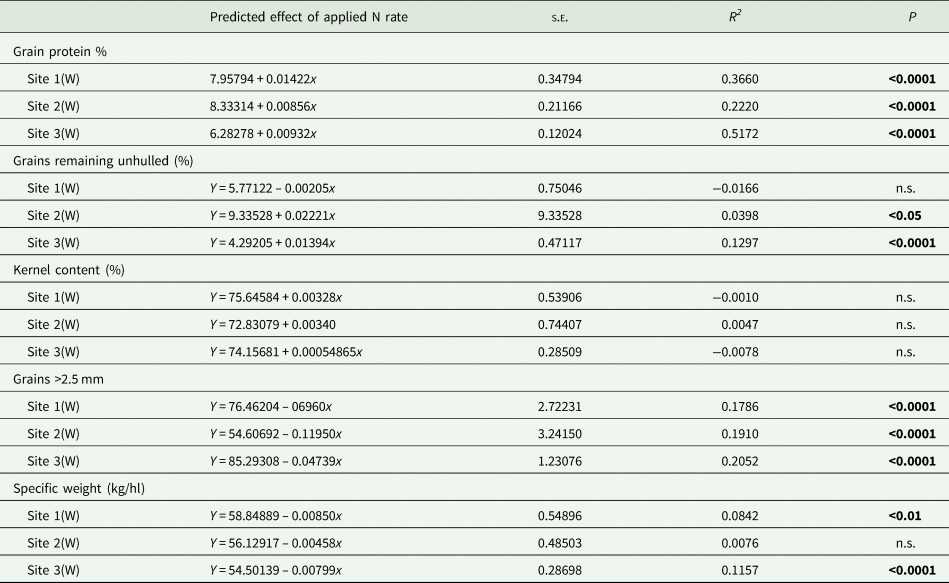
Values in bold significant at p = 0.05.
Grain protein
The effects of agronomic factors on the grain protein content of oats are presented in Table 2 (spring-sown) and Table 3 (winter-sown). Grain protein in spring-sown oats (9–11.4%) was in a higher range than winter-sown (8–10.1%). Husky had significantly higher protein levels (0.3%) than Keely in spring-sown oats with no cultivar effect observed in winter-sown oats. Seed rate had no effect on grain protein irrespective of sowing date. Grain protein demonstrated a positive linear response to applied N rate in spring and winter-sown oats. R 2 values of 0.20 (spring oats) and 0.14 (winter oats) (Table 6) were observed in the combined regression analysis with site-specific r 2 values in a 0.14–0.48 range in spring oats (Table 4) and 0.22–0.51 in winter-sown oats (Table 5). The application of CC + TE significantly reduced grain protein levels (−0.3%) in spring-sown experiments.
Table 6. Regression coefficients of applied N rate on grain quality parameters: combined data
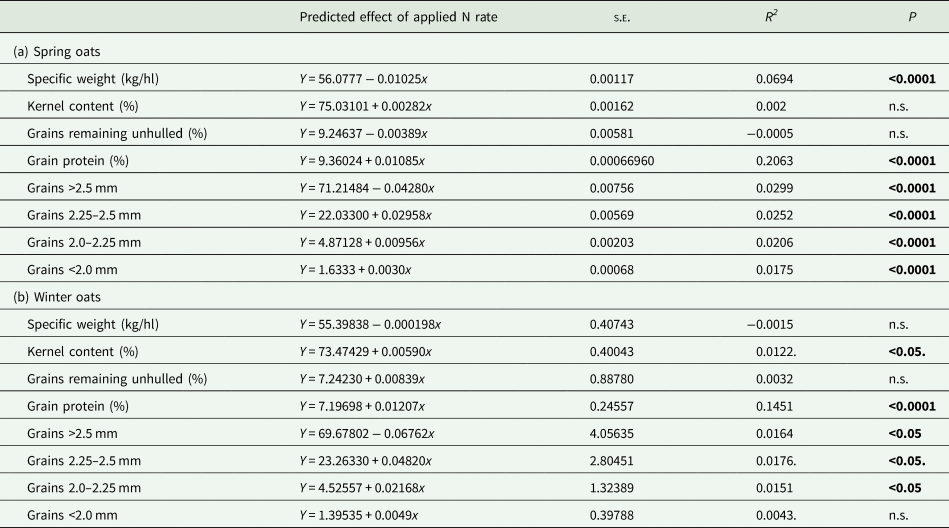
Values in bold significant at p = 0.05.
Hullability
The effects of agronomic factors on hullability are presented in Table 2 (spring-sown) and Table 3 (winter-sown). Spring sowing resulted in a lower range of unhulled grains (1.6–2.5%) than winter sowing (5.9–6.9%). Keely had a significantly lower level of unhulled grains in spring-sown oats (−0.33%) than Husky, with no cultivar effects observed in winter-sown oats. Hullability increased slightly in response to seed rate in spring-sown oats with no effect observed where winter-sown. Hullability increased in response to applied N rate in spring-sown oats with the reverse effect observed where winter-sown. R 2 values in the combined regression analysis were indicative of no relationship between applied N rate and grain hullability in spring (−0.0005) or winter-sown oats (0.0032) (Table 6). At individual sites, however, N rate accounted for 0–8.8% of variation in hullability in spring-sown oats (Table 4) and 0–13% in winter-sown oats (Table 5). The application of PGR had no significant effect on grains remaining unhulled in winter-sown oats.
Significant interactions were observed between seed rate and applied N rate in spring oats with an interaction between cultivar, seed rate and applied N rate observed in winter-sown oats. At applied N rates of 40 kg N/ha, a seed rate of 250 seeds/m2 resulted in lower hullability than 350 and 450 seeds/m2, with values similar between 250 and 450 seeds/m2 at 70 kg N/ha which were significantly higher than 350 seeds/m2 (Fig. 3). In the winter-sown oats, values were similar between all seed rates as N rate increased above 70 kg N/ha. In the winter oat data set, at 40 kg N/ha hullability increased in Husky as seed rate increased from 250 to 450 seeds/m2 with a reduction observed in Keely across the same combination (Fig. 4).
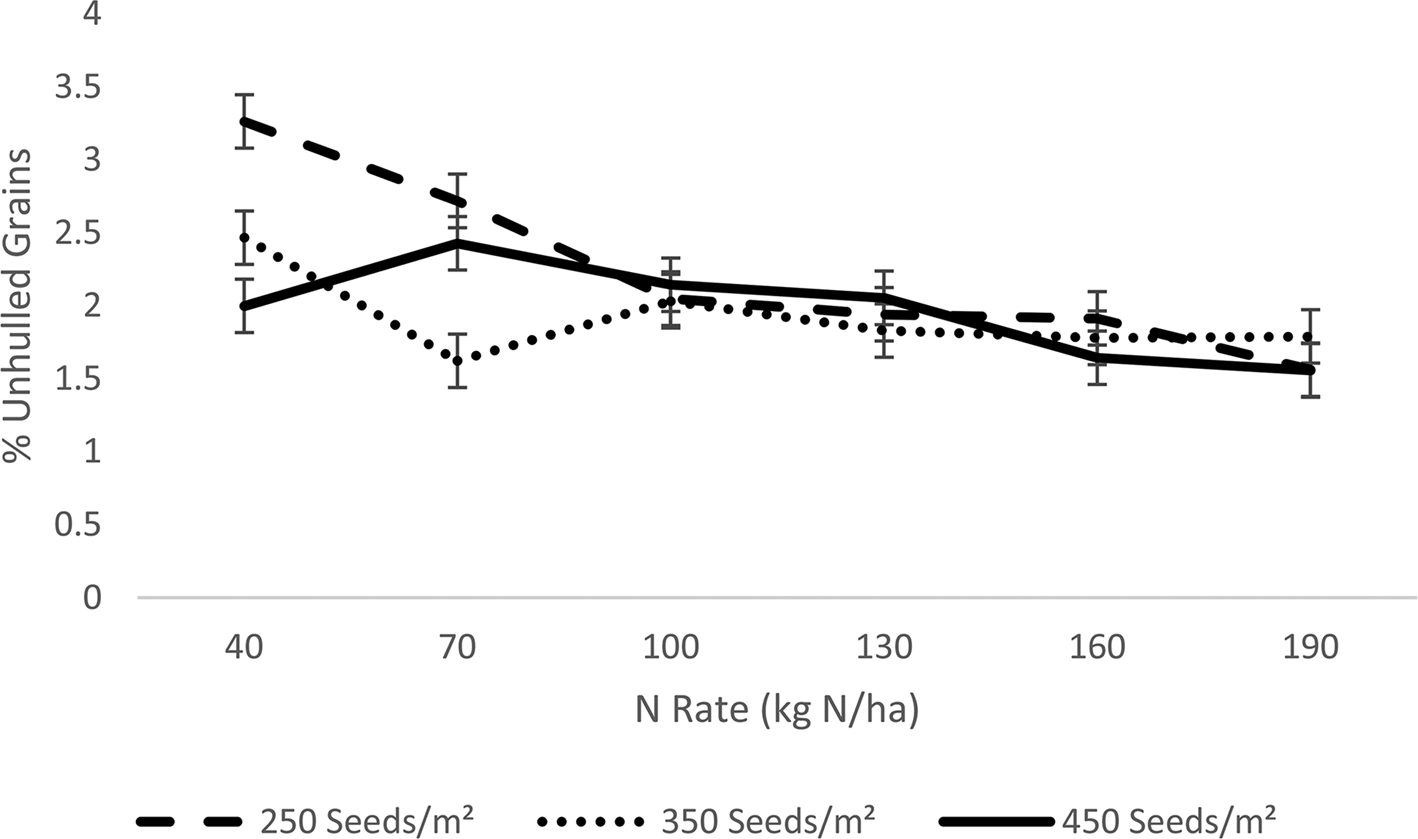
Fig. 3. Effect of seed rate and applied N rate on grains remaining unhulled (%): spring oat.

Fig. 4. Effect of cultivar, seed rate and applied N rate on grains remaining unhulled (%): winter oat.
Kernel content
The effects of agronomic factors on kernel content are presented in Table 2 (spring-sown) and Table 3 (winter-sown). Kernel content was in a higher range (76–77%) in spring-sown oats relative to winter oats (74–75%). Kernel content was significantly higher in Keely than Husky in spring (0.6%) and winter-sown (0.4%) oats. Seed rate had no significant effect on kernel content. Kernel content significantly increased in response to applied N rate in spring-sown oats with no effect observed where winter-sown. The combined regression analysis indicated that applied N rate accounted for no variation in spring-sown oats (r 2 = 0.002) and 0.01% of variation in winter-sown oats (Table 6). At individual sites, r 2 values of 0–0.039 were observed in spring-sown oats (Table 4) with no significant associations observed in winter-sown oats. Kernel content was significantly reduced (−0.6%) by the application of PGR in spring-sown oats.
A significant interaction was observed between applied N rate and PGR application. At applied N rates of 40–130 kg N/ha, the application of PGR resulted in a significant reduction in kernel content, with values similar between treated and untreated plots at N rates above 130 kg N/ha (Fig. 5).
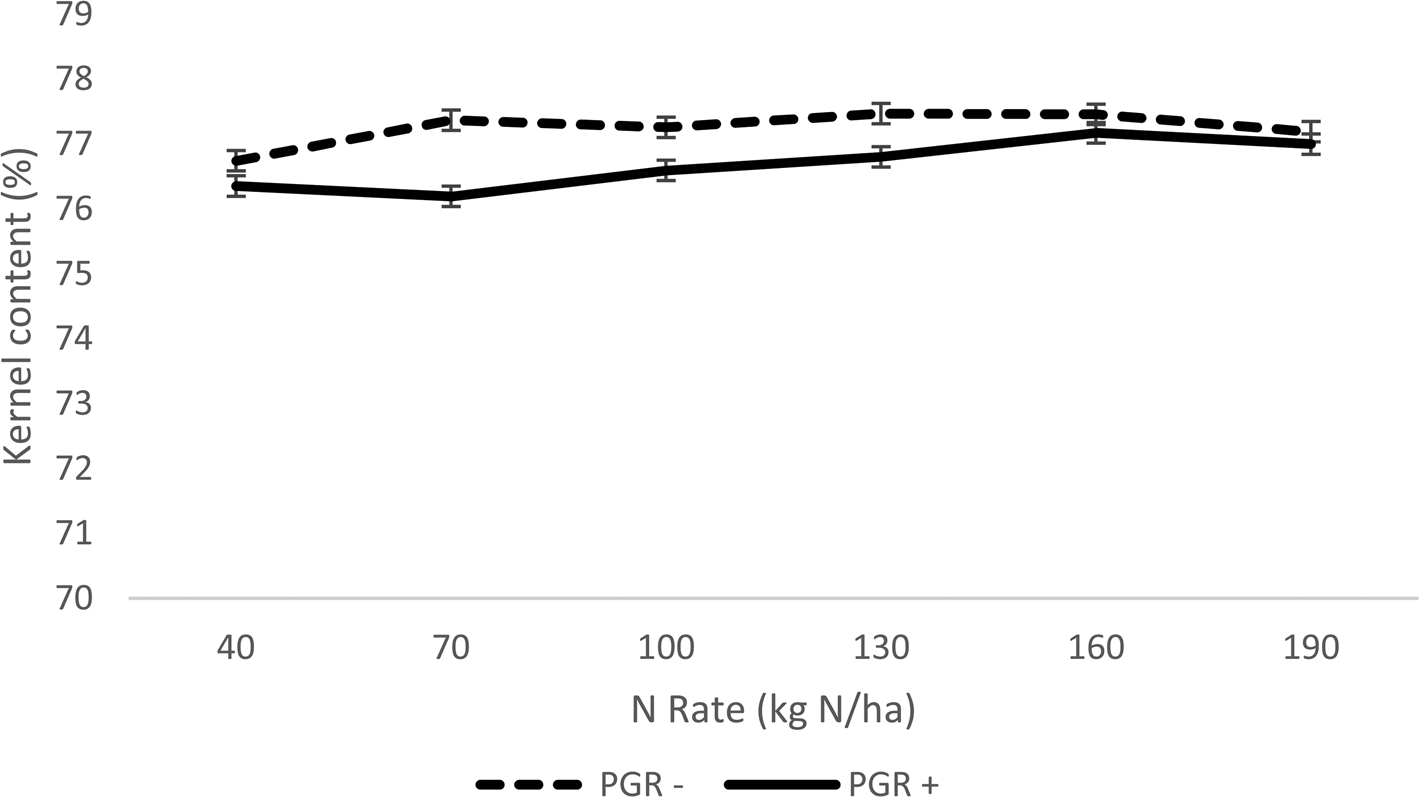
Fig. 5. Effect of PGR application and applied N rate on kernel content (%): spring oat.
Kernel size
The effects of agronomic factors on kernel size in oats are presented in Table 7 (spring-sown) and Table 8 (winter-sown). Winter-sown oats had a higher proportion of grains >2.5 mm, with spring-sowing resulting in a higher 2.25–2.5 mm fraction. Grains in smaller size fractions (2.0–2.25; <2.0 mm) were similar between the sowing dates. Cultivar had no effect on the proportion of grains in the >2.5 and 2.25–2.5 mm fractions, although Keely had a significantly higher proportion of grains in the 2.0–2.25 mm regardless of sowing date (0.4–0.6%) and the <2.0 mm (0.3%) fraction in spring-sown oats. Significant reductions (1.6%) were observed in grains >2.5 mm in response to increased seed rate in spring with significant increases observed in the proportion of grains in smaller size fractions. No seed rate effects on kernel size were observed in winter-sown oats. Increases in N rate resulted in reductions in the large grain fraction (>2.5 mm) (−6.2%) and significant increases in all other size fractions (2.25–2.5 mm (3.6%), 2.0–2.25 mm (1.5%) and <2.0 mm (0.4%)) in spring-sown oats, with similar significant responses observed in winter-sown oats (>2.5 mm, −13%, 2.25–2.5 mm, 9.7% and 2.0–2.25 mm, 1.1%) apart from the <2.0 mm fraction which was unresponsive. Regression analysis of the effect of applied N rate on grains >2.5 mm in the combined data sets (Table 6) indicates r 2 values of 0.03 (spring-sown oats) and 0.0164 (winter-sown oats). At individual sites, these values are in the range of 0.11–0.18 (spring-sown oats, Table 4) and 0.17–0.20 in winter-sown oats (Table 5). The application of CCC + TE significantly reduced the fraction of grains >2.5 mm and increased the proportion of grains in smaller size fractions in spring-sown oats.
Table 7. Effects and extracts from ANOVA of agronomic factors on grain size fractions in spring-sown oats
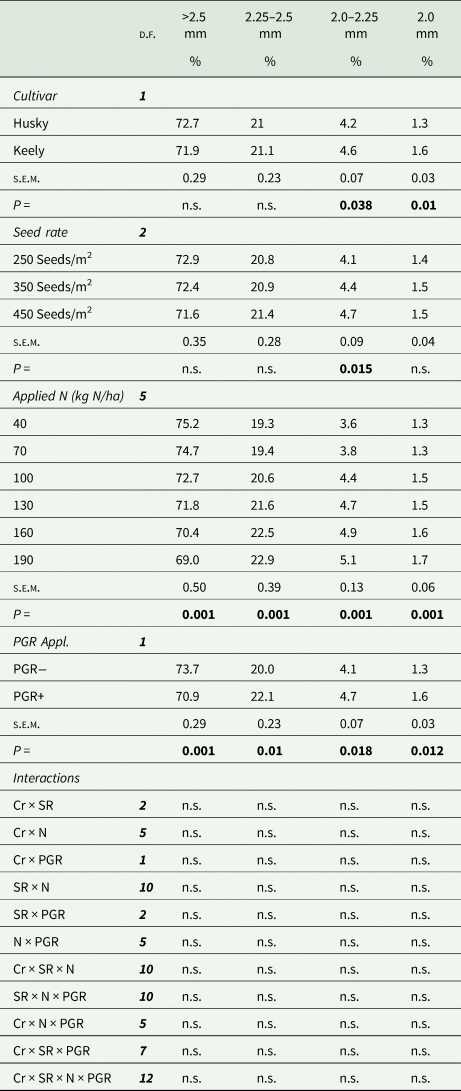
Cr, cultivar; SR, seed rate; N, applied N rate; PGR, plant growth regulation.
Values in bold significant at p = 0.05.
Table 8. Effects and extracts from ANOVA of agronomic factors on grain size fractions in winter-sown oats
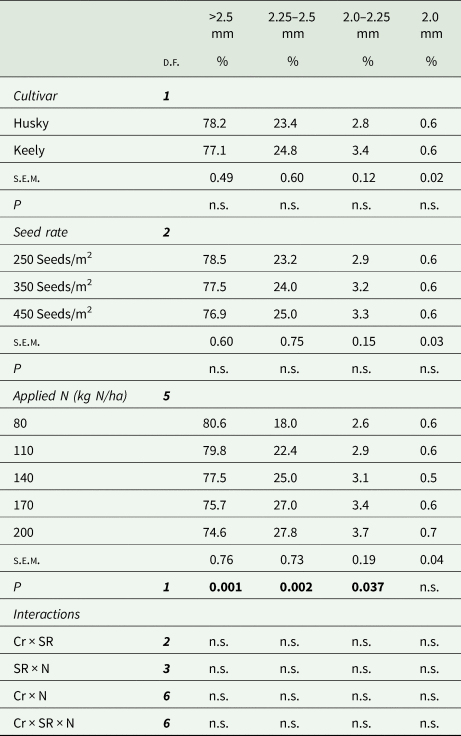
Cr, cultivar; SR, seed rate; N, applied N rate.
Values in bold significant at p = 0.05.
Key correlations
Simple correlation analysis was performed on the combined spring and winter-sown data sets, intended to provide a general snapshot of the relationship between quality parameters. While they do not unveil the influence of agronomic variables on the parameter of interest, they still provide useful information and contribute to understanding the mutual nature of grain quality in oats. Several key relationships were investigated between quality parameters (Table 9). Kernel content was associated with specific weight in three trials (two spring-sown, one winter-sown) with no association observed in the remaining trials. Interesting relationships were identified between kernel size and grains remaining unhulled in both the spring and winter-sown oats. In the combined data sets, strong negative relationships were observed in the spring (−0.84) and winter oat (−0.75) experiments. This is fully attributable to extremely poor grain fill in the summer of 2018, resulting in poorly filled grains and low hullability. While this relationship indicates the importance of good grain fill to hullability from an overall respective, it is not a true reflection of the importance of kernel size to hullability. In individual spring experiments, hullability was negatively associated with the amount of grain in the >2.5 mm (0.14–0.23) and 2.25–2.5 mm (0.17–0.18) fractions, indicating that larger grains led to a lower hulling efficiency. A negative association was observed between unhulled grain and the amount of grain in the 2.0–2.25 mm (−0.17 to −0.20) and 2.0 mm (−0.10 to −0.19) fractions, indicating a lower proportion of grains remained unhulled where a higher proportion of the grain was in the 2.0–2.25 mm fraction. In winter sowings, the amount of grain remaining unhulled was negatively associated with the amount of grain in the >2.5 mm grain fraction (−0.24 to −0.54) indicating that larger grains dehulled more efficiently in these crops. The relationship between kernel size and specific weight was also investigated. Again, the poor grain fill conditions during the summer of 2018 with low grain size and specific weights limit the reliability of the combined data correlations. This is typified by the detection of a negative correlation (−0.26) between grains in the >2.5 mm fraction and specific weight in the combined winter oat correlation, with positive correlations (0.13–0.50) observed all individual sites.
Table 9. Pearson's correlation coefficients between key quality parameters in spring and winter-sown oats

a Combined analysis of spring oat sites.
b Combined analysis of winter oat sites.
The consistent positive association between grains >2.5 mm and specific weight was widely observed, with smaller grain proportions negatively associated with specific weight in all seasons. Reductions in kernel size were therefore strongly linked to reductions in specific weight.
Discussion
Overall, the results show that sowing date, cultivar, seed rate, PGR application and applied N fertilizer rate all have effects on the processing quality of oat grain. The high grain quality potential of both winter and spring-sown crops under cool maritime conditions was clearly evident, with quality parameters rarely falling below critical minimum standards. Prolonged periods of drought stress during the summer of 2018 likely limited N fertilizer uptake at Site 4(S) and at Site 2(W) which explains the limited significance of regression coefficients, as site responses to agronomic inputs were highly variable.
Grain quality is influenced differently in spring and winter-sown crops, with quality highly linked to good levels of grain fill. The higher yield potential of winter-sown oats is due to a higher number of spikelets and grains/panicle (McCabe and Burke, Reference McCabe and Burke2021) but this higher level of competition for assimilate contributes to lower kernel content and hullability due to reduced grain fill (Browne et al., Reference Browne, White and Burke2002) with the higher yield potential leading to a dilution of grain protein % when compared with spring-sown oats. Spring-sown oats are more prone to stress-related yield loss due to rapid growth, but the lower levels of intra-panicle competition for assimilates lead to higher kernel content and associated increases in hullability. Grain protein is also higher in spring-sown oats due to lower yield levels. From a quality perspective, spring-sown oats have higher values, although the higher yield, lower lodging risk (Appendix 5 and 6) and earlier harvest of winter-sown oats have led to a larger proportion of winter oats entering the milling market.
Specific weight was unaffected by cultivar choice in this study which was an unusual discovery. Differences in specific weight between cultivars have been reported by Browne et al. (Reference Browne, White and Burke2003), White et al. (Reference White, Mc Garel and Ruddle2003) and Buerstmayr et al. (Reference Buerstmayr, Krenn, Stephan, Grausgruber and Zechner2007). This result is therefore linked to cultivar similarities as opposed to cultivars having no impact on specific weight. Seed rate also had no effect on specific weight, attributable to the similarity in grain fill characteristics across seed rates as reported by Finnan et al. (Reference Finnan, Burke and Spink2019b). Specific weight had a negative response to increased N fertilizer and this was linked to increased grain number produced in response to increased N rate, as smaller individual grains will have lower grain density. This response was also previously reported by Browne et al. (Reference Browne, White and Burke2003), Finnan et al. (Reference Finnan, Burke and Spink2019a) under Irish conditions, and by Mohr et al. (Reference Mohr, Grant, May and Stevenson2004) and May et al. (Reference May, Mohr, Lafond, Johnston and Stevenson2006) under Canadian conditions. Doehlert et al. (Reference Doehlert, Ohm, McMullen and Riveland2009) state that test weight is the product of kernel density and packing proportion, with packing proportion determined by specific parameters regarding grain size. The observed reduction in TGW (McCabe and Burke, Reference McCabe and Burke2021) and grain width with increasing N rate would also be expected to have negative effects on kernel density and packing proportion as a result.
Kernel size was predominantly impacted by applied N rate but was affected by all agronomic factors. Increases in applied N rate resulted in reductions in grains >2.5 mm and increased the proportion of grains in the 2.25–2.5, 2.0–2.25 and <2.0 mm fractions. This reduction in kernel size in response to applied N rate is associated with the negative relationship between TGW and total grain number. This relationship has been widely observed and reported (Browne et al., Reference Browne, White and Burke2006; Peltonen-sainio et al., Reference Peltonen-Sainio, Kangas, Salo and Jauhiainen2007; Finnan and Spink, Reference Finnan and Spink2017) but the effects observed on physical kernel size rather than individual grain weights are of key interest regarding grain quality. Kernel size was shown to exert a key influence on grain hullability by Deane and Commers (Reference Deane, Commers and Webster1986) and White and Watson (Reference White and Watson2010). This provides a potential agronomic approach which may be targeted to improve grain processability and value. The application of CCC + TE generally reduced the proportion of large grains and increased the proportion of grain falling into smaller size categories. This reduction in kernel size in response to CCC application was previously reported by Leitch and Hayes (Reference Leitch and Hayes1989) and Browne et al. (Reference Browne, White and Burke2006). It is unlikely in the authors’ opinion that reductions in kernel size in response to the application of plant growth regulators are fully attributable to changes in grain fill levels. TGW and grains >2.5 mm were significantly lower where CCC + TE had been applied, suggesting that potential kernel size was reduced. The possibility that the application of plant growth regulator could reduce potential kernel size when applied at early development at GS 30 and 31–32 has not been investigated. It is realistic to assume that hormonal changes in CCC + TE treated plants may restrict potential kernel size in line with the profound reductions in stem height and diameter reported in the literature. It has been reported that increases in grain number in oats result in lower grain weights (Peltonen-Sainio et al., Reference Peltonen-Sainio, Kangas, Salo and Jauhiainen2007; Finnan and Spink, Reference Finnan and Spink2017). The results of this study demonstrate that kernel size is reduced in tandem with reductions in grain weight as the rate of applied N increases. Yield formation processes have therefore a key role to play in determining the grain quality parameters of specific weight and kernel size.
Grain hullability was affected by agronomic factors in this study. According to Browne et al. (Reference Browne, White and Burke2002) and Yan et al. (Reference Yan, Fregeau-Reid, Ma, Pageau and Vera2017), cultivars are the main determinators of variation in hullability. Keely had a significantly higher level of hullability in spring-sown oats but no effect was observed in winter-sown oats. As grain number is the key sink for assimilates, spring-sown crops are more likely to be sink-limited than source-limited regarding potential grain fill due to lower grain numbers (Crampton et al., Reference Crampton, Moot and Martin1997). Grain fill is therefore less prone to adverse climatic conditions during grain fill in spring-sown oats compared to winter-sown oats. Kernel content was also higher in Keely in both spring and winter-sown oats. This is of key importance as kernel content has been linked to hullability in previous studies (GanBmann and Vorwerck, Reference GanBmann, Vorwerck and Welch1995: Doehlert et al., Reference Doehlert, McMullen and Baumann1999: Browne et al., Reference Browne, White and Burke2002). The implication of this is that well-filled grains will dehull better than poorly filled grains, explaining this relationship.
Hullability improved as N rate increased in spring-sown crops while a negative response was observed in winter sowings. Positive effects of applied N rate on hullability were reported by Browne et al. (Reference Browne, White and Burke2003) and Yan et al. (Reference Yan, Fregeau-Reid, Ma, Pageau and Vera2017) in spring-sown crops. Browne et al. (Reference Browne, White and Burke2003) also reported improvements in hullability in winter-sown oats in response to increased applied N rate, but this effect was not observed in the current study. Increases in hullability in response to applied N rate are likely related to changes in kernel size which has been shown to have marked effects on the processability of oat grains in previous studies (Doehlert and Wiessenborn, Reference Doehlert and Wiessenborn2009; White and Watson, Reference White and Watson2010). Hullability increases were observed in spring-sown oats in response to seed rate, with the role that apical dominance plays in the prioritization of mainstem grain-fill accounting for this effect in line with results in barley reported by Cannell (Reference Cannell1969).
The increase in hullability in spring-sown oats in response to applied N rate is an example of an optimum source-sink balance within oat panicles. Applied N rate has increased grain number and reduced kernel size, but kernel content has increased. Individual grain fill has, therefore, not been hampered by increased grain number, instead the level of individual grain fill has been revised upwards. These well-filled small grains dehulled more efficiently and explain the observed increase in hullability to applied N rate. The increase in grains remaining unhulled in winter-sown crops was linked to the higher number of grains/panicle, leading to a dilution of available assimilate and an increase in the number of incompletely filled grains. Again, well-filled grains will dehull more readily than poorly filled grains (Browne et al., Reference Browne, White and Burke2002) explaining the differing responses observed in the spring and winter-sown crops. The different nature of the correlations between grain size and hullability in the combined and site-specific data sets is also attributable to the importance of grain fill, with the limited grain fill at experiments conducted in 2018 of importance in this context. Once a critical level of good grain fill is achieved, kernel size becomes of greater importance for hullability.
Doehlert and Wiessenborn (Reference Doehlert and Wiessenborn2009) reported that grain width strongly influenced dehulling efficiency and optimal widths varied between cultivars. The cultivars used in this study dehull more efficiently when a higher proportion of grains are in the 2.0–2.25 mm fractions in spring oats with a higher hullability observed in winter sowings with a higher proportion of grains >2.5 mm. The smaller grains observed in response to N rate are therefore likely to contribute to the increase in grain hullability observed in the spring-sown crops. The negative effect of applied N rate on hullability in the winter-sown crops is linked to a higher number of grains which are not optimally filled. White and Watson (Reference White and Watson2010) also reported that large grains were harder to dehull than smaller grains, although grains were sorted by weight and not by size in that study. However, it is realistic to assume that size and weight are inextricably linked. Grading of oats by size does occur prior to commercial dehulling since grains of different size fractions will dehull more efficiently at different rotor speeds (GanBmann and Vorwerck, Reference GanBmann, Vorwerck and Welch1995). Increased breeding and agronomic focus on increasing the proportion of total grains within this optimum range will result in more economic dehulling at a commercial level and higher value grain for producers.
Sowing date had a significant impact on kernel content in this study with higher values observed in spring-sown oats. This is attributable to a higher spikelet number and increased competition for assimilates during grain-fill relative to spring-sown oats (McCabe and Burke, Reference McCabe and Burke2021). Kernel content was higher in Keely than Husky in both spring and winter-sown oats. This again follows the general rule in oats that differences in kernel content are predominantly controlled by genetics (Peterson et al., Reference Peterson, Wesenberg, Burrup and Erickson2005). Browne et al. (Reference Browne, White and Burke2006) states that the lemma and the palea, the constituents of the husk proportion of oat grain, are fully formed prior to anthesis and make up approximately 25% of the grain by weight. The maximum potential kernel content is therefore genetically restricted to some degree based on the proportion of grain weight made up of the hull, with agronomic practices key to the attainment of this predetermined maximum. Kernel content increased in spring-sown oats in response to applied N rate which was surprising as the unresponsiveness of kernel content to applied N rate has been reported by Zhou et al. (Reference Zhou, Robards, Roberts, Glennie-Holmes and Helliwell1998), Browne et al. (Reference Browne, White and Burke2003) and Lafond et al. (Reference Lafond, May and Holzapfel2013). However, Yan et al. (Reference Yan, Fregeau-Reid, Ma, Pageau and Vera2017) reported increases in kernel content in response to N rate within a high number of genotypes under Canadian conditions. The results of this study suggest that the increase in assimilate availability in spring-sown oats at high N levels has resulted in increased grain fill and an associated increase in kernel content. In winter-sown oats, increased competition due to a higher grain number resulted in the processes of equal assimilate distribution suggested by Browne et al. (Reference Browne, White and Burke2003) taking effect. Browne et al. (Reference Browne, White and Burke2003) stated that oat crops will maintain consistent kernel content by aborting surplus grain sites to ensure consistent grain fill within a reduced number of potential grain sites. In a winter-sown crop characterized by a high grain number per panicle, this is a likely occurrence, explaining the differential responses in spring and winter-sown oats. The application of PGR reduced kernel content in line with the results reported by Browne et al. (Reference Browne, White and Burke2003). This is linked to either of two scenarios. Slight increases in grain number in response to PGR application may result in a dilution of assimilate amongst a higher number of grains resulting in decreased kernel content. It is the authors’ opinion that the potential kernel size is reduced by PGR application due to decreased potential kernel size as PGR causes redistribution of assimilates into non-reproductive organs in the plant.
Meyer and Zwingelberg (Reference Meyer and Zwingelberg1981) and Burke et al. (Reference Burke, Browne and White2001) reported that specific weight was a poor indicator of kernel content and extract yield. In the current study, specific weight was correlated with kernel content at Site 2(S) (r 2 = 0.22), 4(S) (r 2 = 0.31) and 3(W) (r 2 = 0.26) but not at any other site/year, whether spring or winter-sown. Interestingly, Doehlert et al. (Reference Doehlert, Ohm, McMullen and Riveland2009) reported that this relationship was loose and proposed that test weight and kernel content were linked through kernel density, with packing proportion likely causing the variation in the relationship across different environments. This packing proportion would be determined by grain fill conditions which would vary between environments. The variation observed between the crops for grain width distributions provides a subtle insight into the potential for variation in packing proportion. The relationship between specific weight and kernel content is therefore expected to be site/year-specific in nature and this is in line with what was observed in the current study. Webster (Reference Webster, Henry and Kettlewell1996) reports that specific weight is an acceptable indicator of milling quality within individual varieties but not across varieties. The current results would suggest that its application to milling quality is further restricted to specific sites/years. Further investigation into agronomic factors aside from cultivar choice which influence kernel density and packing proportion is required to gain a full insight into this relationship if it continues to be used as a predictor of milling quality by purchasers of oat grain.
Grain protein was responsive to changes in agronomic factors in this study. Cultivar differences were observed in spring-sown oats but not where winter-sown. Husky has higher protein than Keely in spring-sown experiments and this may be attributable to the fact it is a lower yield potential variety and follows the negative relationship between grain yield and grain protein content. Increasing the seed rate had no effect on grain protein in spring or winter-sown oats. Decreases in grain protein in response to increased seed rate were previously reported in winter barley under Irish conditions by Conry and Hegarty (Reference Conry and Hegarty1992) although Conry (Reference Conry1998) reported no effect of seed rate on grain N% in spring barley under Irish conditions. Increasing the level of applied N fertilizer resulted in a linear increase in grain protein at all sites. This is the common trend observed in previous studies conducted by Humphreys et al. (Reference Humphreys, Smith and Mather1994) under Canadian conditions and Chalmers et al. (Reference Chalmers, Dyer and Sylevester-Bradley1998) under UK conditions. The application of CCC + TE resulted in a reduction in grain protein in spring-sown crops. Previous reports have indicated that the application of plant growth regulators had no effect on grain protein content (Clark and Fedak, Reference Clark and Fedak1975; Oplinger et al., Reference Oplinger, Veith and Youngs1975; Pietola et al., Reference Pietola, Tanni and Elonen1999) therefore this result is of interest. It is likely that the decrease in grain protein in response to the application of plant growth regulators is linked to the slight decrease in grain kernel content as the husk content of oats has been shown to have a low capacity for protein storage (Hutchinson and Martin, Reference Hutchinson and Martin1995) rather than increases in yield potential and an associated dilution effect.
Conclusions
The importance of sowing date in the determination of milling oat quality has been demonstrated in this study, with higher ranges of key quality traits observed in spring-sown oats. This study has demonstrated the key relationships between factors influencing individual grain fill and the milling parameters of kernel content, grain hullability and kernel size, in addition to the stability of kernel content as a quality parameter across a range of agronomic conditions. The production of high-yielding oat crops of high milling quality should therefore focus on the production of a high grain number in tandem with the maximization of individual grain fill.
Supplementary material
The supplementary material for this article can be found at https://doi.org/10.1017/S0021859621000873
Acknowledgements
The authors acknowledge the Irish Research Council and Origin Enterprises PLC.
Financial support
Origin Enterprise PLC and the Irish Research Council.
Conflict of interest
None.
Ethical standards
Not applicable.


 Open access