Introduction
In the past decade, the impact of climate change has been particularly evident in Bosnia and Herzegovina with the repeated occurrence of extreme events. On one hand, this has manifested in the absence of precipitation for several months and higher than average temperatures for several weeks, resulting in droughts (2007, 2011, 2012 and 2015). On the other hand, high-intensity rainfall has caused overflows and flooding, increased groundwater level of already shallow aquifers, soil erosion and landslides, as well as a drastic reduction in agricultural production (as in 2009, 2010 and in May of 2014). These extremes directly triggered a decline in field crop yields, which caused significant economic damage and social and political disputes. Accordingly, adaptation strategies are needed to respond to the challenges imposed by climate change, considering specific soil and climate characteristics and local peculiarities of agricultural systems.
Numerous studies (Alexandrov et al. Reference Alexandrov, Eitzinger, Cajic and Oberforster2002; Seneviratne et al. Reference Seneviratne, Lüthi, Litschi and Schär2006; Giorgi & Lionello Reference Giorgi and Lionello2008; Islam et al. Reference Islam, Ahuja, Garcia, Ma, Saseendran and Trout2012; Tanasijevic et al. Reference Tanasijevic, Todorovic, Pereira, Pizzigalli and Lionello2014) indicate that the northern areas of the Mediterranean and its surroundings could receive a greater amount of precipitation while the southern areas could receive less rainfall, especially during the summer. Furthermore, Seneviratne et al. (Reference Seneviratne, Lüthi, Litschi and Schär2006) pointed out that ‘land–atmosphere interactions increase climate variability in this region because climatic regimes in Europe shift northwards in response to increasing greenhouse gas concentrations, creating a new transitional climate zone with strong land–atmosphere coupling in central and eastern Europe’.
Bosnia and Herzegovina is located in the transition zone of south-eastern Europe, where strong inter-seasonal variations of precipitation and air temperature can be expected. In the past few years, several scientific papers dealing with the issues of climate change impact on the variation in yield and water requirements of strategic crops have been published for surrounding countries. Vučetić (Reference Vučetić2011) reported a slight decrease in maize yield in Croatia (up to 12%) until the end of the 21st century. Mihailović et al. (Reference Mihailović, Lalić, Drešković, Mimić, Djurdjević and Jančić2015) pointed out that the future climate zones of Serbia will shift from the present climate towards warmer and drier climate zones, but this will be favourable for most field crops. Namely, the yield of winter wheat and soybeans will increase, on average, under the Intergovernmental Panel on Climate Change (IPCC) Special Report on Emissions Scenarios (SRES) A1B and A2. The exception is maize under non-irrigated conditions. Lalic et al. (Reference Lalic, Eitzinger, Mihailovic, Thaler and Jančić2013) identified agro-climatic parameters that can reveal the effects of climate change on winter wheat yield in the Pannonian lowland. The high positive correlations between yield and actual evapotranspiration (ETa), accumulated precipitation and the ratio between actual and reference evapotranspiration (ETa/ETo) for the April–June period indicate that water is, and will remain, a major limiting factor for growing winter wheat in this region.
Stričević et al. (Reference Stričević, Djurović, Vuković, Vujadinović, Ćosić and Pejić2014) and Jancic et al. (Reference Jancic, Lalic, Mihailovic and Jacimovic2015) studied the impact of climate change on the cultivation of sugar beet and soybean, respectively, in Serbia. Both studies revealed that climate change would contribute to an increase in irrigation demand and concluded that in the period 2010–2039, the average yield will not be reduced significantly under rainfed cultivation. However, the increase in temperature and reduction in precipitation expected by the end of the 21st century (period 2070–2099) will have a negative impact on yield and will increase irrigation needs.
Trbić et al. (Reference Trbić, Bajic, Djudjđević, Crnogorac, Popov, Dekić, Petrasevic and Rajcevic2016) reported an increase in temperature and a decrease in precipitation in Bosnia and Herzegovina, pointing out that, in the 2001–2030 period, aridity will increase during the growing season of spring–summer crops, especially in the northern and southern part of Bosnia and Herzegovina. Trbić et al. (Reference Trbić, Bajic, Djudjđević, Crnogorac, Popov, Dekić, Petrasevic and Rajcevic2016) conclude that the agricultural sector in Bosnia and Herzegovina will have to undergo major structural reforms. Intensive development of agricultural production will have to adapt to the changing climate and bioclimatic conditions. It is, therefore, reasonable to expect that water use and the need for irrigation will increase, especially if the root system or the effective soil depth is shallow. Therefore, there is a need to analyse the expected trend of irrigation requirements, water footprint and water productivity (WP) in the future. With this in mind, the objective of the current research is to examine the impact of climate change on maize cultivation in Bosnia and Herzegovina, with special emphasis on yield, crop water requirements, WP and the ratio of green to blue water by comparing them under present and future climate conditions.
Materials and Methods
Study area characteristics
The study area is located in the Valley of Vrbas River in the province of Banja Luka (BL), representing the north-western part of Bosnia and Herzegovina (44°46′N, 17°11′E) (Fig. 1). The main field crops are maize, occupying half of the arable land, followed by wheat, barley, potato, alfalfa and clover. Field crops are rainfed. The region is among the most prone to climate variability (Trbić et al. Reference Trbić, Bajic, Djudjđević, Crnogorac, Popov, Dekić, Petrasevic and Rajcevic2016). The lack of historical climatic and crop data (due to the war) excluded other sites from being analysed.
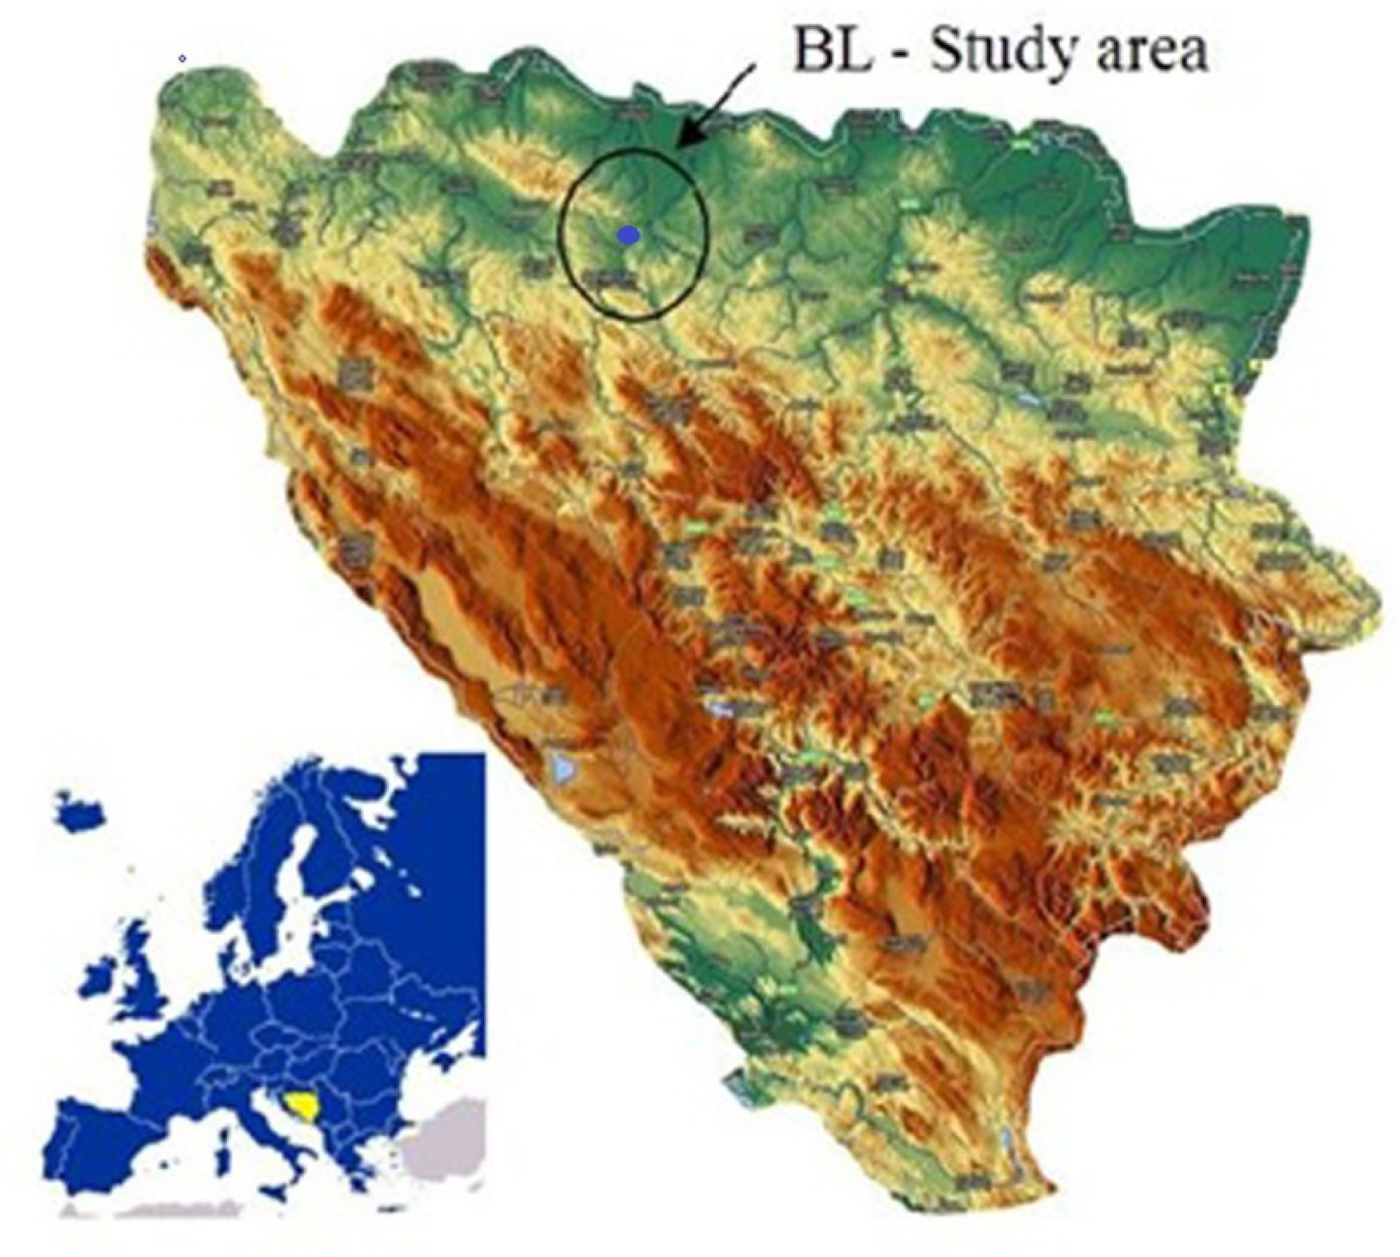
Fig. 1. Location of the study area (http://www.ikc-berlin.de/bosnisch/html/bosna/KARTE-BOSNE.htm and http://www.bosnaonline.org/opce-karte-bosne-i-hercegovine).
The studied area is suitable for both plant and livestock production. Topography varies from flat to hilly with average terrain elevation of 164 m a.s.l. Maize (Zea mays L.) is a strategic crop for Bosnia and Herzegovina. It is mainly rainfed and cultivated over more than half of the arable land. The growing season extends from mid-April to September and production can reach, on average, 8–12 t/ha under non-limiting water and with sufficient nutrient inputs (Biancalani et al. Reference Biancalani, Predić, Leko, Bukalo and Ljuša2004).
The study area is characterized by a moderate continental climate. The average precipitation level over a period of 30 years (1981–2010) is 1039 mm (1396 mm maximum and 702 mm minimum). During the vegetation period, from April to September, the total average precipitation is 534 mm. The average annual temperature is 11·4 °C (21 °C during the summer period). The mean daily reference evapotranspiration rate during the warmest months (July and August) is up to 5 mm, reaching 6 mm on windy days.
Kastanozem (deep brown acidic soil), according to the World Reference Base for Soil Resources (IUSS Working Group WRB 2015) is the main soil group characterizing the areas grown with field crops. The soil profile depth can be >160 cm. Soil fertility is moderate. Soil texture is loamy to clay loam. The physical properties of the soil are characterized by heavier mechanical composition, especially in the second horizon (B) with strong colloidal complexes. The stability of structural macro-aggregates in the surface and sub-surface horizons is very good, and therefore, the soil is not exposed to the devastating effects of water. The soil texture results in moderate-to-high soil moisture potential, but with unfavourable macro- and meso-soil porosity. Chemical soil properties indicate slight acidity (pH in H2O 6·1), physiologically active phosphorus (in traces) and medium content of potassium (Anon 1975).
Model parameters and input data
The FAO water-driven model AquaCrop (v.4.0) was used to simulate yield, sowing date and irrigation requirements. This model was chosen since it is user-friendly, proven in many studies related to field crops, particularly maize (Hsiao et al. Reference Hsiao, Heng, Steduto, Rojas-Lara, Raes and Fereres2009), and can be used to estimate the effects of climate-related parameters, such as precipitation, air temperature and atmospheric concentrations of carbon dioxide (CO2) in historical, present or future agro-climatic conditions. The FAO AquaCrop model has been described in detail by Steduto et al. (Reference Steduto, Hsiao, Raes and Fereres2009) and Raes et al. (Reference Raes, Steduto, Hsiao and Fereres2009).
The calibration of AquaCrop was based on studies and field experiments conducted in the study area in the period 2004–2013 for different field management practices, such as soil fertility and plant density (Table 1). This creates the precondition for reliable simulations and comparisons of maize development and growth with and without irrigation in the reference period (1961–1990) and in the future (up to the end of the 21st century).
Table 1. Experimental data used for the calibration of the crop (maize) file in the study area

For the analysis of current (2004–2013) and historical (reference period 1961–1990) weather conditions, mean monthly data from the meteorological station in BL (hydro-meteorological services in BL, Internet http://rhmzrs.com/) were used. As for future climate scenarios, monthly data were obtained from the EBU-POM regional climate model (Eta Belgrade University – Princeton Ocean Model) (Djurdjević & Rajković Reference Djurdjević and Rajković2008; Gualdi et al. Reference Gualdi, Rajković, Đurđević, Castellari, Scoccimarro, Navarra and Dacić2008), for climate scenarios SRES A1B, A2 and A1B > CO2, A2 > CO2 for time slices in the future, centred on the 2020s (2010–2039), the 2050s (2040–2069) and the 2080s (2070–2099).
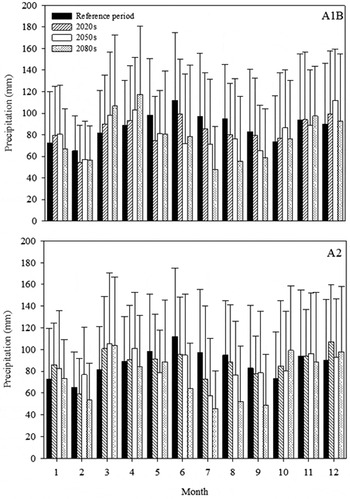
The comparison between monthly precipitation data for the reference period and those obtained as a result of climate change projections based on A1B and A2 IPCC SRES is given in Fig. 2. An overall decrease in precipitation is expected with both scenarios. In the case of A1B SRES, on an annual basis compared with the reference period, precipitation will decrease by 44·8, 58·9 and 115. 5 mm in the 2020s, the 2050s and the 2080s, respectively. In the case of A2 IPCC SRES, the precipitation decrease will be low during the 2020s and the 2050s (3·2 and 30 mm, respectively) but high in the 2080s (151 mm). On a monthly basis, in the case of A1B SRES, precipitation will increase in March and April (from 81·6 to 106·6 and from 88·9 to 117·4 mm, respectively) and decrease thereafter from May to September. A particularly noticeable drop in precipitation from 111·8 to 78·6 mm is expected for June (the wettest month in the study area). In the case of A2 SRES, precipitation will increase in March (from 88·9 to 103·9) but decrease slightly in April and May. A very strong reduction in precipitation is foreseen for June (from 111·8 to 64 mm), July (from 97·2 to 45·6 mm) and August (from 94·9 to 52 mm).

Fig. 2. Average monthly precipitation with standard deviation for the reference period (1961–1990) and three future time periods (the 2020s, the 2050s and the 2080s) based on the A1B (a) and A2 (b) SRES projections.
Increases in air temperature compared with the reference period were observed for both projections and it was greater during the second half of the 21st century, especially for A2 SRES. In fact, the temperature increase projection was greater for A1B than for A2 SRES in the 2020s and the 2050s. In comparison with the reference period, the air temperature projection for A1B was 1·2 and 2·8 °C greater, respectively, for the 2020s and the 2050s, whereas it was 1·0 and 2·4 °C greater for the A2 IPCC SRES, respectively. By the end of the 21st century, air temperature will be 4·5 and 5·0 °C greater for A1B and A2, respectively, compared with the reference period.
Maize growth simulations were run for several sowing date options: (i) the current optimal time from 20 April to 10 May (Biancalani et al. Reference Biancalani, Predić, Leko, Bukalo and Ljuša2004), (ii) minimum temperature T min fixed at 8 °C for 3 successive days; (iii) mean temperature T mean of 10 °C for 5 and 7 successive days. The obtained sowing dates were in the range of 21 April–7 May, which is in agreement with current field management practices for the study area. Therefore, these criteria were adopted to simulate water requirements and yield in the reference period and future climate periods. The criterion of rainfall was not considered for the sowing date definition because the soils are wet as a result of snow melting and sufficient amounts of precipitation in autumn–winter–spring season. In this regard, a common practice is to start sowing when total available soil water is about 90%, which was chosen as initial soil moisture in all simulations.
According to the results of the calibration data set, the moderate fertility option was used in the input files (organic carbon 11–18·5 g/kg, pH in water 5·0–6·0, <1 mg/kg phosphorus pentoxide, 1–1·5 mg/kg potassium oxide, >20% of nitrogen) of field management practices for simulation of maize growth in the reference and future time periods.
Supplemental irrigation of maize is considered as the most appropriate field management practice for the climate conditions of Bosnia and Herzegovina. The irrigation file was created by choosing the sprinkler method for all simulations. Irrigation scheduling was based on the following criteria (of soil water content in the root zone): (i) irrigation starts when 80% of the readily available water is depleted, and (ii) the amount of water to replenish soil reservoirs should be up to −30 mm below field capacity (FC) to allow for any effective rainfall contribution after or during irrigation, which often happens in Bosnia and Herzegovina.
The ‘water footprint’ concept is important in climate change assessment, as an early warning against jeopardizing natural water resources when the blue-to-green water ratio starts to increase (Hoekstra Reference Hoekstra2008; Mekonnen & Hoekstra Reference Mekonnen and Hoekstra2010; Čuček et al. Reference Čuček, Klemeš and Kravanja2012). In the current study, the ‘water footprint’ was assessed by comparing the ratio between blue and green water used in maize growth during the reference period and in the future. Blue water represents the total water added by irrigation in one process step of maize production and the blue water footprint (WFblue) was calculated as:
 $${\rm W}{\rm F}_{{\rm blue}}{\rm = Blu}{\rm e}_{{\rm WE}}{\rm \,+\, Blu}{\rm e}_{{\rm WI}}{\rm \,+\, Los}{\rm t}_{{\rm RF}}[{\rm volume/time}]$$
The denominators WE and WI referred to water used for the evaporation process and water used for incorporation into the product (i.e. transpiration), respectively. LostRF represents part of the return flow lost by deep percolation and/or runoff that is not available for reuse within the same catchment in the same period of withdrawal, i.e. maize growth cycle.
Green water is the volume of rainwater consumed during the growing cycle. It refers to the total rainwater evapotranspiration and the green water footprint (WFgreen) is calculated as:
 $${\rm W}{\rm F}_{{\rm green}}{\rm \,= Gree}{\rm n}_{{\rm WE}}{\rm \,+\, Gree}{\rm n}_{{\rm WI}}[{\rm volume}/{\rm time}]$$
The parameters of Eqns (1) and (2) are estimated directly by AquaCrop model through the simulation of different scenarios.
Water productivity is analysed for the reference period and future scenarios and represents the ratio of final (commercial) yield to the amount of water used for actual evapotranspiration. It is estimated as:
 $${\rm WP} = \displaystyle{Y \over {{\rm E}{\rm T}_{\rm a}}}$$
where WP is water productivity (kg/m3), Y is yield (kg/ha) and ET a is actual evapotranspiration (m3/ha).
Data analysis
Several statistical methods were used to analyse and compare yield data derived from field experiments and simulations.
The first was the root mean square error (RMSE) method:
 $${\rm RMSE} = \sqrt {\displaystyle{1 \over n}\sum\limits_{i = 1}^n {{(S_i - M_i)}^2}} $$
where S i and M i are simulated and measured values, respectively, and n is the number of observations.
The RMSE unit is the same for both variables and the goodness-of-fit of the model improves when RMSE tends towards zero.
Then, RMSE was scaled relative to the mean of the observed/measured values as:
 $${\rm NRMS}{\rm E} = \displaystyle{{{\rm RMSE}} \over {\mathop M\limits^ -}} $$
The coefficient of determination, R 2, is defined as the squared value of the Pearson correlation coefficient (Eqn (6)). It ranges from 0 to 1, with values close to 1 indicating a good agreement between simulated and measured data. R 2 is calculated as:
 $$R^2 = \left[ {\displaystyle{{\sum {(Mi - \overline {M\hskip 0.7pt} )} (Si - \overline {S\hskip 0.7pt} )} \over {\sqrt {\sum {{(Mi - \overline {M\hskip 0.7pt} )}^2\sum {{(Si - \overline {S\hskip 0.7pt} )}^2}}}}}} \right]^2$$
where  $\overline {S} $ and
  $\overline {M} $ are mean values of simulated and measured data, respectively.
The mean bias error (MBE) was used to indicate the under/overestimation of results of simulations by the model with respect to the measured values, as:
 $${\rm MBE} = n^{ - 1}\sum\limits_{i = 1}^n {(S_i - M_i)} $$
The index of agreement (d) was calculated using Willmott's (Reference Willmott1982) equation:
 $$d = 1 - \displaystyle{{\sum\nolimits_{i = 1}^n {{(S_i - M_i)}^2} } \over {\sum\nolimits_{i = 1}^n {{(\vert S_i - \overline {M{\rm }} \vert + \vert M_i - \overline M \vert)}^2} }}$$
The index of agreement is a descriptor and its values range from 0 to 1. The model simulation of the studied parameter improves as the value approaches 1.
In addition, the model efficiency (EF) determines the relative magnitude of the residual variance compared with the measured data variance (Nash & Sutcliffe Reference Nash and Sutcliffe1970; Moriasi et al. Reference Moriasi, Arnold, Van Liew, Bingner, Harmel and Veith2007) as:
 $${\rm EF} = 1 {\cdot} 0 - \displaystyle{{\sum\nolimits_{i = 1}^n {{(M_i - S_i)}^2}} \over {\sum\nolimits_{i = 1}^n {{(M_i - \overline M )}^2}}} $$
The EF was applied to indicate whether the square of the differences between model simulations and observations is as large as the variability in the observed data. If EF was equal to zero, then the measured mean value  $\overline {M}$ was a predictor as good as the model performance, while negative values of EF indicated that
  $\overline {M} $ was a better predictor than the model (Legates & McCabe Reference Legates and McCabe1999; Moriasi et al. Reference Moriasi, Arnold, Van Liew, Bingner, Harmel and Veith2007).
Results
The results of AquaCrop calibration for different sowing date scenarios are shown in Tables 2 and 3. Statistical indices demonstrated that the model performed well for all sowing date scenarios. The best results were obtained for the scenarios with T mean ⩾ 10 °C for 5 and 7 successive days with a negligible difference between the two scenarios. For simulation of climate projections, the sowing criteria of T mean ⩾ 10 °C for 7 successive days was accepted since, in the study area, the sowing activity usually lasts at least 7 days and an average air temperature of 10 °C is required to avoid late spring frosts. The accepted option (T mean ⩾ 10 °C for 7 successive days) is valid in areas under a moderate continental climate and is confirmed in the field management practice of Bosnia and Herzegovina.
Table 2. Data and yield (Ym) from experimental trials conducted in 2004–2013 and simulation results of calibration (Ys) of AquaCrop for different sowing dates
Y m, measured yield; Y s, simulated yield; T min, minimum temperature; T mean, mean temperature.
* Moderate soil fertility.
† Near optimal soil fertility.
‡ Non-limiting soil fertility (Agricultural Institute of Banja Luka).
Table 3. Statistical indices of calibration data set for moderate continental climate (Banja Luka area)
R 2, coefficient of determination; RMSE, root mean square error; NRMSE, Normalize root mean square error; MBE, mean bias error; d, index of agreement; EF, model efficiency.
The validation of data obtained from the regional climate model (EBU-POM) for simulations of historical climate data (reference period 1961–1990) was done through the AquaCrop model using calibrated sowing dates in scenarios with and without irrigation. The results showed that the climatic data obtained by the model properly simulated yield and water requirements using average data from a 30-year period. The difference in yield simulated by measured and modelled climatic data were increased by about 0·68 t/ha (10·7%) for the rainfed scenario and 0·64 t/ha for the irrigated scenario. The difference in simulated irrigation requirements was only 1 mm (107 mm compared with 106 mm for the simulation with measured and modelled climatic data, respectively). A year-to-year comparison between the simulation results of climate model data and the measured data is not appropriate, since the differences in mean values for yield and water requirements in the 30-year period are not climatologically significant.
The prospective anticipation of the sowing periods is shown in Fig. 3 for A1B and A2 SRES. There is a difference between climate change scenarios and the time period under consideration, which is 17 April. For A1B SRES, anticipation of the start of the growing season was 7 days earlier in the 2020s, while it was about 20 days for the 2050s and the 2080s. For the A2 scenario, anticipation of the sowing period was earlier than the reference period by 10, 20 and 31 days for the 2020s, the 2050s and the 2080s, respectively.

Fig. 3. Prospective sowing period anticipation for A1B and A2 scenarios and three future time periods (the 2020s, the 2050s and the 2080s).
In the reference period (1961–1990), the maize growth cycle lasted 158 and 164 days under rainfed and irrigated conditions, respectively. Under future climate conditions (Fig. 4), the maize growth cycle will be reduced in all scenarios and, for the rainfed cultivation, this reduction will be up to 27, 33 and 44 days in the 2020s, the 2050s and the 2080s, respectively. The reduction will be greater (3–5 days) under irrigated conditions compared with rainfed.
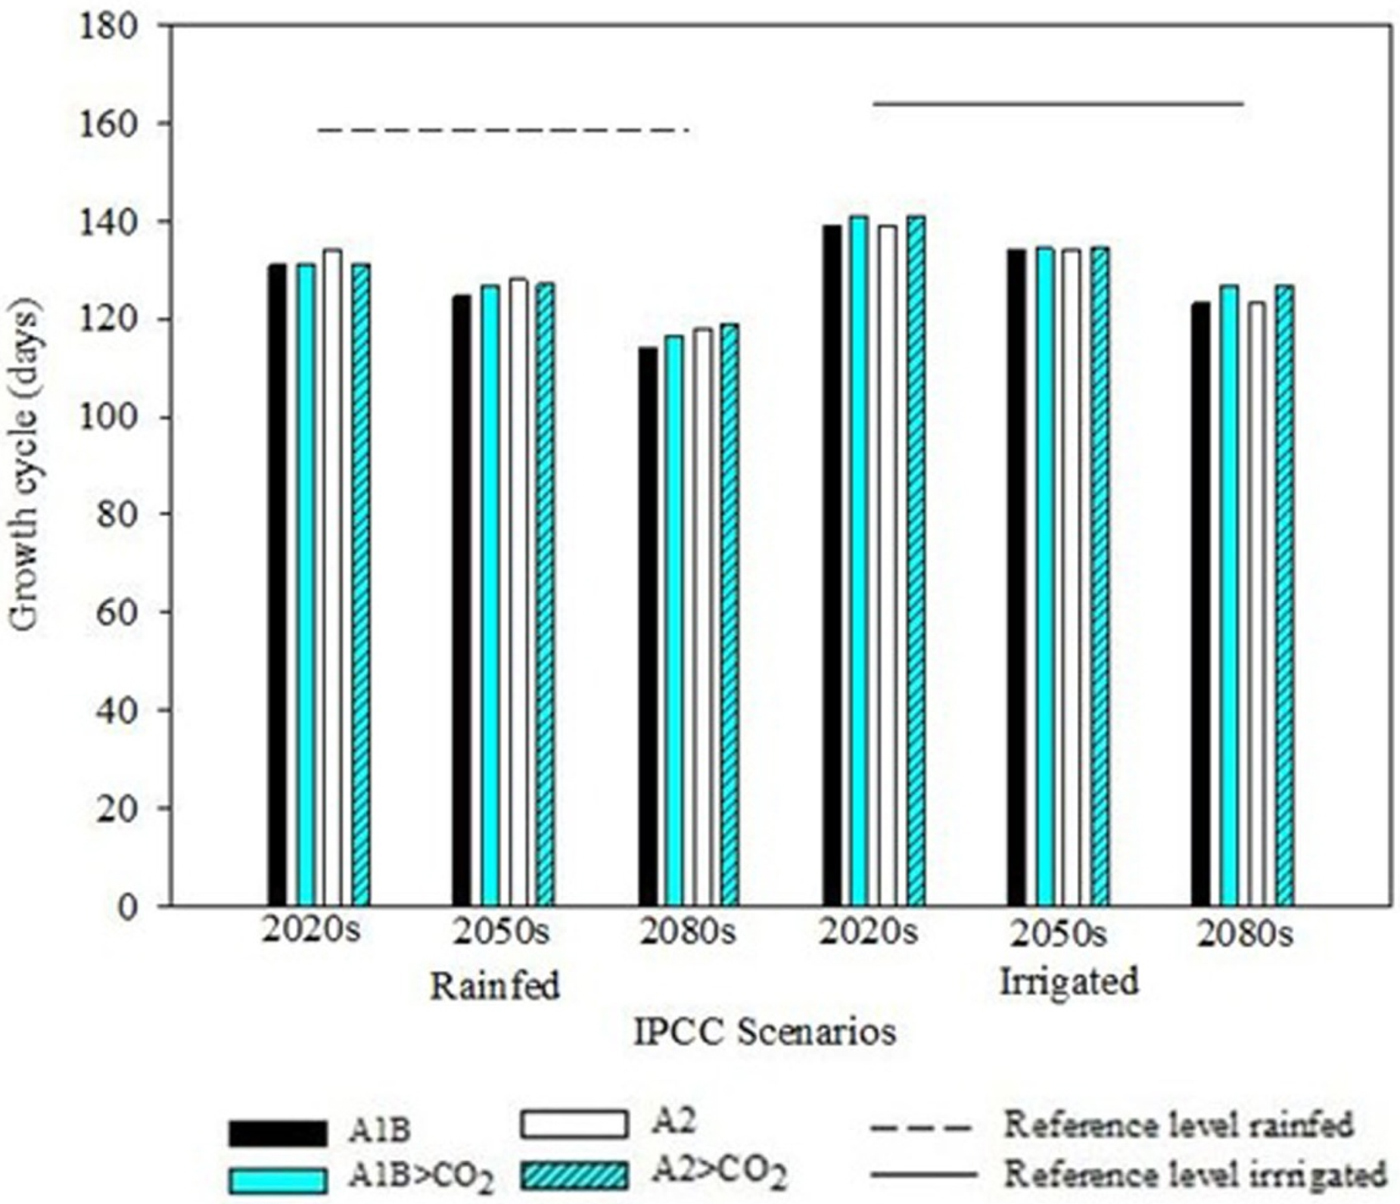
Fig. 4. Length of the maize growing cycle (in days) for different IPCC scenarios and three future time periods (the 2020s, the 2050s and the 2080s).
Maize evapotranspiration (ETc) will be lower in the future compared with the reference level of 635 mm (Fig. 5). For all scenarios, a progressive decrease in ETc with time was observed due to shortening of the growth cycle compared with the reference period. The reduction in crop ET will be greater under rainfed than irrigation scenarios. For rainfed cultivation, ETc will be reduced by 54, 71 and 114 mm in the 2020s, the 2050s and the 2080s, respectively, whereas the reduction will be 18, 24 and 54 mm in the 2020s, the 2050s and the 2080s under irrigated conditions, respectively. In both scenarios with elevated CO2, crop evapotranspiration will be slightly lower (up to 2% lower). This can be explained by faster canopy development and lower soil evaporation.
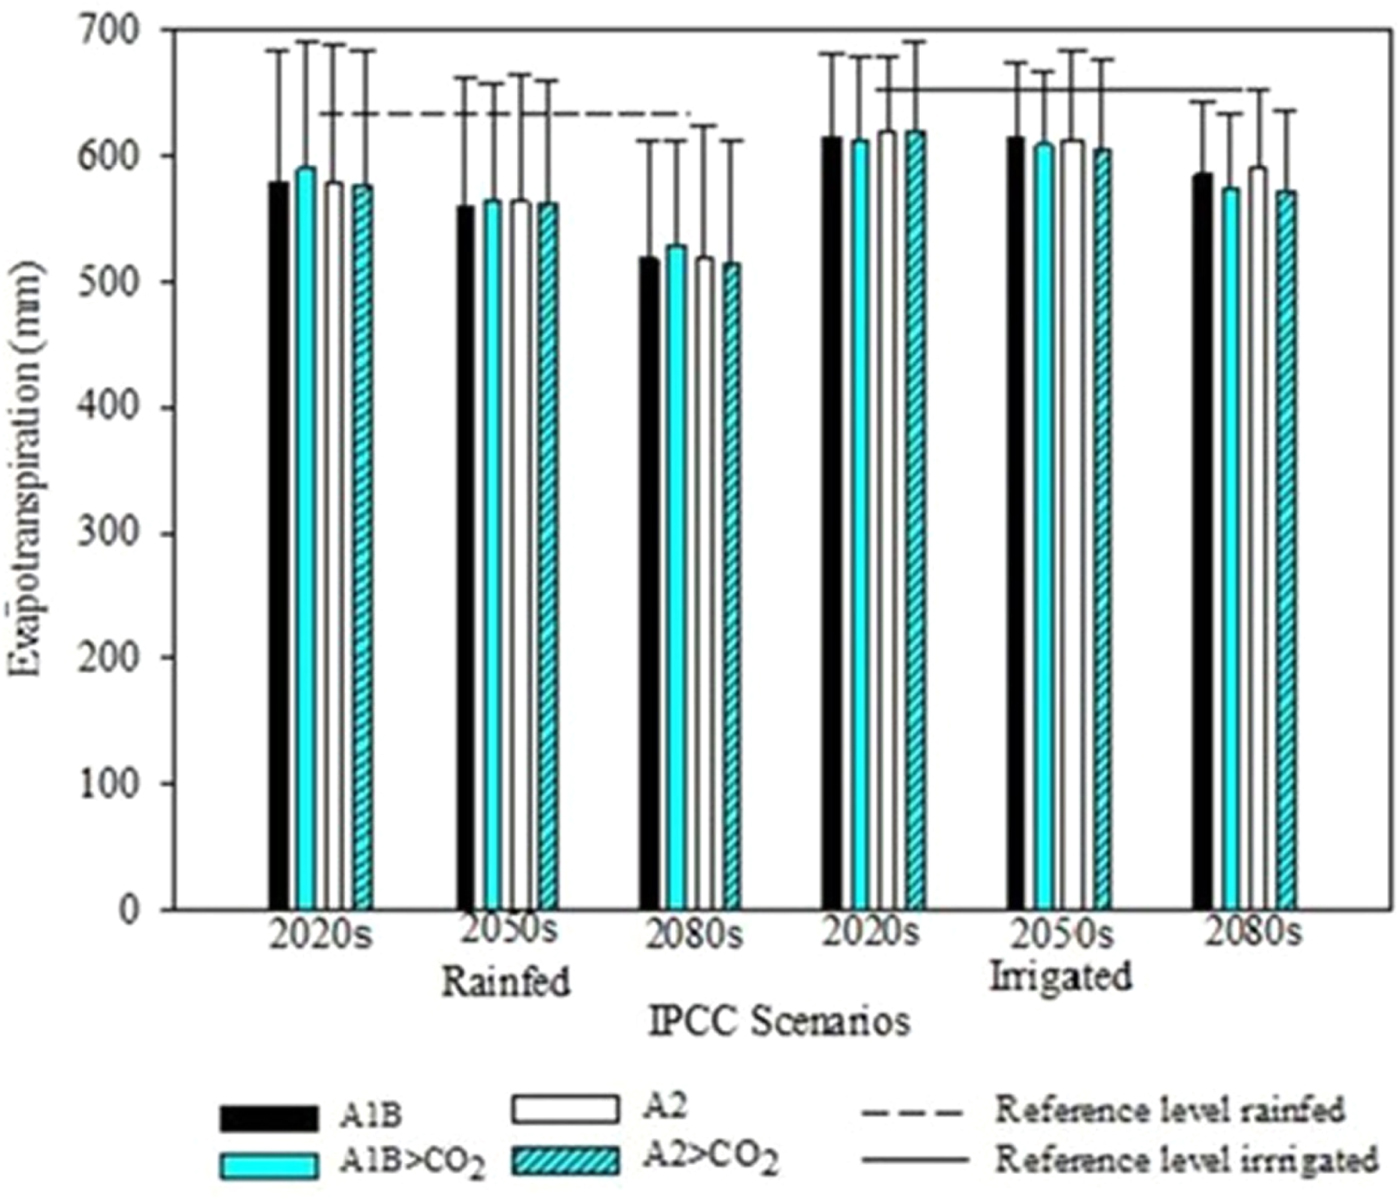
Fig. 5. Evapotranspiration of irrigated and rainfed maize (± standard deviation) for different IPCC scenarios and three future time periods (the 2020s, the 2050s and the 2080s).
Figure 6 reports the results of maize yield simulations in the future (2010–2099), for rainfed and irrigation water regimes, compared with the reference historical time period (1961–1990). It is evident that in the 2020s there is no reduction in yield under any scenario, with or without irrigation, compared with the reference period. Moreover, an increase in yield of up to 37·9% compared with the reference period can be expected in scenarios A1B and A1B > CO2 (both irrigated) and A2 > CO2 (rainfed and irrigated). In the 2050s and under rainfed cultivation, a slight yield reduction of 6·3% was observed for the A1B scenario, while the same scenario with enhanced CO2 showed a yield increase of 8%. For A2 and A2 > CO2 scenarios, an increase in yield of 3·1 and 8%, respectively, is expected. However, in the 2080s, yield reductions of 10·9 and 14% for scenarios A1B and A2, respectively, are expected under rainfed conditions. The same scenarios with enhanced CO2 indicated a yield increase of 5·6% in A1B and a decrease of 3·1% in A2 SRES.
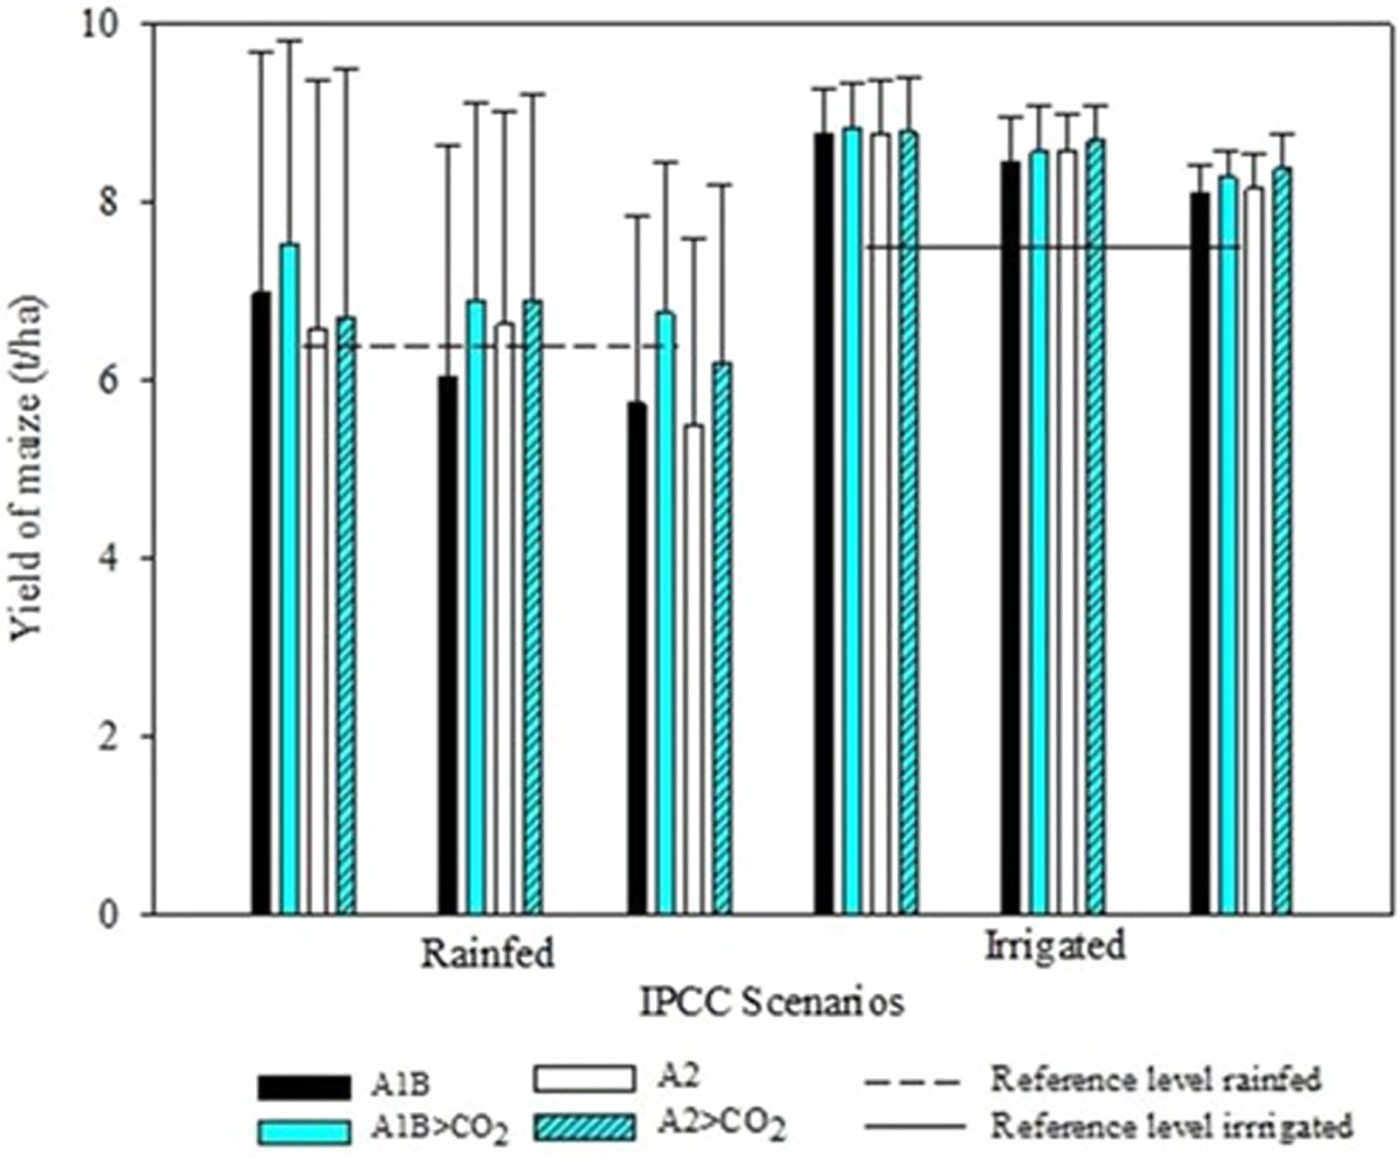
Fig. 6. Average yield of maize (± standard deviation) under different IPCC scenarios, water regimes (rainfed and irrigated) and three future time periods (the 2020s, the 2050s and the 2080s).
Irrigation requirements to avoid yield losses were estimated by AquaCrop for different SRES scenarios and time periods, and the results are given in Fig. 7. In comparison with the reference level (107 mm), irrigation needs will increase from 13 to 35 mm in the 2020s, up to 67 mm in the 2050s (scenario A1B) and up to 100 mm in the 2080s (scenario A2). This is in agreement with the expected reduction in precipitation in the May–July period, which will be particularly evident in the 2050s and the 2080s.
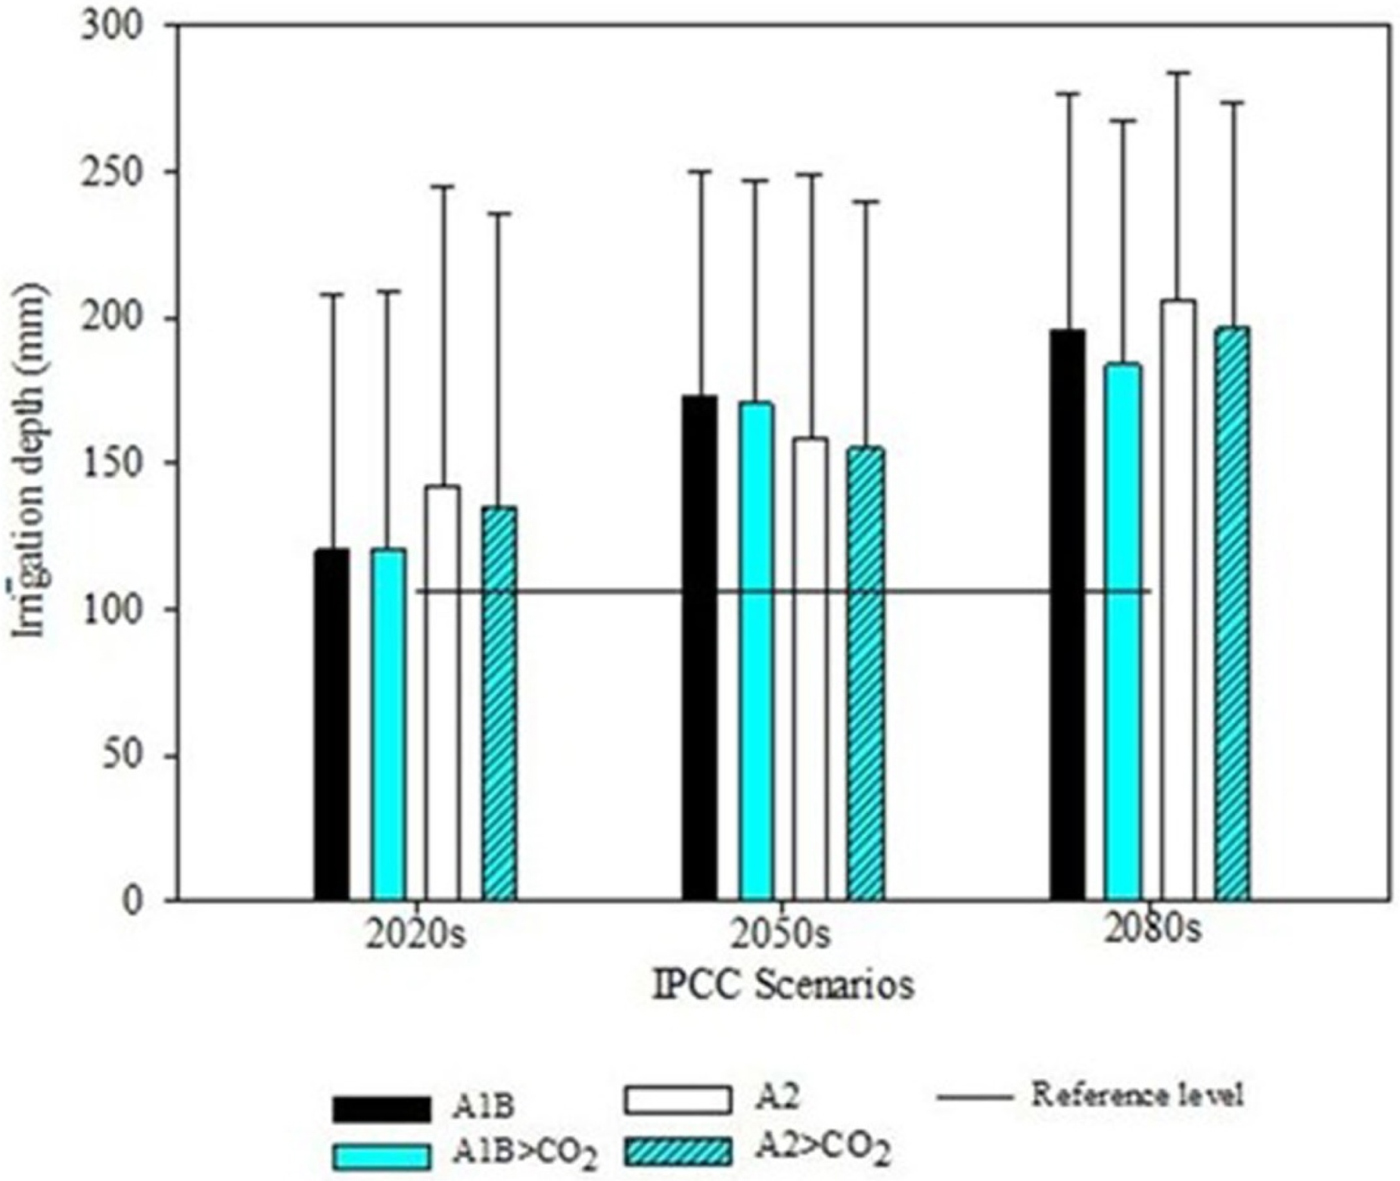
Fig. 7. Irrigation amounts (mm ± standard deviation) for different IPCC scenarios and three future time periods (the 2020s, the 2050s and the 2080s).
The ratio between blue and green water in rainfed conditions (data not shown) will increase slightly (0– 5%) in all periods in A1B scenarios and will be even slightly reduced in A2 scenarios. If irrigation is applied, the part of blue water will decrease compared with the reference period (0·22) in all scenarios during the 2020s, and in both A2 scenarios, it will remain almost the same during the 2050s. A lower value of blue water is not a consequence of reduced irrigation requirements; on the contrary, less backflow would occur, especially in A2 scenarios, due to the reduction in precipitation. The increase of blue water from 0·22, in the reference period, up to 0·28 in the 2050s and the 2080s could be expected in the A1B scenario (Fig. 8). However, in A1B > CO2 scenarios, the part of blue water could be much higher (up to 0·44 in the 2080s) due to the significant anticipation of sowing and backflow of spring rainfall (in March and April, when an increment in rainfall is expected). These results implicate a positive ecological impact, although they refer to a small amount of blue water.
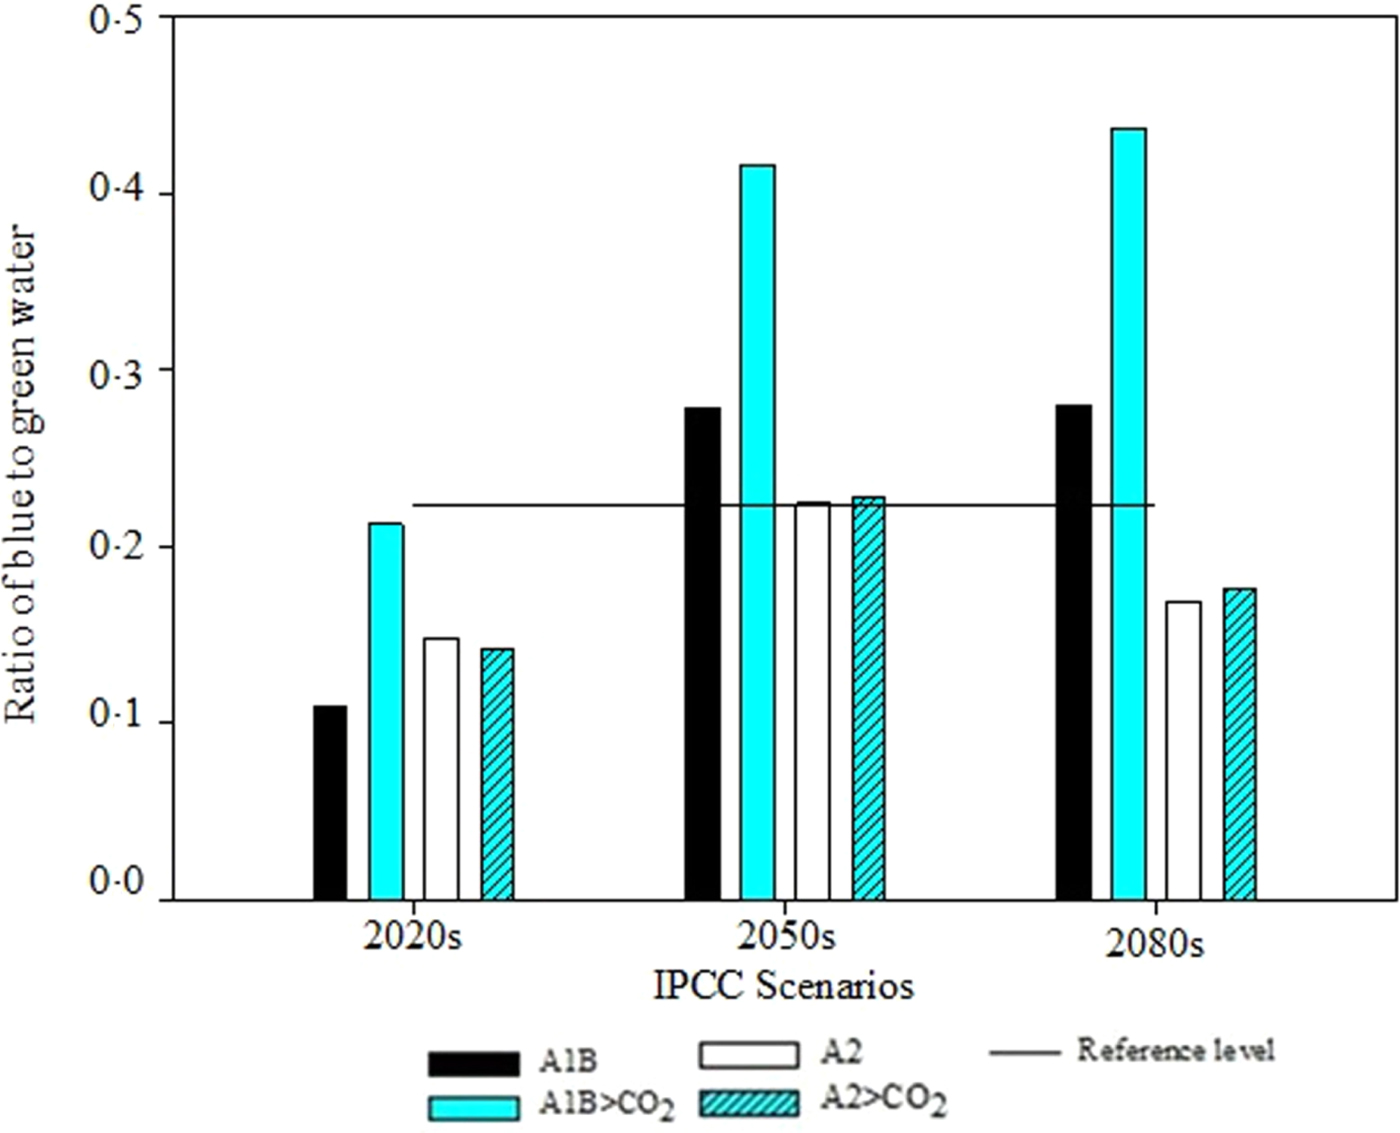
Fig. 8. Ratio of blue-to-green water for different IPCC scenarios and time periods (the 2020s, the 2050s and the 2080s).
The ratio of productive and non-productive green water will stay almost at the reference level of 0·49, with variations of ±0·02 in all IPCC scenarios. Although the blue water percentage will increase in future climate scenarios, equally the productive use of water will increase in comparison with the reference period (Fig. 9). These results are expected in that supplemental irrigation is applied only in critical periods of the growth cycle, to avoid yield losses. Therefore, with supplemental irrigation and limited water supply below the level of FC, irrigation will be more efficient and maize yield will increase in the same way as the productive use of blue water. Return flow, as well as the non-productive use of water (e.g. evaporation of water stored in the root zone), will remain at the same level (an almost negligible amount). Lower productivity of blue water occurred in scenarios with elevated CO2, due to higher productivity of green water. Differences in blue WP varied in range from 0·10 to 0·15 and a reduction in blue WP could be expected by the middle and the end of the 21st century compared with the 2020s. Nevertheless, it is still a small amount of water (variations are in the range of 7–50 mm).
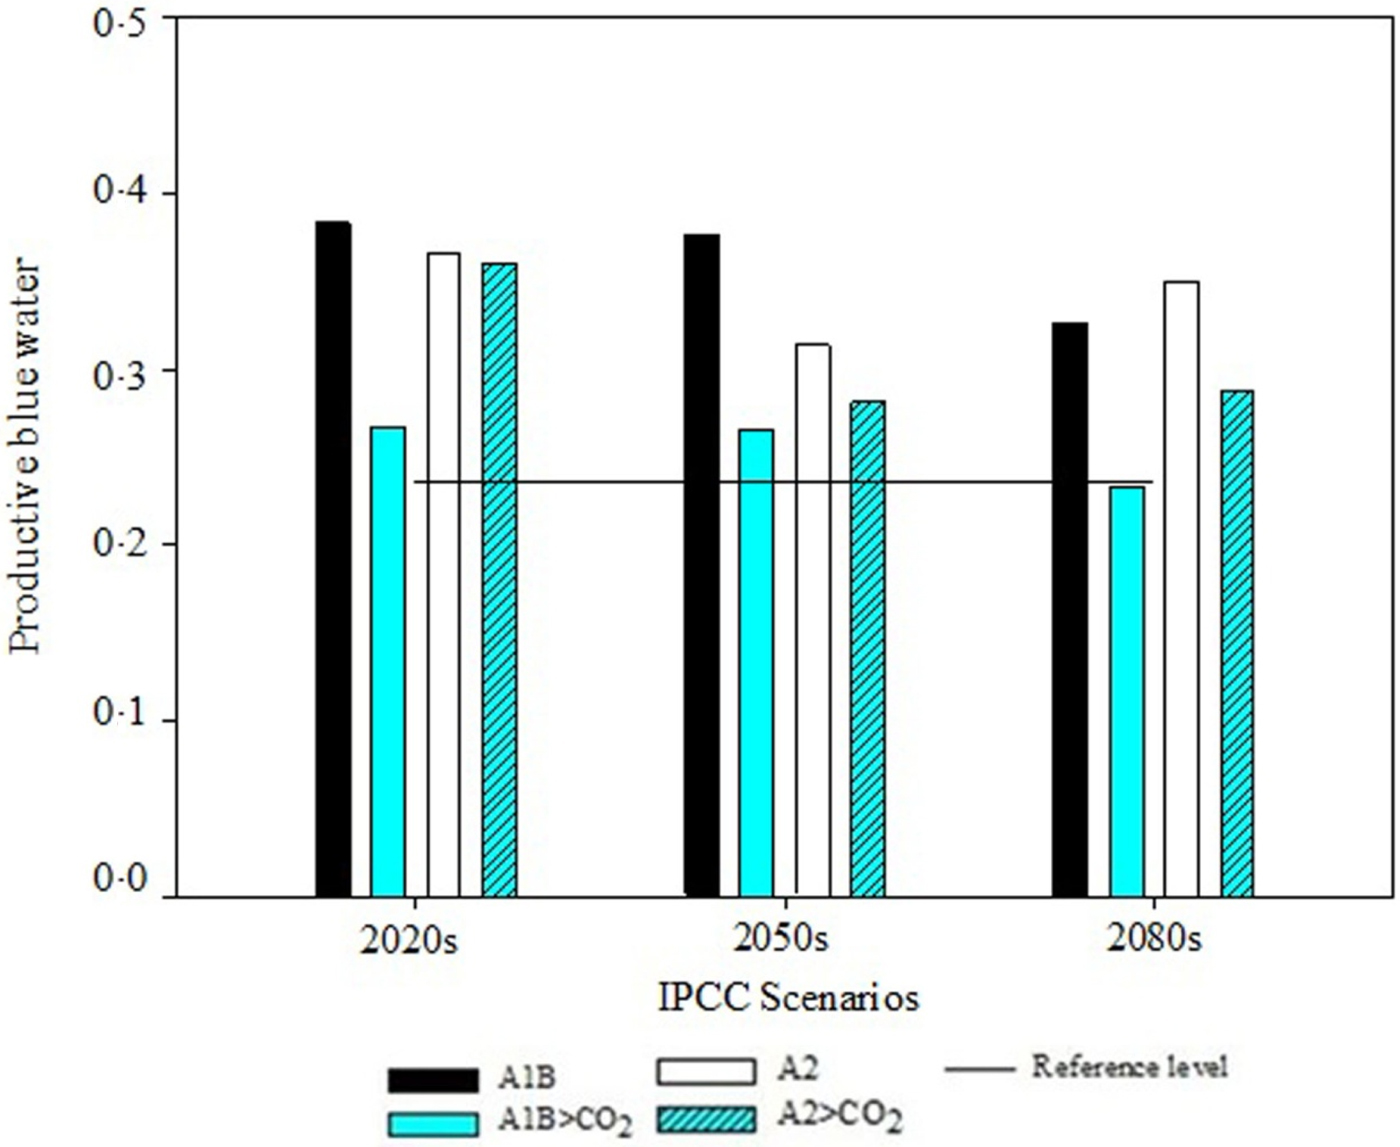
Fig. 9. Ratio of productive to total blue water.
Water productivity of maize is expected to increase for both rainfed and irrigation growing conditions and in all SRES scenarios (Fig. 10). The increment is greater under irrigated conditions (up to 42%), in comparison to rainfed (up to 21%). Moreover, for A1B and A2, WP of rainfed cultivation will decrease in the 2050s and the 2080s in comparison with the 2020s, which confirmed the need for irrigation of maize by the middle of the century.

Fig. 10. Water productivity of maize cultivation under different IPCC scenarios and growing conditions for three future time periods (the 2020s, the 2050s and the 2080s).
Discussion
The impacts of climate change will affect agricultural production in Bosnia and Herzegovina. Changes could be non-existent or slight at the beginning of the 21st century and moderate towards the end of the century. The increase in air temperature and shifting of the growing season earlier in spring together with the increase in CO2 concentration can help mitigate the negative impact of climate change. Similar results have been observed in surrounding regions and other countries, too. For instance, in Croatia, a 1-month reduction in the maize growing cycle is estimated till the end of the century (Vučetić Reference Vučetić2011). A slightly lower reduction was obtained in the Central Great Plains of Colorado (Islam et al. Reference Islam, Ahuja, Garcia, Ma, Saseendran and Trout2012), estimating 16, 24 and 29 days in the 2020s, the 2050s and the 2080s, respectively, emphasizing stronger reduction in the A2 scenario, as in the current study. Shortening of the growth cycle due to climate change and increasing air temperature was also estimated in other studies relating to northern and central European countries (Alexandrov et al. Reference Alexandrov, Eitzinger, Cajic and Oberforster2002; Finger et al. Reference Finger, Hediger and Schmid2011; Olesen et al. Reference Olesen, Børgesen, Elsgaard, Palosuo, Rötter, Skjelvåg, Peltonen-Sainio, Börjesson, Trnka, Ewert, Siebert, Brisson, Eitzinger, van Asselt, Oberforster and van der Fels-Klerx2012).
Earlier sowing, faster canopy development and lower soil evaporation will reduce evapotranspiration of maize. Similar results have been obtained by other studies (Islam et al. Reference Islam, Ahuja, Garcia, Ma, Saseendran and Trout2012; Bassu et al. Reference Bassu, Brisson, Durand, Boote, Lizaso, Jones, Rosenzweig, Ruane, Adam, Baron, Basso, Biernath, Boogaard, Conijn, Corbeels, Deryng, De Sanctis, Gayler, Grassini, Hattfield, Hoek, Izaurralde, Jongschaap, Kemanian, Kersebaum, Kim, Kumar, Makowski, Muller, Nendel, Priesack, Pravia, Sau, Shcherbak, Tao, Teixeira, Timlin and Waha2014) referring to different climatic conditions and confirming that the reduction in ET can be explained by shortening of the maize growth cycle.
The yield of maize will either remain the same or even increase in scenarios with elevated CO2 during the 2020s, while a slight decrease can be expected during the 2050s and 2080s. A similar yield trend over the same period of research was obtained in other countries with historically sufficient amount of precipitation that makes rainfed maize production possible (Finger et al. Reference Finger, Hediger and Schmid2011). In all the scenarios considered, application of irrigation will increase yield in comparison with the reference period.
Although irrigation will stabilize maize yield and mitigate inter-annual precipitation variability in the future, the question is whether this option would be economically justified. In fact, research work in Switzerland (Finger et al. Reference Finger, Hediger and Schmid2011) found that irrigation might be a measure of adaptation to climate change, since it could increase yield up to 20% compared with rainfed cultivation by the middle of the 21st century. However, the economic benefits from introducing irrigation were expected to be rather small.
The increase in blue water (due to the increased need for irrigation) compared with green water of maize was obtained in another study in northern Italy, comparing water footprints in the 2010s and the 2050s using the GCM ECHAM model (Bocchiola et al. Reference Bocchiola, Nana and Soncini2013). The results were similar to the present research for A1B SRES.
The current study confirmed the results of other authors (Trnka et al. Reference Trnka, Dubrovský and Žalud2004; Kersebaum et al. Reference Kersebaum, Mirschel, Wenkel, Manderscheid, Weigel, Nendel and Utset2009) who concluded that increased CO2 concentration has a favourable impact on the efficient use of water and nutrients, which contributes to higher yield under climate change. Moreover, due to the reduction in precipitation, less water surplus (non-productive flow) is expected, which has a positive impact on WP.
Conclusion
The results of the current study indicate that in the next 20 years, there will be no significant changes in yields and irrigation requirements of maize grown in north-western Bosnia and Herzegovina. This is due to the increase in air temperature and the anticipation of the sowing date early in spring. This will permit a shift in the critical growing period from July to June (statistically the wettest month) when water in the soil is still readily available – and reduce the risk of water and heat stress. Water productivity will remain high, even in rainfed maize cultivation. A slightly larger negative impact of climate change will be felt by the mid-century and a larger one at the end of the century. It is definitely expected that irrigation of maize will become common practice in the future, especially in the second half of the century. The anticipation of sowing date to early spring is certainly a measure to mitigate the negative impact of climate change in the study area. However, experts should plan anticipation of the sowing date using seasonal weather forecasts in order to avoid the risk of late frost (Vukovic et al. Reference Vukovic, Vujadinovic, Djurdjevic, Stojicic, Djordjevic, Cvetkovic, Krzic, Ruml, Dacic, Jaksic, Dimkić, Mesinger and Berger2014). Irrigation could be particularly suitable to guarantee high and stable yield of maize, especially when it is cultivated on shallow soils and sloping land, as well as in the case of production of maize for seeds. Irrigation utilization certainly has to be thoroughly analysed because the experience of highly developed countries suggests that it may not be economically justified. The current study has confirmed that WP and the blue-to-green water ratio are expected to increase in the future, so that the increasing importance of the ecological aspects of maize cultivation is justified. Nevertheless, water footprint analysis should be extended over the whole year and watershed to consider the complex dynamics of interlinks between various water sectors and management strategies.
Financial support
This research was performed in the frame of the Master of Science Program in ‘Land and Water Management: Irrigated Agriculture’ organized by the International Centre for Advanced Mediterranean Agronomic Studies (CIHEAM) – Mediterranean Agronomic Institute of Bari (Italy).