


Sarcopenia is characterised by a decline in skeletal muscle mass, strength and physical function(Reference Cruz-Jentoft, Bahat and Bauer1) and affects about 10 % of adults over 60 years and 50 % of older adults over 80 years old worldwide(Reference Shafiee, Keshtkar and Soltani2). Adverse changes related to the development and maintenance of skeletal muscle (e.g. denervation and adaptations in motor units of type I and II muscle fibres, mitochondrial dysfunction and inflammatory, hormonal and nutritional changes) may accumulate throughout life, explaining the occurrence and progression of sarcopenia in older adults(Reference Cruz-Jentoft, Bahat and Bauer1).
Although related to ageing, sarcopenia may also occur early(Reference Sayer, Syddall and Gilbody3,Reference Sayer, Syddall and Martin4) due to ageing progression, sedentary lifestyle, inadequate nutrition and chronic, inflammatory, rheumatologic and neurological conditions(Reference Cruz-Jentoft, Bahat and Bauer1). Sarcopenia is considered an important predictor of mortality among older adults(Reference Bunout, Maza and Barrera5) and may also lead to decreased bone mineral density, functional disability, increased probability of falls, respiratory problems(Reference Bone, Hepgul and Kon6–Reference Tanimoto, Watanabe and Sun10) and increased healthcare costs(Reference Janssen, Shepard and Katzmarzyk11). Despite its recent recognition as a muscle disease by the International Disease Code (ICD-10-CM (M62.84))(Reference Anker, Morley and Von Haehling12), the underlying aetiology of sarcopenia remains unknown. Underlying factors (e.g. changes in the anthropometric trajectory) occur at all life stages, especially in countries where the nutritional pattern and accelerated population ageing are relevant, such as Brazil.
The anthropometric trajectory is the general pattern of body weight changes (i.e. transition from one state of body weight to another) that occurs throughout life. This pattern may represent an important marker of body change and includes the investigation of composition, risk of chronic non-communicable diseases and mortality in adults(Reference Cooper, Hardy and Bann13–Reference Shimazu, Kuriyam and Ohmori-Matsuda15). The anthropometric trajectory is even worrisome when low birth weight is present, which may be related to decreased skeletal muscle mass, slow muscle development(Reference Brown16–Reference Wang, Yi and Roebothan18), decreased muscle strength(Reference Dodds, Macdonald-Wallis and Kapasi19,Reference Ylihärsilä, Kajantie and Osmond20) and increased percentage of body fat(Reference Kensara, Wootton and Phillips21–Reference Yang and Huffman24) in the subsequent years of life.
Evidence indicates positive associations between excessive body weight and progression of sarcopenia(Reference Cooper, Hardy and Bann13,Reference Koster, Ding and Stenholm25) , prevalence of cardiometabolic diseases and conditions(Reference Cui, Truesdale and Bradshaw26,Reference Juhola, Magnussen and Viikari27) and increased risk of mortality(Reference Berentzen, Jakobsen and Halkjaer28) in adults. However, low body weight is considered a risk factor for sarcopenia, especially in older adults(Reference Soenen and Chapman29,Reference Zajacova and Ailshire30) .
Additionally, stable weight and maintenance of the ideal anthropometric status throughout life are strategies adopted by health promotion and prevention policies related to non-communicable and chronic diseases(Reference Bosomworth31–Reference Oliveira, Franceschini and Rosado33). Despite the evidence, literature lacks studies about the role of patterns of change in anthropometric trajectories throughout life (from birth to adulthood) and their influence on sarcopenia in adults.
Therefore, to overcome this gap and provide evidence for preventing the occurrence and progression of sarcopenia in adults, this study aimed to identify the anthropometric trajectories throughout life and analyse their association with the prevalence of sarcopenia. We hypothesised that patterns of anthropometric trajectories that initiated with low birth weight and changes to low weight are associated with the occurrence of sarcopenia in men and women from the Longitudinal Study of Adult Health (ELSA-Brasil) cohort.
Methods
Study design
This cross-sectional study used data from the largest observational and multicentre cohort in Latin America (ELSA-Brasil), which prospectively investigated diseases, chronic conditions and risk factors of 15 105 participants since 2008. A total of 1091 (7·2 %) participants did not answer the second call of the study (wave 2 from 2012 to 2014), and the loss to follow-up due to death comprised 223 (1·48 %) participants.
A sample of 14 014 civil servants aged between 38 and 79 years from three Brazilian regions (Northeast, Southeast and South) who answered the call to return to the investigation centres was considered for new data collection and exams (2012–2014) 4 years after the study baseline. Data were collected from the second wave of the ELSA-Brasil by a previously trained team of researchers using standardised instruments and procedures. The detailed study design and procedures are available in the literature(Reference Aquino, Barreto and Bensenor34–Reference Schmidt, Griep and Passos37).
Exclusion criteria were participants with no information about birth weight, weight at 20 years old and weight and height at baseline and after 4 years of follow-up. We also excluded participants without information about electrical bioimpedance analysis and handgrip strength from the second wave of the study; absence of limbs; use of metallic prostheses; changes in protocols for anthropometric (weight and height), bioimpedance analysis and handgrip strength measurements; bariatric surgery or those self-declared yellow or indigenous. After applying the eligibility criteria, we selected 9670 participants (Fig. 1).
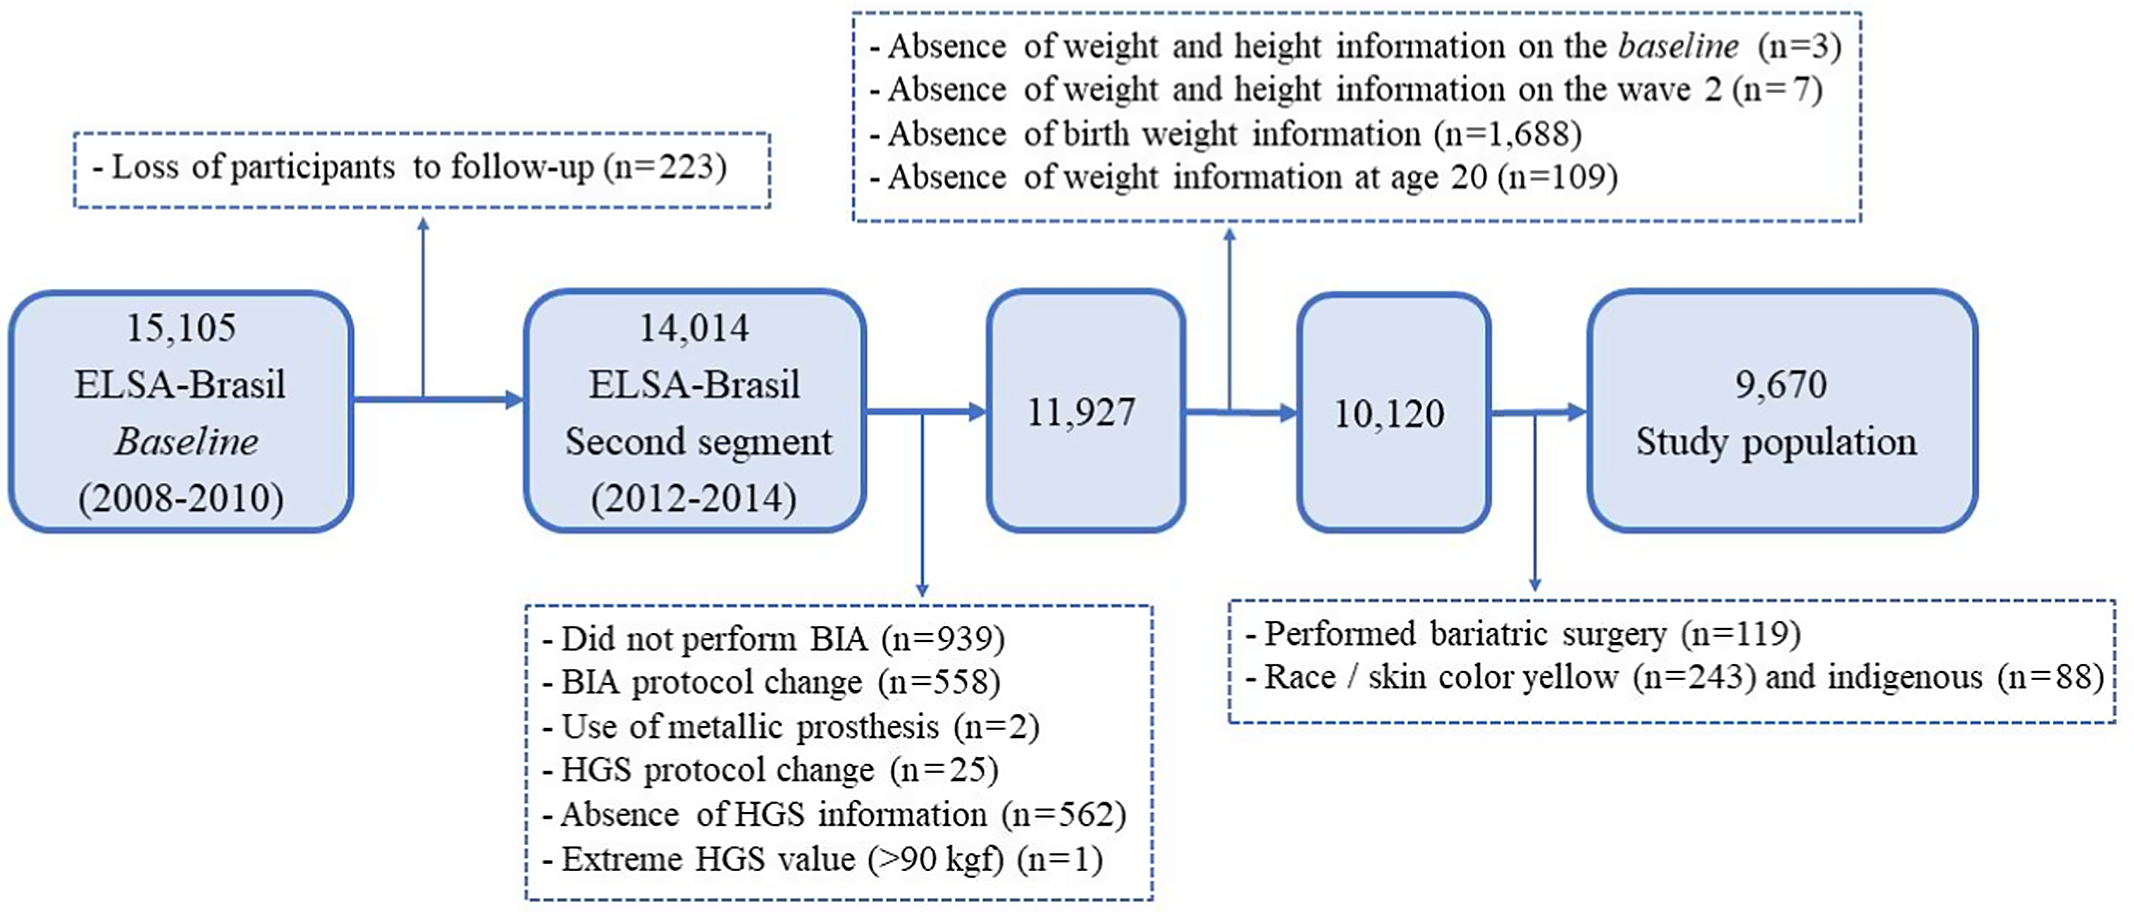
Fig. 1. Flow chart of selection of the study population. BIA, bioimpedance analysis; HGS, handgrip strength.
Ethical criteria
The study was approved by the ELSA-Brasil committee, the National Research Ethics Commission (CONEP No. 13065) and the research ethics committee of six affiliated centres: Oswaldo Cruz Foundation, Federal University of Bahia, Federal University of Minas Gerais, University of São Paulo, Federal University of Espírito Santo and Federal University of Rio Grande do Sul. The study protocol met all ethical requirements from the National Health Council (nº 196/96) for research involving humans. All participants signed the informed consent form(Reference Aquino, Vasconcelos-Silva and Coeli35).
Definition of the anthropometric trajectory (independent variable)
To examine the anthropometric trajectory of each participant, we gathered self-reported information about birth weight and weight at 20 years old (baseline) and anthropometric data (weight and height at baseline and 4 years after the follow-up) from the ELSA-Brasil.
Self-reported birth weight at baseline was categorised as low (< 2·5 kg), normal (between 2·5 kg and 4 kg) or overweight (≥ 4 kg) and used as an indicator of nutritional status and body mass in this period of life(Reference Yang and Huffman24).
BMI at 20 years old was calculated using the Quételet index (body weight in kg divided by height squared in meters (kg/m2)) according to self-reported weight and height. We used the weight and height obtained from the ELSA-Brasil to estimate BMI at baseline (2008–2010) and after 4 years of follow-up (2012–2014). The following cut-off points recommended by the World Health Organization(Reference Hodge, Shah and McCullough38) were adopted for BMI and considered for the trajectory analysis: low (BMI < 18·5), normal (BMI ≥ 18·5 and ≤ 24·9) and overweight (BMI ≥ 25).
Birth weight and BMI were also used to represent the anthropometric states according to three elements or categories of responses. The elements presented a uniform pattern in the four time points assessed (P) (low, normal and overweight). The variable patterns of anthropometric trajectory were developed to understand the different patterns of weight change throughout life according to the sequence of anthropometric states: birth weight (P1), transition at 20 years old (P2), baseline (P3) and approximately 4 years after the beginning of follow-up (P4).
Subsequently, four states were considered over time, with three corresponding elements in each state. Based on the number of states and evaluated elements, eighty-one possible patterns of combinations were estimated, and fifty-four different patterns of trajectory were identified. These patterns were regrouped into categories of trajectories that shared similar elements between the initial and final transition states. Based on the criteria for regrouping, five categories of anthropometric trajectories throughout life were defined: one characterised by a pattern of stable weight (i.e. without variation in the classification of body weight throughout life) (T1) and four characterised by different patterns of change in body weight. The latter included changes to normal weight, starting with low weight or overweight at birth and ending with normal weight (T2); changes to overweight, starting with low or normal weight and ending with overweight (T3); weight fluctuation, with a maintenance pattern throughout data collection periods and fluctuation during the trajectory (T4) and changes to low weight, starting with overweight at birth and ending with low weight (T5) (Table 1).
Table 1. Patterns of anthropometric sequences during the life course used to shape the trajectories. Longitudinal Study of Adult Health (ELSA-Brasil) (2008–2010) and (2012–2014)
(Numbers and percentages)

L, low weight; N, normal; O, overweight.
Definition of sarcopenia (dependent variable)
Sarcopenia was defined following the recommendations of the European Diagnostic Consensus for Sarcopenia in the Elderly and the International Working Group on Sarcopenia(Reference Cruz-Jentoft, Bahat and Bauer1,Reference Fielding, Vellas and Evans39) . In our study, cut-off points for reduced muscle strength and mass were estimated based on data from the ELSA-Brasil. We used specific cut-off points to categorise skeletal muscle mass decline based on data from young adults due to lack of criteria for defining and diagnosing sarcopenia in Latin American populations. Moreover, a subsample of younger adults (< 45 years) without chronic disease from the ELSA-Brasil at baseline was used to categorise skeletal muscle mass decline(Reference Baumgartner, Koehler and Gallagher40,Reference Janssen, Baumgartner and Ross41) .
Thus, this study considered sarcopenia if skeletal muscle mass index (skeletal muscle mass/height2) was reduced and handgrip strength was below the estimated cut-off point according to the age range for men and women in the ELSA-Brasil.
Handgrip strength
Handgrip strength was measured using the Jamar® dynamometer (Sammons Preston) adjusted in a single position for all participants (position three at the top and position two at the bottom at the gauge). Three measurements were performed on each hand, starting with the dominant hand, followed by the non-dominant hand. Participants comfortably sat in a chair with back and forearm support, shoulders slightly abducted, elbow flexed at 90° and thumb facing up. During the test, participants were verbally encouraged to perform as much strength as possible. For data analysis, we considered the best strength performance among measurements in each hand(Reference Roberts, Denison and Martin42).
Values below 42, 41, 38 and 35 kg in men and 26, 23, 23 and 21 kg in women ageing, respectively, 38–44, 45–54, 55–64 and ≥ 65 years indicated low performance.
Skeletal muscle mass
Skeletal muscle mass was measured by bioimpedance analysis (total skeletal muscle mass) using the Inbody 230® Bioimpedance equipment (Biospace Co., Ltd). Reduced skeletal muscle mass was considered if skeletal muscle mass index was lower than one standard deviation from the mean value of the younger adult group (< 45 years), which was skeletal muscle mass index < 10·03 kg for men and < 8·0 kg for women. The use of skeletal muscle mass index to categorise normal muscle mass and sarcopenia was suggested by Janssen et al. in a study conducted with data from the Third National Health and Nutrition Examination Survey(Reference Janssen, Baumgartner and Ross41).
All results were assessed according to the Manual of Procedures of Wave 2 for Anthropometry and Bioimpedance and the Manual of Isometric Force Measurement of Hand Grasping/ELSA-Brasil (2012) developed especially for ELSA-Brasil.
Covariates
Covariates were collected during an interview conducted using the ELSA-Brasil questionnaire(Reference Chor, Alves and Giatti36). Socio-demographic characteristics comprised age, expressed in years and categorised in ranges (38–54 years, 55–64 years and ≥ 65 years); skin colour (white, brown and black); education (elementary or high school, or higher education) and per capita income (family income categorised by tertiles based on the number of residents who depended on this income).
Leisure-time physical activity (yes or no) was measured according to the International Physical Activity Questionnaire-long form(Reference Matsudo, Araújo and Matsudo43). Participants who practised ≥ 150 min of moderate physical activity or walking or both/week, ≥ 60 min of vigorous physical activity or combined ≥150 min of walking with moderate and vigorous physical activity were considered active at leisure. Leading institutions recommend these cut-off points for promoting and maintaining health(Reference Haskell, Lee and Pate44,45) .
Other health-related behaviours were also considered in the analysis, such as excessive alcohol consumption (yes or no), categorised based on alcohol intake (≥ 210 g/week for men and ≥ 140 g/week for women)(Reference Duncan, Schmidt and Giugliani46); smoking (never smoked, ex-smoker or smoker); changes in diet to lose weight in the last 6 months (yes or no); use of vitamin and mineral supplements (yes or no) and short sleep duration, obtained from information on sleep time on a usual night (yes, ≤ 6 h; no, > 6 h)(Reference Di Milia, Vandelanotte and Duncan47).
Preterm birth (yes or no) was considered an ancestral variable of anthropometric trajectory exposure because it represented a direct cause of low birth weight. Information on clinical history of chronic diseases (cancer, chronic obstructive pulmonary disease and liver or kidney disease) reported at the study baseline was considered for the variable presence of debilitating chronic diseases (yes, prevalence of these diseases; no, absence). The covariates age at menarche (< 12 or ≥ 12 years) and menopause (yes or no) were also considered for women.
Data analysis
A theoretical model for analysing the causal effect between anthropometric trajectory and sarcopenia was prepared based on directed acyclic graphs (DAG) using the software DAGitty 2·3 ® (Fig. 2). The DAG allows to graphically represent theoretical assumptions regarding associations between exposure and outcome and adequately control confounding factors considered in the causal model(Reference Foraita, Spallek, Zeeb, Ahrens and Pigeot48). Based on heuristic rules, the proposed DAG to estimate the total effect of the anthropometric trajectory on the occurrence of sarcopenia considered a minimally sufficient adjustment set(Reference Evans, Chaix and Lobbedez49) of variables, such as leisure-time physical activity, presence of debilitating chronic diseases, diabetes, sleep duration, age group, skin colour and menopause (women).

Fig. 2. Directed acyclic graphs (DAG) for association between change pattern in anthropometric trajectory during the life course of life and sarcopenia for men (a) and women (b). ![]() , Exposure;
, Exposure; ![]() , Outcome;
, Outcome; ![]() , Ancestor of exposure;
, Ancestor of exposure; ![]() , Ancestor of outcome;
, Ancestor of outcome; ![]() , Ancestor of exposure and outcome;
, Ancestor of exposure and outcome; ![]() , Adjusted variable;
, Adjusted variable; ![]() , Unobserved (latent);
, Unobserved (latent); ![]() , Other variable;
, Other variable; ![]() , Causal path;
, Causal path; ![]() , Biasing path.
, Biasing path.
All analyses were stratified by sex and considered differences in the proportion of skeletal muscle mass between men and women. Data sequence analysis using the sq command in the Stata® MP software (version 14.0) identified the main trajectories among participants to identify changes in anthropometric trajectories throughout life. This procedure of combinatorial data analysis has been used to analyse health risk factors throughout life(Reference Abbott and Tsay50,Reference Brzinsky-Fay and Kohler51) in epidemiological studies. Sequences of patterns of change in anthropometric trajectory were used as predictive variables for sarcopenia in men and women from the ELSA-Brasil cohort.
A descriptive analysis characterised sarcopenia and the anthropometric trajectory according to study covariates. Differences between groups were identified using Pearson’s χ 2 test, adopting a P-value ≤ 0·05. Poisson regression with robust variance was used to test the crude and total effect models, considering the minimum adjustment suggested by the DAG for the association between exposure (anthropometric trajectory throughout life) and outcome (sarcopenia). The prevalence ratio (PR) and 95 % CI were estimated. The Stata®, version 14.0, software was used for the statistical analysis.
Results
A total of 4448 (46·00 %) men and 5222 (54·00 %) women were included in this study. Table 1 shows the five most frequent anthropometric trajectories among the fifty-four pattern sequences identified. Anthropometric trajectories were classified based on patterns of change in BMI categories (i.e. increase, decrease, stable and body weight fluctuation). Patterns of change to overweight (63·90 %) and stable weight (17·08 %) throughout life were the most frequent; the former was also the most prevalent: 65·20 % of men and 62·79 % of women (Graph 1).

Graph 1. Sequence patterns of anthropometric trajectories identified at different points in the life course of men (a) and women (b) of the ELSA-Brasil cohort (2008–2010) and (2012–2014), according to state of sarcopenia
Table 2 presents significant differences in the prevalence of sarcopenia in the studied population. Most men (41·90 %) and women (43·26 %) younger than 55 years old had sarcopenia; 62·04 and 72·63 % self-reported white skin colour, respectively. A total of 58·67 % of women with sarcopenia reported sleeping > 6 h/night, 74·81 % had menopausal status and 35·20 % had debilitating chronic diseases. Moreover, 40·20 % had an anthropometric trajectory marked by stable weight, 24·68 % by weight fluctuation and 21·12 % by change to overweight. Regarding men with sarcopenia, 12·12 % reported diabetes, while 37·15 % had an anthropometric trajectory of stable weight, 24·42 % changed to overweight and 23·60 % of weight fluctuation. A total of 82·59 % of patients with sarcopenia started the anthropometric trajectory with normal weight and 13·08 % with low birth weight.
Table 2. Prevalence of sarcopenia according to characteristics of men and women participating in the Longitudinal Study of Adult Health (ELSA-Brasil) (2012–2014)
(Numbers and percentages)

* P < 0·05.
The analysed data met the criteria for using the χ 2 test (less than 20 % of the expected frequencies were <5 and no cell has an expected value <1).
Tables 3 and 4 show the patterns of anthropometric trajectory according to the minimally sufficient adjustment covariates selected in the DAG. Most men and women aged between 38 and 54 years, self-declared white, were not active during leisure time and did not present a significant prevalence of debilitating chronic diseases. Most women reported short sleep duration and menopausal status. Data showed significant differences between patterns of change in anthropometric trajectory and physical activity during leisure time (P = 0·05). We also observed that most active men had a pattern of stable weight (54·38 %) and weight fluctuation (50·08 %). Patterns of change to overweight and low weight were more frequent among inactive men. A high frequency of diabetes was observed in men with a trajectory of change to overweight (9·93 %) and weight fluctuation (7·40 %). Furthermore, 10·41 % of men presented sarcopenia, which was significantly higher among those with a trajectory of change to low weight (61·54 %).
Table 3. Distribution of men participating in the study according to patterns of change in the anthropometric trajectory in the course of life. Longitudinal Study of Adult Health (ELSA-Brasil) (2008–2010) and (2012–2014)
(Numbers and percentages)

* The analysed data tended to the criteria for using the χ 2 test (less than 20 % of the expected frequencies were <5 and no cell has an expected value <1).
Table 4. Distribution of women participating in the study according to patterns of change in the anthropometric trajectory in the course of life. Longitudinal Study of Adult Health (ELSA-Brasil) (2008–2010) and (2012–2014)
(Numbers and percentages)

* The analysed data met the criteria for using the χ 2 test (less than 20 % of the expected frequencies were <5 and no cell has an expected value <1).
Regarding women, the trajectories of change to normal weight and weight fluctuation were significantly more frequent in those younger (53·53 and 53·58 %, respectively), white (59·24 and 61·42 %) and who presented insufficient leisure-time activity (53·53 and 58·16 %), short sleep duration (51·67 and 52·23 %) and menopausal status (63·07 and 66·40 %). Patterns of stable weight and change to overweight were more frequent among young women (58·41 and 49·01 %), white (69·57 and 53·42 %) and in menopausal status (60·66 and 73·22 %). Additionally, the pattern of change to overweight was more frequent among women insufficiently active in leisure time (65·84 %) and with sleep duration > 6 h (50·47 %), whereas the highest frequency of stable weight was observed among those sufficiently active at leisure time (52·09 %) and with sleep duration ≤ 6 h (55·47 %). Patterns of change to low weight were higher among women aged between 55 and 64 years (50·00 %), white (67·86 %), insufficiently active (75·00 %) and in menopausal status (82·14 %). A high prevalence of diabetes was also observed in participants with a pattern of change to overweight (9·10 %) and normal weight (7·88 %). Sarcopenia was observed in 7·52 % of women and was more frequent in trajectories with a pattern of change to low weight. The differences observed in women were statistically significant, except for excessive alcohol consumption and presence of debilitating chronic diseases (Table 4).
Table 5 presents the results of Poisson regression with robust variance for the association between patterns of change in the anthropometric trajectory and occurrence of sarcopenia in men and women from the ELSA-Brasil. Sarcopenia in men and women was inversely associated with patterns of change to overweight (PR = 0·18; 95 % CI (0·15, 0·23) and PR = 0·15; 95 % CI (0·11, 0·19)) and weight fluctuation (PR = 0·76; 95 % CI (0·61, 0·96) and PR = 0·77; 95 % CI (0·61, 0·97)). Additionally, sarcopenia was 2-fold more frequent among men (PR = 2·73; 95 % CI (1·92, 3·88)) and women (PR = 2·28; 95 % CI (1·46, 3·56)) with a pattern of change to low weight. The associations observed in this study remained even after adjusting for the confounding factors suggested in the DAG.
Table 5. Crude and adjusted association between pattern of changes in the anthropometric trajectory in the course of life and sarcopenia in men and women. Longitudinal Study of Adult Health (ELSA-Brasil) (2008–2010) and (2012–2014)
(Prevalence ratios and 95 % confidence intervals)

* Crude model of the association between sarcopenia (outcome) and different patterns of change in the anthropometric trajectory throughout life.
† Total effect model (men) considering the minimum necessary adjustment suggested by the DAG – adjusted for leisure-time physical activity, presence of serious chronic diseases (chronic obstructive pulmonary disease, chronic kidney disease, liver disease, cancer), sleep duration, age group (years) and skin colour.
‡ Total effect model (women) considering the minimum necessary adjustment suggested by DAG – adjusted for leisure-time physical activity, presence of serious chronic diseases (chronic obstructive pulmonary disease, chronic kidney disease, liver disease, cancer), diabetes, sleep duration, age group (years), menopause and skin colour.
Discussion
The anthropometric trajectory characterised by a pattern of change to low weight was positively associated with sarcopenia in adult men and women from the ELSA-Brasil cohort, corroborating the literature(Reference Soenen and Chapman29,Reference Lera, Albala and Sánchez52–Reference Pelegrini, Mazo and Pinto54) . Our findings also showed that men with a pattern of change to low weight were less active during leisure time. Besides, the trajectory of change to low weight in women was more frequent in those aged between 55 and 64 years, white and experiencing menopause.
Differences in skin colour related to the pattern of change to low weight were also shown by Byrne et al. (Reference Byrne, Weinsier and Hunter55) and can be justified by the increased metabolism of organic tissue located in trunk and decreased amount of muscle tissue in the lower segments in white women(Reference Byrne, Weinsier and Hunter55). Additionally, the conditions observed in men and women with low weight may lead to inflammatory processes, metabolic alterations and increased energy uptake (i.e. degradation of amino acids stored in muscles), thus contributing to the increased occurrence of sarcopenia(Reference Argilés, Campos and Lopez-Pedrosa56–Reference Tyrovolas, Koyanagi and Olaya61).
An important point highlighted in our study was the association between low birth weight and sarcopenia in adulthood, in which most participants who started the anthropometric trajectory with low birth weight presented sarcopenia in adulthood regardless of the subsequent pattern of anthropometric trajectory. This result is consistent with literature and suggests a strong association between birth weight and increased fat mass(Reference Kensara, Wootton and Phillips21,Reference Victora, Sibbritt and Horta23) , reduced lean mass(Reference Brown16,Reference Sayer and Cooper17) and low muscle strength performance(Reference Dodds, Macdonald-Wallis and Kapasi19,Reference Ylihärsilä, Kajantie and Osmond20) in adults.
In Brazil, data from the birth cohort conducted in Pelotas (Rio Grande do Sul) showed a positive association between birth weight and muscle mass in early adulthood. Besides, the study by Victora et al.(Reference Victora, Sibbritt and Horta23) indicated that weight gain at the beginning of adulthood was associated with increased fat and lean mass. These relationships may be interpreted in the context of low- and middle-income countries, where birth weight and weight trajectory in the first 2 years of life are strong predictors of lean mass in adulthood(Reference Kuzawa, Hallal and Adair22). Birth weight was also an indicator of adverse outcomes related to body composition in adulthood in the ELSA-Brasil, with associations between low birth weight, diabetes and measures of glucose homoeostasis in men and women(Reference Yarmolinsky, Mueller and Duncan62).
The anthropometric trajectory with a pattern of change to overweight after 35 years old was a protective factor for sarcopenia, even after adjusting for confounding factors identified in the DAG. These results were similar to findings of Cooper et al. in a British birth cohort, in which increased BMI gains after 15 years old reduced the OR of sarcopenia by 65 %(Reference Cooper, Hardy and Bann13). According to authors, although excessive body mass may be a protective factor (OR = 0·35; 95 % CI (0·28, 0·43)) for maintaining skeletal muscle mass in adults (especially older adults), the quality of performance of this muscle mass may be impaired (OR = 1·47; 95 % CI (1·25, 1·74)) due to weight accumulation throughout adulthood.
Koster et al. also found increased skeletal muscle mass with weight gain in a study conducted with older adults aged between 70 and 79. However, after 7 years of follow-up, men and women with increased body fat showed a more pronounced decline in muscle mass(Reference Koster, Ding and Stenholm25) and greater damage to the quality of muscle performance with weight gain, indicating that increased lean mass in individuals with excessive weight does not improve muscle performance. Besides, inflammatory changes and insulin resistance caused by increased adipose tissue may explain the fast decline in muscle mass. These changes may contribute to muscle mass decline in older adults since the metabolic load in muscles of individuals with overweight may overcome the ability to synthesise the stored protein(Reference Argilés, Campos and Lopez-Pedrosa56,Reference Cauley63) .
Chronic diseases may also lead to inflammatory and metabolic processes and pronounced loss of muscle mass and strength, even in individuals under adequate diet(Reference Cauley63,Reference Biolo, Cederholm and Muscaritoli64) . According to previous evidence, chronic diseases may increase the lean mass decline by 4·5–30 % compared with the normal loss attributed to ageing. Additionally, diabetes enhances this decline by approximately 30 %(Reference Buford, Anton and Judge57), corroborating the increased prevalence of sarcopenia in men with diabetes from our study.
The protective effect against sarcopenia among individuals with a pattern of change to overweight is supported by the fact that weight gain throughout life may reflect an increase in muscle mass, but not fat mass, especially if accompanied by physical activity. This effect may also indicate cyclical changes in dietary behaviour for weight loss. Nevertheless, the use of cross-sectional data cannot ensure that changes in physical activity and diet throughout life influence the pattern of change to overweight.
Weight stability, especially normal weight, and reduction of overweight are important strategies for health promotion and disease prevention(Reference Bosomworth31–Reference Oliveira, Franceschini and Rosado33), including sarcopenia(Reference Teixeira, Filippin and Xavier65). However, empirical data have considered a paradoxical relationship between weight gain and health, especially in middle-aged and older adults. The literature shows a favourable prognosis for some diseases and a low risk of mortality in adults with overweight compared with normal or low weight(Reference Cetin and Nasr66–Reference McAuley and Blair69). Despite that, improvements in public health, technology and medical care may have reduced the impact of obesity on mortality, confusing the observed evidence.
Our findings also suggest an obesity paradox related to sarcopenia, similar to literature(Reference Wannamethee and Atkins70). This interaction may occur because obese individuals tend to have increased lean mass due to increased total body mass. Another explanation is that body weight gains due to reduced energy expenditure from ageing and sedentarism may be more pronounced than skeletal muscle mass decline. This would imply the preservation of muscle mass among those with a pattern of change to overweight during adulthood. In this sense, the risks related to overweight should be considered when formulating health promotion and prevention policies for chronic diseases, especially during adulthood. Furthermore, increasing evidence suggests a positive relationships between overweight and development of cardiometabolic disorders(Reference Cui, Truesdale and Bradshaw26,Reference Juhola, Magnussen and Viikari27) , increased risk of mortality(Reference Berentzen, Jakobsen and Halkjaer28,Reference Zajacova and Ailshire30) , worse muscle quality and pronounced lean mass decline during ageing(Reference Cooper, Hardy and Bann13,Reference Koster, Ding and Stenholm25) .
The combination of obesity and sarcopenia characterises sarcopenic obesity. Although its diagnosis is not currently standardised, this condition has been associated with worse physical and functional status and increased risk of morbidity and mortality(Reference Chung, Kang and Lee71,Reference Kohara72) . Data revealed an increase of 23 % in the risk of CVD in individuals with sarcopenic obesity(Reference Stephen and Janssen73) and a prevalence of sarcopenic obesity of approximately 8 and 11-fold higher than isolated sarcopenia and obesity, respectively(Reference Baumgartner74). Although a recent study showed positive associations between excessive body weight, progression of sarcopenia and increased risk of mortality(Reference Batsis, Petersen and Crow75), future studies are needed to improve the understanding of these relationships.
This study was the first to identify patterns of anthropometric trajectory related to sarcopenia using a longitudinal design that included a large and nationally representative sample of civil servants of both sexes living in six Brazilian capitals. Literature lacks data regarding the effects of patterns of change in anthropometric trajectories from birth to adulthood, the variability of these trajectories and their effects on the occurrence of sarcopenia in adults. The suggested relationships were based on specific anthropometric measurements collected at specific time points without considering the trajectory of change throughout life(Reference Lera, Albala and Sánchez52–Reference Pelegrini, Mazo and Pinto54).
Only one study using data from the British birth cohort demonstrated the influence of BMI trajectory from 15 years old on the quantity and quality of muscle mass at early old age(Reference Cooper, Hardy and Bann13). Our findings partially corroborate this study since associations between patterns of anthropometric trajectory and muscle mass quality were not investigated in our study.
This study has some limitations. Our findings should be cautiously considered for the general population of Brazilian adults since data were extracted from a population of civil servants sharing similar characteristics. Thus, worker bias cannot be ruled out. The patterns of change in anthropometric trajectory were partially based on self-reported information regarding birth weight (used to express muscle mass at this stage of life) and body weight at 20 years (used to calculate BMI). Although memory bias cannot be excluded, the validity of these measures has been indicated in studies with different socio-demographic groups(Reference Nilsen, Kutschke and Brandt76,77) .
Importantly, BMI does not discriminate body components; in contrast, it may reflect lean and fat mass changes and mitigate the probability of sarcopenia, suggesting an obesity paradox. Furthermore, the cut-off points used to categorise strength decline were adjusted by age group, while the estimation of decreased skeletal muscle mass was based on normative data from the younger adult population of the ELSA-Brasil, which might have overestimated the occurrence of sarcopenia in the population.
The sample size related to the pattern of change to low weight was also considered a limiting factor in this study. However, the assumptions that defined the patterns of change based on sequence analysis may represent an initial advance for understanding the health consequences of different anthropometric trajectories throughout life. Further analyses of patterns of change considering the development of peak muscle mass throughout adulthood and using robust analytical strategies for longitudinal data could be incorporated in future studies on sarcopenia and other health outcomes obtained in the ELSA-Brasil.
We conclude that the increased occurrence of sarcopenia among men and women with an anthropometric trajectory characterised by changes to low weight and the protective effect observed in the pattern of change to overweight demonstrated muscle plasticity to adapt to body changes throughout life. This plasticity may also occur in adverse metabolic situations or due to ageing, illness and unhealthy lifestyles. In this sense, future investigations using longitudinal data obtained from the ELSA-Brasil are needed to assess the quality of muscle mass performance and progression of sarcopenia in participants with an anthropometric trajectory of change to overweight. Last, another valid topic for future research is the stage of life in which overweight and obesity would imply a high occurrence of sarcopenia.
Acknowledgements
The authors would like to acknowledge the ELSA-Brasil team.
The ELSA-Brasil study was funded by the Brazilian Ministry of Health (Science and Technology Department) and the Brazilian Ministry of Science, Technology and Innovation (FINEP and CNPq) (grant numbers: 01.06.0010.00 and 01.10.0643.03 (Rio Grande do Sul); 01.06.0212.00 and 01.10.0742-00 (Bahia); 01.06.0300.00 and 01.12.0284.00 (Espírito Santo); 01.06.0278.00 and 01.10.0746.00 (Minas Gerais); 01.06.0115.00 and 01.10.0773-00 (São Paulo); and 01.06.0071.00 and 01.11.0093.01 (Rio de Janeiro)).
C. A. S., S. M. M., H. M. and F. P. contributed to conception and design of the analysis, data analysis, writing and critical review. S. M. M. contributed to funding acquisition and investigation. M. J. F., P. L., E. A., I. B., R. G. and S. B. substantially contributed to study design and critical review of the article and methodology. S. M. M., H. M. and F. P. contributed to supervision and orientation.
There are no conflicts of interest.


