


Insulin resistance and reduced glucose tolerance are typically implicated in the aetiology of type 2 diabetes(Reference Reaven1), with an increasing degree of insulin resistance in young people(Reference Tagi, Giannini and Chiarelli2). Furthermore, the development of insulin resistance and type 2 diabetes in children and adolescents is associated with an increased risk of a number of co-morbidities, such as CVD, in later life(Reference Laitinen, Laitinen and Pahkala3,Reference Steinberger, Daniels and Eckel4) . Therefore, due to the potential concern for metabolic health across the lifespan, it is important to understand the factors that affect insulin resistance and glucose tolerance in young people. The postprandial response to an ecologically valid meal is an important marker of cardiometabolic health in young people and favoured over the more typically cited fasting markers(Reference DiNicolantonio, Bhutani and OKeefe5–Reference Lautt7). However, the factors that affect the magnitude of the postprandial glycaemic and insulinaemic response in young people are not well understood.
There are many risk factors associated with the development of type 2 diabetes, some of which can be easily modified through lifestyle behaviour change(Reference Tuomilehto, Lindström and Eriksson8). One of the contributing factors to the stark increase in the prevalence of type 2 diabetes is weight status, particularly central adiposity. This can be assessed in various ways (such as waist circumference, sum of skinfolds and BMI) and is considered an important risk factors for the development of insulin resistance and, subsequently, type 2 diabetes(Reference Tagi, Giannini and Chiarelli2,Reference Arslanian9,Reference Arslanian10) . Sex and pubertal status are also other risk factors during childhood (up to 11 years old) and adolescence (11–18 years old), given that there is a degree of pubertal insulin resistance, which may be of greater magnitude in females(Reference Cooper, Dring and Morris11–Reference Reinehr13); thus, it is particularly important to understand the association between risk factors of insulin resistance during adolescence, which has not been explored to date. Low physical activity and physical fitness are risk factors for the development of type 2 diabetes(Reference Aune, Norat and Leitzmann14) in adults and are also linked with poor cardiometabolic health in children and adolescents(Reference Ekelund, Luan and Sherar15).
Traditionally, fasting glucose and insulin concentrations are commonly used in models of insulin resistance, the most common being the homoeostatic model assessment of insulin resistance (HOMA-IR)(Reference Tagi, Giannini and Chiarelli2). However, it has been argued that the use of such measures do not appropriately screen for related conditions, like type 2 diabetes(Reference DiNicolantonio, Bhutani and OKeefe5–Reference Lautt7). Furthermore, HOMA-IR typically reflects hepatic insulin sensitivity and does not account for peripheral insulin sensitivity(Reference Abdul-Ghani, Matsuda and Balas16,Reference Muniyappa, Madan and Feingold17) . Instead, the use of a dynamic assessment of postprandial glycaemia and insulinaemia has been suggested, as a more sensitive marker of cardiometabolic health given that young people spend most of the awake time in the postprandial state.
One such method of assessing the postprandial glycaemic and insulinaemic response is the oral glucose tolerance test (OGTT)(Reference Muniyappa, Madan and Feingold17), whereby glucose and insulin concentrations are determined at 0, 30, 36 and 120 min following a standard glucose load (75 g), which has been used in adolescents previously(Reference Cockcroft, Williams and Tomlinson18,Reference Cockcroft, Williams and Weaver19) . Recent work in adolescents has examined the responses to mixed meals(Reference Dring, Cooper and Morris20–Reference Short, Pratt and Teague22), providing ecological insights about the responses to regularly consumed meals. Furthermore, assessment of postprandial insulinaemia is an applicable tool for identifying early insulin resistance in healthy, asymptomatic individuals(Reference Lautt7).
Adiposity is a well-known risk factor for the development of insulin resistance and type 2 diabetes(Reference Tagi, Giannini and Chiarelli2,Reference Arslanian9,Reference Arslanian10) , but there is very little known about how adiposity affects postprandial responses in adolescents. A direct comparison of overweight/obese and normal-weight adolescents, using BMI, found that those who were overweight/obese had a larger insulinaemic response to a standardised meal(Reference Short, Pratt and Teague22). This study, however, only considered BMI as a proxy of adiposity and did not consider the measure of waist circumference which is the preferred measure of adiposity when considering CVD risk(23). Future work should consider the discriminatory capabilities of multiple makers of adiposity and how these affect postprandial responses.
It has been suggested that physical fitness and fasting insulin resistance are inversely related in adolescents(Reference Dring, Cooper and Morris24–Reference Haapala, Wiklund and Lintu26). In addition, physical fitness is also inversely related to blood lipids and low-grade chronic inflammation in adolescents(Reference Dring, Cooper and Morris24,Reference Zaqout, Michels and Bammann27) and metabolic syndrome incidence in adults(Reference LaMonte, Barlow and Jurca28). It has been reported in one study that higher physical fitness in young people (aged 7–15 years), assessed by time taken to complete a 1·6 km run, is inversely related to insulin resistance (assessed via HOMA-IR) in adulthood(Reference Fraser, Blizzard and Schmidt25). It is worth noting, however, that this relationship was weaker when adjusting for childhood waist circumference, thus highlighting the importance of adiposity for metabolic health. However, no studies to date have examined whether physical fitness affects postprandial glycaemia and insulinaemia in adolescents, despite the importance of physical fitness for other risk factors for cardiometabolic health(Reference Dring, Cooper and Morris24,Reference Zaqout, Michels and Bammann27) .
Therefore, the aim of the present study is to explore the factors affecting the postprandial glycaemic and insulinaemic responses in adolescents, including an examination of the interaction between factors known to affect these responses, such as sex and adiposity. In addition, the study will consider how physical fitness influences postprandial responses which is a completely a novel area of enquiry in adolescents.
Methods
Experimental design
Data from three separate studies(Reference Cockcroft, Williams and Tomlinson18,Reference Cockcroft, Williams and Weaver19) (Williams, Cooper, Dring, Hatch, Morris, Sunderland and Nevill, unpublished results), with identical designs, were pooled to examine the postprandial responses to lunch. Each of the involved studies conformed to the Declaration of Helsinki guidelines and were approved by the Nottingham Trent University Human Ethics Committee. Participants were recruited from secondary schools in the East Midlands area of the UK. Written parental consent and participant assent were obtained during recruitment. A health screen was completed by a parent/guardian of the participant and checked by a lead investigator to ensure that there were no medical conditions that would affect the child’s participation. Participants were familiarised with all testing procedures at least 7 d in advance of the main experimental trial. Participants were instructed to refrain from eating or drinking from 21.00 hours the previous evening. Water was allowed ad libitum. Participants were also asked to refrain from physical activity in the 24 h preceding main trials. Participants reported to school at the beginning of the day (between 08.00 and 08.30 hours), and all procedures took place in a classroom at the school.
Participant characteristics
Anthropometric measurements
In total, the data set is composed of 108 participants (fifty-two boys) (Table 1). Participants underwent anthropometric measurements, consisting of stature (cm), body mass (kg) and sitting height (cm), which were used to calculate age at peak height velocity(Reference Moore, McKay and Macdonald29), which was subtracted from chronological age, in order to establish maturity offset. Height was measured with a Leicester Height Measure (Seca) accurate to 0·1 cm, and body mass was measured using a Seca 770 digital scale (Seca) accurate to 0·1 kg. For descriptive purposes, participants are classified as normal weight, overweight or obese based on age- and sex-specific cut points(Reference Cole, Bellizzi and Flegal30). Waist circumference was measured at the narrowest abdominal point, between the lower margin of the lowest palpable rib and the iliac crest, to the nearest 0·1 cm(23). Four skinfold sites were measured (triceps, subscapular, supraspinale and front thigh) as a surrogate of body composition. All measurements were repeated twice, on the right-hand side of the body, using the average of the two unless the measured differed by 5 % or more, in which case a third measure was taken and the median value used. The sum of the four skinfold thickness scores has been used as a marker of adiposity in previous research in this population(Reference Dring, Cooper and Morris20,Reference Dring, Cooper and Williams21) .
Table 1. Participant characteristics and metabolic markers split into boys and girls
(Mean values, standard deviations and ranges)

HOMA-IR, homoeostatic model assessment of insulin resistance; tAUC, total AUC.
Assessment of cardiorespiratory fitness
In each study, assessment of physical fitness was assessed using the multi-stage fitness test(Reference Ramsbottom, Brewer and Williams31). Briefly, the test required participants to complete progressive 20 m shuttle runs until volitional exhaustion. The multi-stage fitness test begins at a speed of 8·0 km/h (level 1), increases to 9·0 km/h (level 2) and then by 0·5 km/h for every subsequent level completed. To ensure maximum effort from the participants, participants were ‘paced’ by a member of the research team and investigators provided verbal encouragement and maximum heart rate was monitored continuously (Firstbeat Technologies Ltd). Performance on the test was determined by the total distance covered (m) (Table 1).
Experimental procedures
Standardised breakfast and lunch
On the morning of the trials (approximately 09.00 hours), a standardised breakfast was provided, which provided 1·5 g/kg body mass of carbohydrate (cornflakes, milk, white toast and butter). The standardised lunch (the test meal) was provided 3 h post-breakfast (approximately 12.00 hours) and contained 1·5 g/kg body mass of carbohydrate (chicken sandwich, baked crisps and an apple, with a cheese alternative for vegetarians (n 2 participants had the cheese alternative)) (Table 2). Participants were given 15 min to consume breakfast and lunch. The postprandial period (2 h) started on the first mouthful of lunch(Reference Brouns, Bjorck and Frayn32).
Table 2. Example of the standard and vegetarian options for the test meal, with energy and macronutrient breakdown, based on a hypothetical 50 kg individual
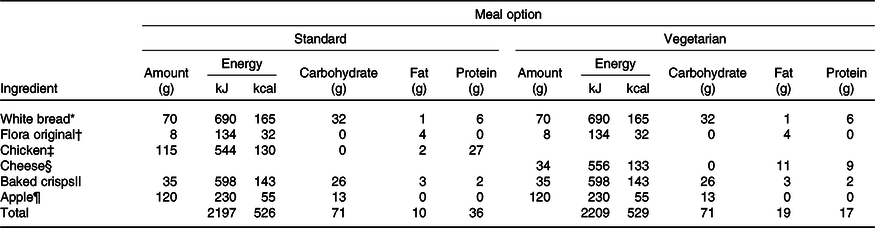
* White bread (Kingsmill soft white thick slice).
† Margarine (Flora Original).
‡ Sainsbury’s roast chicken slices (Sainsbury’s Ltd).
§ Sainsbury’s medium cheddar (Sainsbury’s Ltd).
|| Walkers ready salted baked crisps (Walkers).
¶ Braeburn apple.
Capillary blood samples
Capillary blood samples were preferred over venous samples due to ethical constraints in young people and have been used successfully previously in this population(Reference Dring, Cooper and Morris20,Reference Dring, Cooper and Williams21) . A fasting capillary blood sample was taken upon arrival at school. For the postprandial period, a baseline (pre-lunch) blood sample was taken at approximately 12.00 hours (always exactly 3 h post-breakfast), with additional blood samples at 30, 60 and 120 min post-lunch to represent the postprandial period.
In order to increase capillary blood flow, participants’ hands were warmed via submersion in warm water prior to collection. A unistik single-use lancet (Unistik, Extra, 21G gauge, 2·0 mm depth, Owen Mumford Ltd) was used, and the blood was collected into a 300 μl EDTA-coated microvette (Sarstedt Ltd). A single 25 μl whole blood sample was also collected using a pre-calibrated glass pipette (Hawksley Ltd) and immediately deproteinised in 250 μl ice-cooled 2·5 % perchloric acid, in 1·5 ml plastic vials. Both samples were then centrifuged at 1000 g for 4 min, at 4°C (Eppendorph 5415C). Plasma was removed from the microvette and placed into 500 μl plastic vials for subsequent analysis. All samples were frozen immediately at –20°C and transferred to –80°C as soon as possible.
Blood glucose concentrations were measured in duplicate (GOD/PAP method, GL364, Randox), and plasma insulin concentrations were measured in singular (ELISA; Mercodia Ltd) determined using commercially available methods and according to the manufacturer’s instructions. The intra-assay CV for the assays of blood glucose concentration and plasma insulin concentration were 2·3 and 3·2 %, respectively. Blood glucose and plasma insulin total AUC (tAUC) following the standardised lunch were calculated (GraphPad Prism 7, GraphPad Software), using methods described previously(Reference Wolever and Jenkins33,Reference Wolever and Jenkins34) . HOMA-IR was calculated as an index of insulin resistance(Reference Matthews, Hosker and Rudenski35). For descriptive purposes, participants were classed as ‘at risk’ according to age- and sex-specific cut points(Reference Shashaj, Luciano and Contoli36).
Sample size justification
For multiple regression, it is recommended that sample size is a minimum of ten participants per predictor variable(Reference VanVoorhis and Morgan37). A maximum of eight predictors were available, which would dictate a minimum sample size of eighty for sufficient power.
Statistical analyses
All data were analysed using the open-source software RStudio version 1.2.1335 (RStudio Team., (2015), www.rstudio.com). A correlation matrix was created in order to evaluate multicollinearity between independent variables (sex, waist circumference, sum of skinfolds, body mass, BMI, maturity offset, multi-stage fitness test performance and HOMA-IR). Before analysis, waist circumference, sum of skinfolds, BMI and multi-stage fitness test performance were centred to the mean. Simple linear regression was initially conducted for each independent variable on each outcome variable (HOMA-IR, plasma insulin tAUC and blood glucose tAUC). Following this, stepwise hierarchical multiple regression – backwards elimination – was used to develop models for each outcome variable, using the ‘lme4’ package(Reference Bates, Mächler and Bolker38). At each stage, the independent variable that provided the lowest contribution to the model (through evaluation of SE and t-statistic) was removed and then the model was re-run.
Results
A total of 80 (74·1 %) participants were considered normal weight, 18 (16·7 %) overweight and 10 (9·3 %) obese. Furthermore, 34 (31 %) participants were considered ‘at risk’ of insulin resistance, as calculated by HOMA-IR.
Multicollinearity between independent variables
Independent variables were assessed for multicollinearity prior to conducting the hierarchical multiple regression, the results of which are shown in Table 3. There was a strong correlation between BMI and body mass, which is not surprising given that body mass is used in the calculation of BMI. Therefore, these variables cannot be considered independent, and thus, body mass was excluded from subsequent analyses. All other variables did not demonstrate strong correlations (r < 0·90) and were thus included in the models.
Table 3. Correlation matrix for all independent variables
(r Values for correlations between independent variables)

BM, body mass; MO, maturity offset; SumSF, sum of skinfolds; WC, waist circumference; MSFT, distance run on multi-stage fitness test; HOMA-IR, homoeostatic model assessment of insulin resistance.
Holm correction for multiple testing used. * P < 0·01, ** P < 0·001.
Plasma insulin total AUC
Predictors individually
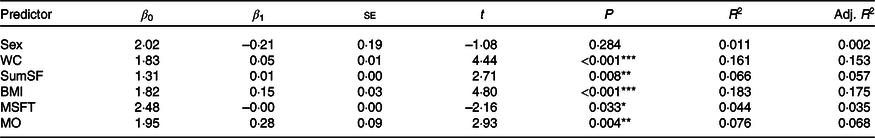
Simple linear regression models for insulin tAUC, with each independent variable separately, can be seen in Table 4. Waist circumference was the strongest individual predictor, explaining 37·7 % of the insulin tAUC variance (P < 0·001). BMI (P < 0·001, adjusted R 2 0·330), sum of skinfolds (P < 0·001, adjusted R 2 0·287), HOMA-IR (P < 0·001, adjusted R 2 0·292) and multi-stage fitness test performance (P < 0·001, adjusted R 2 0·139) were all significant individual predictors of plasma insulin tAUC. Sex (P = 0·707, adjusted R 2 –0·008) and maturity offset (P = 0·079, adjusted R 2 0·020) did not affect plasma insulin tAUC.
Table 4. Summary of simple linear regression outputs for each variable predicting plasma insulin total AUC
(Standard errors and β-coefficients)

β 0, Intercept; β 1, parameter estimate; Adj., adjusted; WC, waist circumference; SumSF, sum of skinfolds; MSFT, distance run on multi-stage fitness test; MO, maturity offset; HOMA-IR, homoeostatic model assessment of insulin resistance.
* P < 0·05, ** P < 0·01, *** P < 0·001.
Final model development
The hierarchical regression (stepwise, backwards elimination) step-by-step process can be seen in Table 5. The final model (step 5) contained waist circumference, multi-stage fitness test performance and HOMA-IR as predictors, explaining 51·5 % of the variance in plasma insulin tAUC (F (3,39) = 36·78, P < 0·001, adjusted R 2 0·515). The model suggests that: for a 1 cm increase in waist circumference, insulin tAUC would increase by 921 pmol/l × 120 min (95 % CI 564, 1278); for a 20 m increase in distance ran during the multi-stage fitness test, insulin tAUC would decrease by 6 pmol/l × 120 min (95 % CI –12, –1) and for a 1 arbitrary unit (AU) increase in HOMA-IR, the model suggests that insulin tAUC would increase by 6046 pmol/l × 120 min (95 % CI 3595, 8497).
Table 5. Summary of the hierarchical regression (backwards elimination) for variables predicting plasma insulin total AUC†
(95 % confidence intervals and unstandardised coefficients; standard errors and β-coefficients)
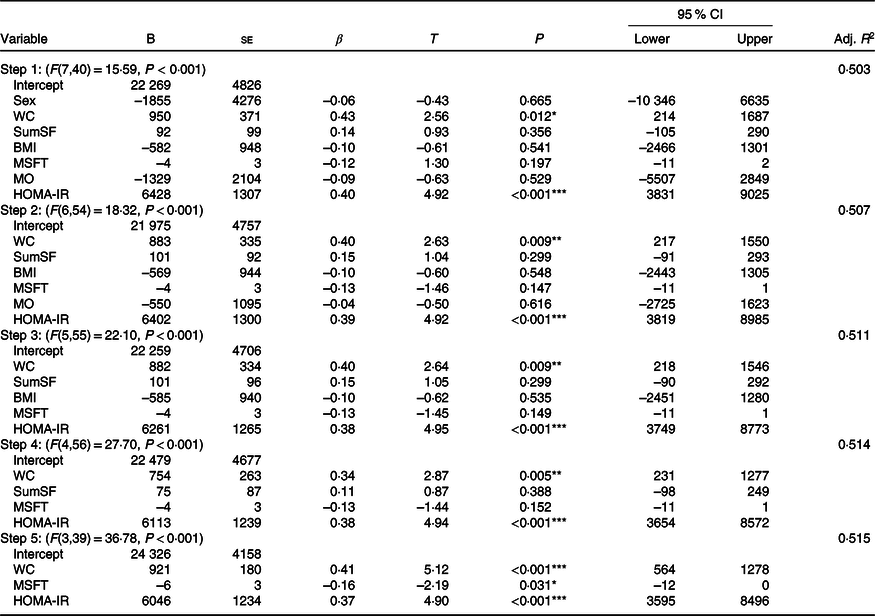
B, regression coefficient; β, standardised coefficient; Adj., adjusted; WC, waist circumference; SumSF, sum of skinfolds; MSFT, distance run on multi-stage fitness test; MO, maturity offset; HOMA-IR, homoeostatic model assessment of insulin resistance.
* P < 0·05, ** P < 0·01, *** P < 0·001.
† 95 % CI are for unstandardised coefficients (B). ▵R 2: step 2 = 0·004, step 3 = 0·004, step 4 = 0·003, step 5 = 0·001.
Blood glucose total AUC
Predictors individually
None of the available predictors provided a significant contribution to explaining the variance in blood glucose tAUC, individually (Table 6).
Table 6. Summary of simple linear regression outputs for each variable predicting blood glucose total AUC
(Standard errors and β-coefficients)

β 0, Intercept; β 1, parameter estimate; Adj., adjusted; WC, waist circumference; SumSF, sum of skinfolds; MSFT, distance run on multi-stage fitness test; MO, maturity offset; HOMA-IR, homoeostatic model assessment of insulin resistance.
Final model development
The initial model (step 1) including all predictors did not provide sufficient explanation for the variance (3 %) in blood glucose tAUC (F(7,40) = 1·44, P = 0·198). As no predictors significantly explained any variance in blood glucose tAUC individually, or in the hierarchical model, the backwards elimination process was terminated at step 1.
Homoeostatic model assessment of insulin resistance
Predictors individually
Simple linear regression models for HOMA-IR, with each independent variable separately, can be seen in Table 7. BMI was the strongest predictor for HOMA-IR, explaining 17·5 % of the variance (P < 0·001). Waist circumference (P < 0·001, adjusted R 2 0·153), sum of skinfolds (P = 0·008, adjusted R 2 0·057), multi-stage fitness test performance (P = 0·033, adjusted R 2 0·035) and maturity offset (P = 0·004, adjusted R 2 = 0·068) also provided a significant contribution to the variance in HOMA-IR. Sex did not significantly explain variance in HOMA-IR (P = 0·284, adjusted R 2 0·002).
Table 7. Summary of simple linear regression outputs for each variable predicting homoeostatic model assessment of insulin resistance
(Standard errors and β-coefficients)
β 0, Intercept; β 1, parameter estimate; Adj., adjusted; WC, waist circumference; SumSF, sum of skinfolds; MSFT, distance run on multi-stage fitness test; MO, maturity offset.
* P < 0·05, ** P < 0·01, *** P < 0·001.
Final model development
The hierarchical regression (stepwise, backwards elimination) step-by-step process can be seen in Table 8. The final model containing BMI and maturity offset as independent variables (step 5; F (2,41) = 14·06, P < 0·001, adjusted R 2 0·201) explained 20·1 % of the variance in HOMA-IR. Specifically, the model suggests that for each additional 1 kg/m2 increase in BMI, HOMA-IR would increase by 0·14 AU; for each 1 year increase in maturity offset, HOMA-IR would increase by 0·17 AU.
Table 8. Summary of the hierarchical regression (backwards elimination) for variables predicting homoeostatic model assessment of insulin resistance†
(95 % confidence intervals and unstandardised coefficients; standard errors and β-coefficients)
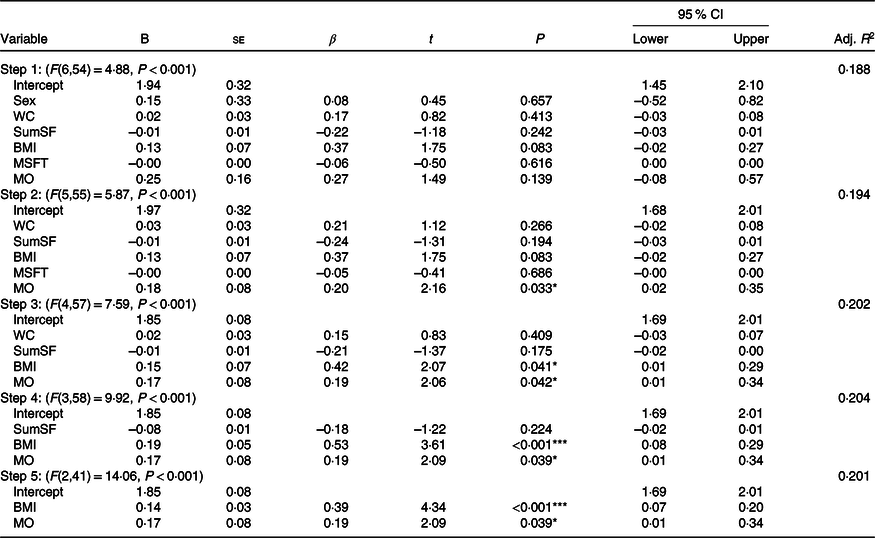
B, regression coefficient; β, standardised coefficient; Adj., adjusted; WC, waist circumference; SumSF, sum of skinfolds; MSFT, distance run on multi-stage fitness test; MO, maturity offset.
* P < 0·05, ** P < 0·01, *** P < 0·001.
† 95 % CI are for unstandardised coefficients (B). ▵R 2: step 2 = 0·006, step 3 = 0·008, step 4 = 0·003, step 5 = –0·004.
Discussion
The main findings of the present study are that in adolescents: (i) the combination of waist circumference, performance on the multi-stage fitness test and HOMA-IR collectively explained 51·5 % of variance in the postprandial insulinaemic response to a standardised mixed meal; (ii) none of the independent variables (BMI, body mass, waist circumference, MSFT, sum of skinfolds, sex, maturity offset and HOMA-IR) explained the variance in the postprandial glycaemic response and (iii) BMI and maturity offset collectively explained 20·1 % of the variation in HOMA-IR. These findings highlight the importance of body composition, particularly central adiposity, in explaining the insulinaemic response to a standardised mixed meal in adolescents. Furthermore, the present study also highlights that physical fitness is an important explanatory variable when considering the postprandial insulinaemic response in adolescents.
The findings of the present study are novel because no study to date has investigated the factors affecting the postprandial glycaemic and insulinaemic responses in adolescents, which are recognised as important risk factors for cardiometabolic disease(Reference DiNicolantonio, Bhutani and OKeefe5–Reference Lautt7). Furthermore, most waking hours are spent in a postprandial state; therefore, it seems logical to examine postprandial responses when evaluating an individual’s metabolic function. Although glycaemia has potential clinical use for screening of disease prevalence and risk, there have been some arguments that more attention should be focused on postprandial insulinaemia(Reference DiNicolantonio, Bhutani and OKeefe5,Reference Lautt7) . Furthermore, we hypothesise that the changes in postprandial insulinaemic responses manifest earlier in the progression of cardiometabolic diseases than the postprandial glycaemic responses and should therefore be examined in young people. The present study provides novel evidence that waist circumference, physical fitness and HOMA-IR are key predictors of this postprandial insulinaemic response in adolescents. These novel findings provide further evidence that more consideration should be given to the assessment of postprandial insulinaemia, alongside glycaemia, as a risk factor for metabolic health(Reference DiNicolantonio, Bhutani and OKeefe5–Reference Lautt7), which highlights the utility of this marker for future research.
Out of all the explanatory variables, waist circumference provided the strongest individual explanation of the variance in the postprandial insulinaemic response and was also a strong predictor in the final model. These data are supported by a group comparison of postprandial insulinaemia whereby overweight/obese adolescents (aged 14–15 years) had a greater insulin AUC compared with normal-weight adolescents(Reference Short, Pratt and Teague22), as well as supporting the relationship between adiposity and insulin sensitivity over a 2-year period in children (aged 9–11 years)(Reference Henderson, Benedetti and Barnett39). Whilst previous research has identified differences in postprandial insulinaemia between young people considered overweight and normal weight, the present study offers novel insights into the relationship of adiposity on postprandial responses in adolescents. Furthermore, waist circumference was superior compared with BMI and sum of skinfolds, which are also measures of body composition, therefore highlighting the importance and utility of this particular measure. Whilst central adiposity is of great importance for cardiometabolic disease risk, the direct measurement, via dual-energy x-ray absorptiometry, for example, requires an expensive and specialist radiological imaging equipment(Reference Klein, Allison and Heymsfield40). However, waist circumference is strongly advocated as a surrogate measure of central adiposity and has been associated with cardiometabolic disease risk(23,Reference Klein, Allison and Heymsfield40) . This has important practical implications, given the low-cost and non-invasive nature of such a measuring waist circumference. Collectively, these results demonstrate the importance of adiposity – particularly central adiposity (as measured by waist circumference) – for cardiometabolic health in youth, which is pertinent given that central adiposity is linked to the development of insulin resistance(Reference Tagi, Giannini and Chiarelli2,Reference Arslanian9,Reference Arslanian10) .
Another novel finding of the present study was that physical fitness (assessed by distance covered on the multi-stage fitness test) was inversely related to plasma insulin tAUC. Physical fitness is known to be beneficial for many facets of cardiometabolic health(Reference Zaqout, Michels and Bammann27). However, to the authors’ knowledge, no other studies have examined the relationship between physical fitness and postprandial insulinaemia. The closest comparison comes from evidence in children (aged 6–8 years) where physical fitness was inversely related to fasting insulin resistance(Reference Dring, Cooper and Morris24). Furthermore, there is evidence of improved beta-cell function in adults with a higher physical fitness(Reference Ramos, Dalleck and Borrani41), which lends support to the result of improved insulin sensitivity in participants with a higher physical fitness in the current data set. There is also a strong body of evidence that chronic exercise interventions improve insulin sensitivity in obese youth(Reference Lee and Kim42). Whilst there has been suggestion that these improvements might be due to increased capillarisation of skeletal muscle(Reference Bird and Hawley43) and increased GLUT4 translocation(Reference Bird and Hawley43), others have suggested that the chronic improvements are largely mediated through weight loss(Reference Keshel and Coker44). Identifying a mechanism, through which physical fitness improves postprandial insulinaemia, was not in the scope of the present study. However, it is interesting that physical fitness remained in the final model, even in the presence of adiposity. Nonetheless, it is important that future research investigates the mechanisms through which physical fitness leads to better postprandial insulinaemia, and whether this differs from those as a result of acute and chronic exercise. The present study is the first to show a beneficial relationship between physical fitness and postprandial insulinaemia in adolescents, suggesting that physical fitness may be a key predictor for this outcome even when considering the role of other predictors. This has important practical implications that highlight the need to promote physical fitness in youth, given the strong role it has in metabolic health.
The present study also demonstrates that HOMA-IR provides a significant explanation of the variance in postprandial insulinaemia. These data support and extend previous findings following a standardised breakfast(Reference Cooper, Dring and Morris11) and an OGTT(Reference Cockcroft, Williams and Jackman45). Previous work has shown that HOMA-IR is positively correlated (r 0·63) with insulin tAUC following an OGTT(Reference Cockcroft, Williams and Jackman45). This is of similar magnitude to the present study (r 0·53); however, the previous association was only applicable to adolescent boys in response to an OGTT(Reference Cockcroft, Williams and Jackman45). The present study extends this relationship to a sample of adolescent boys and girls, in response to an ecologically valid mixed meal. Although the meals provided between the present study and previous work(Reference Cooper, Dring and Morris11) were different, they offered the same relative energy provision (1·5 g/kg body mass of carbohydrate). Collectively, these results suggest that basal metabolic function is important for determining the physiological response to test meals. The results from the present study also suggest that an increase in HOMA-IR (higher basal insulin resistance) will lead to greater postprandial insulinaemic responses, even when other strong predictors such as waist circumference and physical fitness are controlled for.
The present study suggests that when considering fasting metabolic status (using HOMA-IR), BMI and maturity offset were the most informative explanatory variables. Independently, BMI was the stronger explanatory variable which is consistent with previous work in this population stating that adiposity has a strong predictive role in fasting measures of insulin resistance(Reference Dring, Cooper and Morris24,Reference Barseem and Helwa46,Reference Silva, Cavaglieri and Lopes47) , despite using different surrogate measures of adiposity. The current study advances previous work in obese adolescents(Reference Barseem and Helwa46) to demonstrate that BMI is strongly related to HOMA-IR in healthy, asymptomatic (from cardiometabolic health conditions) adolescents. Maturity offset was also positively related to HOMA-IR, which is consistent with previous literature stating that there is a degree of pubertal insulin resistance during adolescence(Reference Arslanian10–Reference Reinehr13), which is sometimes more profound in girls(Reference Cooper, Dring and Morris11,Reference Kelsey and Zeitler12) . The role of maturity and sex, in the present study, seemed only to be reflected in the fasting proxy of insulin resistance, whereas previously it has been shown that girls are hyperinsulinaemic compared with boys, following the same standard meal(Reference Cooper, Dring and Morris11). This is an interesting observation which may be indicative of potentially differential insulin resistance development during puberty, where fasting hepatic insulin resistance occurs at the earlier stages, with postprandial peripheral insulin resistance developing in the latter stages. However, there are currently no data to support this suggestion which would require the measurement of postprandial insulinaemia in adolescents at different stages of puberty, or a longitudinal follow-up throughout the course of adolescence.
The results of the present study demonstrate that the use of low-cost, non-invasive measures of adiposity and physical fitness provides a much greater explanation of variance in postprandial insulinaemia than the traditional fasting marker of metabolic health, HOMA-IR. This has important practical implications, given the invasive and costly nature of HOMA-IR, and the potential use of these measurements (especially waist circumference) in predicting postprandial insulinaemia. However, there are still other characteristics that might provide additional information about the variance in postprandial insulinaemia. Habitual physical activity is known to attenuate the puberty-related insulin resistance seen in adolescence(Reference Metcalf, Hosking and Henley48). Furthermore, in adults matched for V.O2max, those with greater levels of habitual physical activity were more insulin sensitive in response to an OGTT(Reference Laye, Nielsen and Hansen49). Given this evidence, it would be worthwhile including habitual physical activity as an explanatory variable in future work. In addition, this work could be extended by incorporating participants across the age of adolescence, which would help to identify if the relationships highlighted in the present study exist across different age groups and stages of pubertal development.
The present study has a number of limitations that need consideration. First, a mixed meal was consumed rather than a traditional OGTT. The OGTT is a valid test meal when examining postprandial responses, and the consumption of a solid mixed meal will have different gastric emptying rates compared with a drink solution; thus, comparisons may be limited(Reference Brouns, Bjorck and Frayn32). However, examining the postprandial responses to a mixed meal has been favoured in recent paediatric research given that young people spend most of the awake time in the postprandial state. The present study also used maturity offset as a marker of maturation status(Reference Moore, McKay and Macdonald29), which is based on predictive modelling using anthropometric measurements. Despite being a prediction of maturation, maturity offset is often favoured in a non-clinical setting over traditional measures (such as the Tanner scale, which examines secondary sex characteristics), which are deemed invasive(Reference Mirwald, Baxter-Jones and Bailey50). Whilst the present study included several relevant predictors of metabolic health, there were also a number of predictors not included (such as the habitual dietary intake and physical activity levels of participants, mode of transport to school and socio-economic status), which should be examined in future research. Furthermore, as the present study is cross-sectional, causality between the chosen predictors and postprandial responses cannot be inferred. Finally, it is important to consider that the participants in the current study are considered healthy and asymptomatic from cardiometabolic health conditions. Indeed, it might be more appropriate to study the relationships examined in the present study in populations with increased prevalence of risk factors for cardiometabolic diseases, given that they would be the target of future interventions. Nonetheless, identifying these relationships in healthy adolescents provides important information, given the role of postprandial hyperinsulinaemia in the pathophysiology of insulin resistance and related cardiometabolic health issues(Reference DiNicolantonio, Bhutani and OKeefe5) and suggested early manifestation of such conditions(Reference Steinberger, Daniels and Eckel4).
In conclusion, the findings of the present study demonstrate that over half of the variance in postprandial insulinaemia in response to a standard mixed meal, in adolescents, can be explained by measurements that are frequently employed to characterise participants in paediatric exercise literature, waist circumference, multi-stage fitness test performance and HOMA-IR. Overall, measures of body composition (particularly waist circumference) were key when explaining the variance in metabolic health in this sample. These data extend previous work using different surrogates of body composition and fasting indices of insulin resistance, thus demonstrating that body composition (particularly waist circumference) is important for postprandial metabolic responses and cardiometabolic health. These findings have important practical implications, as the predictors identified are easily measurable in young people and considered modifiable. Future work should investigate additional variables that might help explain the variance in postprandial insulinaemia and glycaemia, such as habitual physical activity, and how the impact of these participant characteristics may change throughout the course of adolescence.
Acknowledgements
The authors would like to thank the participants and teachers at the secondary schools involved, for their time and effort with data collection.
This research received no specific grant from any funding agency, commercial or not-for-profit sectors.
The author contributions are as follows: R. W. contributed to the design of the study, the collection and analysis of the data and the writing of the manuscript. K. J. D. contributed to the design of the study and the collection and analysis of the data. S. B. C. contributed to the design of the study and the collection and analysis of the data. J. G. M. contributed to the design of the study and collection of the data. C. S. contributed to the design of the study and collection of the data. M. E. N. contributed to the design of the study and the collection of the data. R. W., K. J. D., S. B. C. and M. E. N. drafted the manuscript. All authors read and approved the final version of the manuscript.
The authors declare that there are no conflicts of interest.


 Open access