Obesity is one of the most common diseases present in both humans and companion animals, and is often associated with many co-morbidities, including diabetes mellitus. Similar to obese humans, obese dogs often exhibit altered blood glucose concentrations, insulin resistance and dyslipidaemia( Reference Kaneko, Mattheeuws and Rottiers 1 – Reference Chandler, Cunningham and Lund 3 ). Many human and canine studies have demonstrated the ability of dietary fibres, especially soluble fibres and prebiotics, to decrease postprandial hyperglycaemia( Reference Massimino, McBurney and Field 4 , Reference Chandalia, Garg and Lutjohann 5 ), improve insulin sensitivity( Reference Respondek, Swanson and Belsito 6 , Reference Weickert, Möhlig and Schöfl 7 ) and increase secretion of intestinal glucagon-like peptide-1 (GLP-1)( Reference Massimino, McBurney and Field 4 , Reference Reimer and McBurney 8 ). Thus, fibres and prebiotics may be used to improve the postprandial glycaemic response in obese or overweight dogs. However, the efficacy of fibre and other non-digestible carbohydrates in producing such effects is largely dependent on source. The physiochemical properties of these ingredients, such as fermentability, may be quite different and lead to differing effects in vivo, stressing the importance of understanding which ingredients elicit a beneficial response( Reference Delzenne and Cani 9 ). For example, healthy dogs fed a high-fermentable fibre diet (beet pulp, gum arabic, fructo-oligosaccharides (FOS)) compared with those fed a low-fermentable fibre diet (wood cellulose) exhibited a blunted blood glucose response and an increased production of insulin and GLP-1 following an oral glucose challenge( Reference Massimino, McBurney and Field 4 ). In addition, highly fermentable short-chain FOS supplementation in obese dogs has been shown to improve insulin sensitivity and modulate the expression of genes involved in fatty acid and glucose metabolism in adipocytes( Reference Respondek, Swanson and Belsito 6 ).
Interestingly, some studies have suggested that certain fibres and prebiotics can beneficially alter the glycaemic response many hours after a meal has been consumed. Such a response has been called the ‘second-meal effect’, and was first reported in humans in the early twentieth century( Reference Staub 10 , Reference Traugott 11 ). A previous study conducted in our laboratory demonstrated that when dogs were fed a high-fermentable fibre diet (5 % pectin; 3 % inulin-type fructans) compared with a low-fermentable fibre diet (5 % Solka Floc; 3 % soya hulls), they exhibited a decreased postprandial blood glucose response at a subsequent meal 4 h after consumption( Reference Deng, Beloshapka and Vester Boler 12 ). Given that obese dogs frequently exhibit an impaired glycaemic response, including hyperglycaemia, hyperinsulinaemia and insulin resistance, the consumption of fermentable fibres may improve these measures across multiple meals. In addition, human studies have shown that consumption of initial meals high in fibre, especially those that are soluble and/or fermentable, can curb the glycaemic response of a high-glycaemic second meal( Reference Brighenti, Benini and Del Rio 13 – Reference de Carvalho, de Paula and Viana 16 ). The overarching hypothesis is that the production of SCFA (acetate; butyrate; propionate) produced from fermentation of fibre in the large bowel modulates the observed effects by delaying gastric emptying( Reference Ropert, Cherbut and Roze 17 ), down-regulating lipolysis in adipocytes( Reference Robertson 18 ), increasing glucose utilisation in glycolysis and decreasing glucose production( Reference Anderson and Bridges 19 ) and increasing postprandial insulin and GLP-1 production( Reference Reimer and McBurney 8 ). Inulins are of particular interest given their high degree of fermentability by gut bacteria to produce SCFA. In addition to fibre type, it is important to determine dosages that are both adequate to produce a beneficial response and feasible for incorporation into the diet. To our knowledge, there has not been previous research investigating the effects of practical doses of inulin on the second-meal effect in overweight dogs.
It is well established that (1) body composition (lean v. obese) and (2) dietary fibres/prebiotics affect the composition and diversity of the gastrointestinal microbiome( Reference Middelbos, Boler and Qu 20 – Reference Dominianni, Sinha and Goedert 25 ). These effects suggest that prebiotics may be a promising dietary strategy for promoting health, especially in overweight or obese populations. However, little research has been performed in dogs using modern high-throughput DNA-sequencing-based assays. Therefore, an important next step is to characterise how particular dietary fibres shift the gastrointestinal microbiome in both lean and overweight dogs. The study conducted here is among the first to investigate the impact of inulin-type prebiotics on the gut microbiota composition and diversity of overweight dogs. The gastrointestinal microbiota is also affected by bile acids (BA), and vice versa. Although BA possess antimicrobial properties by acting as detergents on microbial cell membranes, some bacteria in the gut possess enzymes that modify BA, rendering them less harmful to microbes. Because BA possess endocrine functionality, altering the composition of the BA pool may influence host metabolism( Reference Ridlon, Harris and Bhowmik 26 , Reference Joyce and Gahan 27 ). The complex relationship that exists between dietary fibre, the gut microbiome and BA metabolism remains to be elucidated, especially in dogs. To our knowledge, we are the first to determine the effect of an inulin product on the faecal BA pool in dogs.
Therefore, the objectives of this study were (1) to evaluate the effects of inulin on the baseline and postprandial glucose, insulin and active GLP-1 responses to an oral glucose challenge in overweight dogs several hours after its consumption, and (2) to evaluate the effects of inulin on the faecal microbiota and BA pool in overweight dogs. On the basis of previous studies, we hypothesised that the prebiotic would elicit a ‘second-meal effect’ and beneficially shift the faecal microbiota, resulting in a greater relative abundance of Bifidobacterium, Faecalibacterium, Akkermansia and Lachnospira and lower relative abundance of Fusobacterium and Desulfovibrio.
Methods
Animals, diet and treatments
All procedures were approved by the University of Illinois Institutional Animal Care and Use Committee before the study (protocol no. 15248). Nine overweight adult (mean age=4·16 (sem 0·67) years) female beagles (mean body weight (BW)=12·96 (sem 2·42) kg; mean body condition score (BCS)=7·8 (sem 1·4)) were used in this study and were housed individually in pens (1·2 m wide×1·8 m long) in a temperature-controlled room (20°C) on a 14 h light–10 h dark cycle in the animal facility at the Veterinary Medicine Basic Sciences Building at the University of Illinois. An overweight phenotype was induced by overfeeding and maintained for several months before the beginning of the current study. Dogs were weighed and BCS were assessed using a nine-point scale once a week in the morning before feeding. Dogs were given access to toys for behavioural enrichment at all times and to exercise outside of their cages and socialise with each other and humans for approximately 1 h at least 3 d/week. Dogs were evaluated and shown to be healthy before the study and after study completion. Welfare was monitored by research and animal care staff daily and trained veterinarians during the study when needed.
The ingredient and chemical composition of the experimental diet is listed in Table 1. The diet was mixed by Lortscher Animal Nutrition, manufactured by AFB International, and formulated to meet all Association of American Feed Control Officials (2015) nutrient recommendations for adult dogs. All dogs were fed the same experimental diet for the duration of the study. Initial food intake was determined by calculating the maintenance energy requirement according to the National Research Council( 28 ) and by using previous feeding records. Dogs had access to fresh water ad libitum and were fed twice a day (08.00 and 16.00 hours) to maintain BW throughout the study. Food intake and refusals were measured and recorded at each meal. Prebiotic treatments (Orafti®SIPX; Beneo GmbH) were given to dogs via gelatin capsules at each meal, with capsules containing half the daily dose. The total dose of each treatment/d was as follows: (1) placebo (cellulose, equivalent to approximately 0·25 % of diet, 0·5 g/d); (2) Orafti®SIPX (equivalent to approximately 0·5 % of diet, 1 g/d); and (3) Orafti®SIPX (equivalent to approximately 1 % of diet, 2 g/d). Dosage was selected based on previous work in our laboratory investigating prebiotic fructans, including impacts on the microbiome and benefits to host health, as well as on inclusion feasibility from a consumer cost perspective( Reference Middelbos, Boler and Qu 20 , Reference Barry, Hernot and Middelbos 29 , Reference Apanavicius, Powell and Vester 30 ).
Table 1 Ingredient and analysed chemical composition of the experimental diet

ME, metabolisable energy.
* Provided per kg diet: Mn (as MnSO4), 66·00 mg; Fe (as FeSO4), 120 mg; Cu (as CuSO4), 18·00 mg; Co (as CoSO4), 1·20 mg; Zn (as ZnSO4), 240 mg; iodine (as KI), 1·80 mg; Se (as Na2SeO3), 0·24 mg.
† Provided per kg diet: vitamin A, 5·28 mg; vitamin D3, 0·04 mg; vitamin E, 120·00 mg; vitamin K, 0·88 mg; thiamin, 4·40 mg; riboflavin, 5·72 mg; pantothenic acid, 22·00 mg; niacin, 39·60 mg; pyridoxine, 3·52 mg; biotin, 0·13 mg; folic acid, 0·44 mg; vitamin B12, 0·11 mg.
‡ ME=8·5 kcal ME/g fat + 3·5 kcal ME/g crude protein + 3·5 kcal ME/g N-free extract.
Experimental design
Dogs were randomised to an initial treatment group (control, low dose or high dose), and a replicated 3×3 Latin square design was used. Using this design, each dog received all three treatments over the course of the experiment, serving as their own control and increasing statistical power (n 9). The experiment consisted of three 14-d experimental periods separated by 14-d washout periods. Each experimental period consisted of an adaption phase (days 1–12) and a faecal and blood collection phase (days 13–14).
Blood and faecal sample collection
On days 13 and 14, a fresh (within 15 min of defecation) faecal sample was collected from the pen floor of each dog. All samples were scored in 0·5 unit increments using the following scale: 1=hard, dry pellets; small hard masses, 2=hard, formed, dry stool; remains firm and soft, 3=soft, formed, and moist stool; retains shape, 4=soft, unformed stool; assumes shape of container, 5=watery, liquid that can be poured. Faecal pH was measured immediately, and then aliquots were collected. Aliquots for phenol and indole measurement were frozen and stored at −20°C until analysis. An aliquot for ammonia, SCFA and branched-chain fatty acid (BCFA) measurement was placed in 2 M-HCl and stored at −20°C until analysis. An aliquot was collected for the determination of faecal DM determination. Finally, aliquots for microbiota and BA measurement were transferred to sterile cryogenic vials (Nalgene), frozen on dry ice and stored at −80°C until analysis.
On days 13 and 14, an oral glucose tolerance test (OGTT) was also performed. On those days, dogs were fed at 08.00 hours as usual. Dogs were sedated using dexmedetomadine (Dexdomitor, 0·02 mg/kg BW intramuscular (IM); Orion Pharma) and butorphanol (Torbugesic, 0·2 mg/kg BW IM, Henry Schein) at 14.00 hours for approximately 15 min during cephalic catheter placement. Once the catheters were placed and secure, dogs were given atipamezole (Antisedan, 0·02 mg/kg BW IM; Orion Pharma), the reversal agent for Dexdomitor, and monitored until awake and alert. Just before 16.00 hours, a blood sample was collected for baseline glucose, insulin and GLP-1 measurement. Instead of their 16.00 hours meal, dogs received an oral glucose load (1 g/kg BW) of maltodextrin as a 50 % solution by slowly dripping it into their mouth using 60-ml needleless syringes to minimise stress and prevent aspiration. After dosing, blood samples were collected after 10, 20, 30, 45, 60, 90, 120 and 180 min from the cephalic catheters. After 180 min, catheters were removed and dogs were given their evening meal (19.00 hours).
Chemical analysis of diet
Diet samples were ground using a Wiley mill (model 4; Thomas Scientific) through a 2-mm screen and analysed for DM, organic matter and ash according to the Association of Official Analytical Chemists( 31 ). Crude protein was calculated from Leco (FP2000 and TruMac) total N values according to Association of Official Analytical Chemists( 31 ). Total lipid content (acid-hydrolysed fat) was determined according to the methods of the American Association of Cereal Chemists( 32 ) and Budde( Reference Budde 33 ). Total dietary fibre was determined according to Prosky et al.( Reference Prosky, Asp and Schweizer 34 ). Gross energy was measured using an oxygen bomb calorimeter (model 1261; Parr Instruments).
Serum and plasma analysis
One drop of blood from the syringe was immediately used to measure glucose concentration using the glucose oxidase method (AlphaTRAK Blood Glucose Monitoring System; Abbott Laboratories) at each time point. An aliquot was immediately transferred into a pre-cooled Vacutainer tube (no. 367835; Becton, Dickinson and Company) containing EDTA and 20 µl of dipeptidyl peptidase IV inhibitor (10 µl/ml blood; Millipore), and centrifuged (GS-6R; Beckman) at 1000 g at 4°C for 10 min for measurement of plasma active GLP-1. The remaining blood was transferred to a serum separator tube (no. 367985; Becton, Dickinson and Company), allowed to clot and centrifuged at 1300 g at room temperature for 15 min for collection of serum for insulin measurement. After centrifugation, supernatants were collected and stored into respective cryovials and stored at −20°C (serum) or −80°C (plasma) until further analysis. Serum insulin concentration was determined using a Rat Insulin EIA kit (Bertin Pharma) validated for use in dogs( Reference Knapp, Parsons and Swanson 35 , Reference Lubbs, Vester Boler and Ridge 36 ). Standard curves were generated using the Gen5 software and a 4 Parameter fit. Plasma active GLP-1 concentrations were analysed using a Glucagon-Like Peptide 1 (Active) ELISA kit (Millipore) validated for use in dogs( Reference Lubbs, Vester Boler and Ridge 36 ).
Faecal metabolite analysis
Faecal SCFA and BCFA concentrations were determined using GC according to Erwin et al. using a gas chromatograph (Hewlett-Packard 5890A series II; Agilent Technologies) and a glass column (180 cm×4 mm internal diameter) packed with 10 % SP-1200/1 % H3PO4 on 80/100+ mesh Chromosorb WAW (Supelco Inc.)( Reference Erwin, Marco and Emery 37 ). N2 was the carrier with a flow rate of 75 ml/min. Oven, detector and injector temperatures were 125, 175 and 180°C, respectively. Faecal ammonia concentration was determined according to the method of Chaney & Marbach( Reference Chaney and Marbach 38 ). Faecal phenol and indole concentrations were determined using GC according to the methods described by Flickinger et al.( Reference Flickinger, Schreijen and Patil 39 ).
For faecal BA analysis, stool samples were lyophilised and BA extraction was performed using Method B (alkaline hydrolysis) according to Kakiyama et al. without any modifications( Reference Kakiyama, Muto and Takei 40 ). For BA analysis, HPLC equipment (Shimadzu) equipped with a C-18 analytical column (Capcell Pak c18; Shiseido) was used. Methanol (82 %) was used as the mobile phase and the flow rate was maintained at 0·2 ml/min. A diode array detector was used at a wavelength of 254 nm. Peak retention times and peak areas of samples were compared with internal standard (IS) steroid molecules (Steraloids). Calculations of BA concentrations were performed using the following equation:
 $${\rm BA }\,\left( {\rmu {\rm mol\,/\,g\, stool}} \right){\equals}{{{\rm Peak \,area }\left\,( {{\rm BA}} \right)} \over {{\rm Peak \,area }\left\,( {{\rm IS}} \right)}}{\times}{\rm }{{{\rm Spiked \,IS }\,\left( {{\rm nmol}} \right)} \over {{\rm Stool \,amount }\,\left( {{\rm mg}} \right)}} .$$
Faecal microbiota
Faecal bacterial DNA was extracted according to McInnes & Cutting( Reference McInnes and Cutting 41 ) using the MO BIO PowerLyzer PowerSoil Kit (MO BIO Laboratories) with bead beating using a vortex adaptor. The concentration of extracted DNA was quantified using a Qubit® 3.0 Fluorometer (Life Technologies). 16S rRNA gene amplicons were generated using a Fluidigm Access Array (Fluidigm Corporation) in combination with Roche High Fidelity Fast Start Kit (Roche). The primers 515F (5'-GTGYCAGCMGCCGCGGTAA-3') and 806R (5'-GGACTACNVGGGTWTCTAAT-3') that target a 252-bp fragment of the V4 region were used for amplification (primers synthesised by IDT Corp.)( Reference Caporaso, Lauber and Walters 42 ). CS1 forward tag and CS2 reverse tag were added according to the Fluidigm protocol. Quality of the amplicons was assessed using a Fragment Analyzer (Advanced Analytics) to confirm amplicon regions and sizes. A DNA pool was generated by combining equimolar amounts of the amplicons from each sample. The pooled samples were then size-selected on a 2 % agarose E-gel (Life technologies) and extracted using a Qiagen gel purification kit (Qiagen). Cleaned size-selected pooled products were run on an Agilent 2100 Bioanalyzer to confirm appropriate profile and average size. Sequencing was performed at the W. M. Keck Center for Biotechnology at the University of Illinois using an Illumina MiSeq using version 3 reagents (Illumina Inc.).
Quantitative PCR was performed according to previous methods( Reference Malinen, Rinttilä and Kajander 43 , Reference Rossi, Pengo and Caldin 44 ). Briefly, primers targeting all bacteria (universal primer), specific genera (Lactobacillus, Bifidobacterium, Blautia, Faecalibacterium and Fusobacterium) and specific species (Escherichia coli and Clostridium perfringens) were used. Real-time PCR conditions and primers used for Lactobacillus spp., Fusobacterium spp., Blautia spp., Faecalibacterium spp., Bifidobacterium spp. and C. perfringens have been described by Rossi et al.( Reference Rossi, Pengo and Caldin 44 ). Real-time PCR conditions and primers for E. coli have been described by Malinen et al.( Reference Malinen, Rinttilä and Kajander 43 ). Briefly, standard curves were generated using DNA (ranging from 2 ng to 0·2 pg) from lyophilised bacterial species of the genera (Faecalibacterium prausnitzii (ATCC 27766); Lactobacillus rhamnosus GG (ATCC 53103); Bifidobacterium bifidum (ATCC 11863); Blautia coccoides (ATCC 29236); Fusobacterium nucleatum (ATCC 25586)), clinical isolates from E. coli and C. perfringens and canine faecal community DNA for universal bacteria. The quantitative PCR (qPCR) data were expressed as log amount of DNA (fg) for each particular bacterial group per 10 ng of isolated total DNA( Reference Suchodolski, Markel and Garcia-Mazcorro 45 ).
High-quality (quality value>19) sequence data derived from the sequencing process were analysed using QIIME 1.9.1( Reference Caporaso, Kuczynski and Stombaugh 46 ). Briefly, sequence data derived from the sequencing process were demultiplexed. Sequences then were clustered into operational taxonomic units (OTU) using UCLUST( Reference Edgar 47 ) through a closed-reference OTU picking strategy against the Greengenes 13_8 reference database( Reference DeSantis, Hugenholtz and Larsen 48 ) with a 97 % similarity threshold. Singletons (OTU that were observed fewer than two times) and OTU that had less than 0·01 % of the total observation were discarded. Taxonomic identity to each OTU was then assigned using UCLUST. A total of 2 345 512 16S rRNA-based amplicon sequences were obtained, with an average of 86 870 reads (range=26 961–368 990) per sample. An even sampling depth (sequences per sample) of 26 961 sequences per sample was used for assessing alpha- and beta-diversity measures. Beta-diversity was calculated using weighted and unweighted UniFrac distance measures( Reference Lozupone and Knight 49 ).
Statistical analysis
On the basis of our previous feline (Deng et al.( Reference Deng, Beloshapka and Vester Boler 12 ); n 12) and canine (Lubbs et al.( Reference Lubbs, Vester Boler and Ridge 36 ), n 8; Deng et al.( Reference Deng, Jones and Swanson 50 ), n 6) experiments in this area, we estimated the need for nine dogs per treatment to reach a significance level of 0·05 with a power of 80 % for the variables of interest( Reference Deng, Beloshapka and Vester Boler 12 , Reference Lubbs, Vester Boler and Ridge 36 , Reference Deng, Jones and Swanson 50 ). As in our previous studies, we used a replicated 3×3 Latin square design so that each animal received each treatment/control provided. This design allowed the animals to serve as a self-control, reducing outcome variation and the number of animals needed.
All data, except faecal microbiota data, were analysed using SAS (version 9.3; SAS Institute) using the Mixed Models procedure, testing the main effect of experimental diet and including random effect of dog. Incremental AUC (IAUC)0–180 min data for glucose, active GLP-1 and insulin concentrations were calculated using all positive peak areas using GraphPad Prism version 6.0 (GraphPad Software) and statistically analysed using the Mixed Models procedure as repeated measures using ‘dog’ as a random variable. Data are reported as least square means with their standard errors with statistical significance set as P<0·05 and P<0·10 considered as trends. Faecal microbiota data were analysed using ANOVA and Tukey–Kramer multiple comparison tests with Statistical Analysis of Metagenomic Profiles software 2.1.3( Reference Parks, Tyson and Hugenholtz 51 ). Microbiota data are reported as means and standard deviations with statistical significance set as P<0·05 and P<0·10 considered as trends.
Results
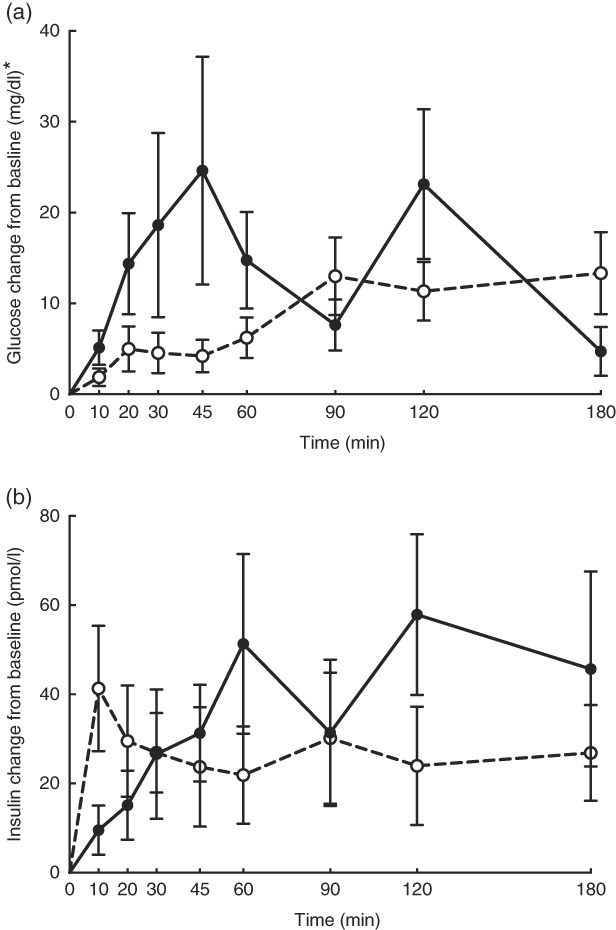
No adverse events were observed following prebiotic supplementation in any of the treatment groups. Food intake was rather comparable between dogs fed the high dose of prebiotic (175·4 g/d) and those of the control group (168·1 g/d), but it was greater (P<0·05) compared with dogs given the low-dose prebiotic (160·7 g/d). There were no differences among prebiotic treatments for baseline glucose, insulin or active GLP-1 concentrations. The respective postprandial IAUC0–180 values were numerically the lowest for dogs fed the high prebiotic dose, but did not reach statistical significance (Table 2, Fig. 1).

Fig. 1 Glucose (a) and insulin (b) concentrations in response to an oral glucose challenge test in dogs 8 h after consumption of 1 % of Orafti®SIPX (high-dose prebiotic; ![]() ,
, ![]() ) v. control (
) v. control (![]() ,
, ![]() ). * To convert glucose from mg/dl to mmol/l, multiply by 0·0555.
). * To convert glucose from mg/dl to mmol/l, multiply by 0·0555.
Table 2 Blood hormone and metabolite concentrations of prebiotic-supplemented dogs in response to an oral glucose tolerance test several hours after consumption of different prebiotic doses (Mean values with their standard errors)

IAUC, incremental AUC.
* To convert glucose from mg/dl to mmol/l, multiply by 0·0555.
† Fasting baseline insulin:glucose ratio.
Faecal characteristics and metabolites were affected by treatment (Table 3). Faecal DM percentage was lower (P<0·05) in dogs fed the high prebiotic dose compared with dogs fed the control, with dogs fed the low prebiotic dose being intermediate. Faecal pH and scores were not different among treatment groups. Faecal acetate concentrations were higher (P<0·05) in dogs fed the high prebiotic dose compared with those fed the low prebiotic dose or control. Faecal butyrate and propionate concentrations were higher (P<0·05) in dogs fed the high prebiotic dose than those fed the low prebiotic dose, with controls being intermediate. Total SCFA concentrations were higher (P<0·05) in dogs fed the high prebiotic dose compared with those fed either the low prebiotic dose or control. There was a trend for greater (P<0·10) faecal valerate concentrations in dogs fed the high prebiotic dose compared with dogs fed the control, with the dogs fed low prebiotic dose being intermediate. Faecal isovalerate, isobutryate, total BCFA, phenol, indole, total phenol+indole and ammonia concentrations were not significantly affected by treatment. Faecal deoxycholic acid (DCA), lithocholic acid (LCA) and total BA concentrations tended to be affected by treatment (P<0·10), with dogs fed the high prebiotic dose having numerically greater values than dogs fed the low prebiotic dose.
Table 3 Fresh faecal characteristics of prebiotic-supplemented dogs (Mean values with their standard errors)
BCFA, branched-chain fatty acids.
* Faecal scores: 1=hard, dry pellets; small hard mass; 2=hard formed, dry stool; remains firm and soft; 3=soft, formed and moist stool, retains shape; 4=soft, unformed stool; assumes shape of container; 5=watery, liquid that can be poured.
† Total SCFA=acetate+butyrate+propionate; total BCFA=valerate+isovalerate + isobutyrate.
a,b Mean values within a row with unlike superscript letters were different (P<0·05).
x,y Mean values within a row with unlike superscript letters tended to be different (P<0·10).
Faecal microbial species richness (alpha diversity; online Supplementary Fig. S1) was not affected by treatment. Neither unweighted nor weighted principal coordinate analysis plots of UniFrac distances (beta diversity) of faecal microbial communities (online Supplementary Fig. S2) revealed significant differences among treatments. Regarding specific microbial taxa, there were a few changes in the Erysipelotrichaceae family (Table 4). Faecal Coprobacillus was lower (P<0·05) in dogs fed the high prebiotic dose compared with those fed the control, with dogs fed the low prebiotic dose being intermediate. Faecal Eubacterium tended to be greater (P<0·10) in dogs fed the high prebiotic dose compared with dogs fed the control, with dogs fed the low prebiotic dose being intermediate. Faecal Erysipelotrichaceae, Turicibacter and Anaerobiospirillum tended to be different among treatments. Of the faecal microbiota measured by qPCR, Turicibacter was higher (P<0·05) in dogs fed the high prebiotic dose than those fed the control or low prebiotic dose (online Supplementary Table S1). None of the other microbiota were affected by treatment. There were no significant changes in the relative abundance of Bifidobacterium, Faecalibacterium, Lachnospira, Fusobacterium or Desulfovibrio as was hypothesised. Akkermansia was not detected in this study.
Table 4 Altered faecal microbiota populations of prebiotic-supplemented dogs using Illumina MiSeq sequencing (Mean values and standard deviations)

a,b Mean values within a row with unlike superscript letters were different (P<0·05).
x,y Mean values within a row with unlike superscript letters tended to be different (P<0·10).
Discussion
Investigating the ability of various fibre sources and whole foods to produce a second-meal effect has gained considerable interest since Staub and Traugott first reported it in the early 1920s( Reference Staub 10 , Reference Traugott 11 ). Table 5 summarises and compares some of the more recent studies with the present study.
Table 5 Recent studies investigating the second-meal effect of fibres and prebiotics
OGTT, oral glucose tolerance test; IAUC, incremental AUC.
Previously, our laboratory demonstrated that fermentable fibre could produce a second-meal effect in healthy female dogs, reducing glucose IAUC0–180 min ( Reference Deng, Beloshapka and Vester Boler 12 ). In the present study, baseline glucose, insulin or GLP-1 concentrations were not different. The second-meal effect, based on IAUC for glucose, as well as the IAUC for insulin, and GLP-1, were not affected by treatment. However, the IAUC for glucose and insulin was numerically lower in dogs fed the high prebiotic dose.
In addition, there were a few important differences between this study and those previously conducted in this area. First, the fibre inclusion rate used in our previous study was much higher (8 %=5 % pectin, 3 % inulin-type fructans) than that supplemented in the current study (0·5 % or 1·0 % of the diet). Second, the OGTT was conducted only 4 h after the morning meal in Deng et al.( Reference Staub 10 ) rather than the 8 h used in the current study. It is important to note that all the other studies were designed to mimic human eating patterns (meals separated by 4–5 h), whereas the present study was designed to mimic companion animal eating patterns in a typical household (meals separated by 8–9 h). Last, overweight dogs were used in the current study rather than healthy adult dogs used in Deng et al.( Reference Staub 10 ) Therefore, when compared with the other studies, it could be suggested that the lack of effect in the current study was because of the lower inclusion of fermentable substrate in the diet (1 %=2 g) or the extended amount of time between the morning meal and the OGTT.
In the current study, food intake was greater and faecal DM percentage was lower in dogs fed the high prebiotic dose. These were small numerical changes, however. Because all dogs consumed the diet without issues and maintained desirable faecal scores throughout the study, these differences are of little biological relevance. Faecal microbiota and metabolites were minimally altered owing to prebiotic treatment, but some beneficial shifts were noted. For example, faecal SCFA were greater in dogs fed the high prebiotic dose. The production of SCFA is beneficial to the host because they provide energy to colonocytes, reduce pH to limit pathogen growth and act as secondary messengers that stimulate gut peptide synthesis (i.e. GLP-1) and initiate other signal transduction pathways (i.e. increased glucose utilisation and decreased glucose production)( Reference Roediger 54 – Reference Topping and Clifton 56 ). The fermentation of protein produces some SCFA, but also a lot of putrefactive compounds including phenols, indoles, ammonia and biogenic amines that contribute to faecal odour and may be detrimental to colon health( Reference Cummings and Macfarlane 57 , Reference Macfarlane and Allison 58 ). Indole concentrations were numerically lower in dogs fed the higher prebiotic dose, but overall the protein fermentation products were not greatly altered by prebiotic supplementation in this study.
BA are efficiently reabsorbed (95 %) in the distal ileum. The 5 % of BA that are not reabsorbed will reach the colon and be excreted in the faeces. While in the colon, some bacteria can convert primary BA (cholic acid (CA); chenodeoxycholic acid (CDCA)) into secondary BA (LCA; DCA) through dehydroxylation reactions( Reference Ridlon, Kang and Hylemon 59 ). Many additional organisms possess other BA metabolic activities, and thus changes to the microbiota can influence the BA pool( Reference Ridlon, Kang and Hylemon 59 , Reference Suchodolski 60 ). Although there are very little data on faecal BA profiles in dogs, one small study (n 3) characterised the BA present in the gallbladder and determined that 99 % of them were CA, DCA or CDCA( Reference Washizu, Ikenaga and Washizu 61 ). Another study showed that dogs with inflammatory bowel disease have a greater primary BA concentration and a lower secondary BA concentration compared with healthy controls( Reference Honneffer, Guard and Steiner 62 ).
BA synthesis from endogenous cholesterol in the liver serves as the major route of cholesterol excretion from the body. Fibre supplementation has been shown to lower blood cholesterol concentrations in humans, probably because of increased BA excretion. Rémésy et al.( Reference Rémésy, Levrat and Gamet 63 ) reported that inulin supplementation in mice made BA less soluble and enhanced their excretion in faeces. It is hypothesised that this is because of the production of SCFA from inulin fermentation, which lowers the luminal pH of the small intestine and hinders BA reabsorption. To our knowledge, we are the first to investigate changes in the faecal BA pool after inulin supplementation in dogs. In this study, faecal LCA, DCA and total BA tended to be affected by prebiotic supplementation. Our finding that inulin supplementation, at 1 % of the diet, tended to increase total faecal BA supports this hypothesis.
It is well established that fermentable fibres and prebiotics can alter the gastrointestinal microbiota. Although we hypothesised that supplementation with the inulin prebiotic would beneficially shift the faecal microbiota, resulting in an increased relative abundance of Bifidobacterium, Faecalibacterium, Akkermansia and Lachnospira and a decreased relative abundance of Fusobacterium and Desulfovibrio, these changes were not observed in this study. Although those taxa were not altered, there was a decrease in Coprobacillus and there tended to be an increase in Eubacterium and Turicibacter in response to treatment with prebiotic. In a recent study by Garcia-Mazcorro et al.( Reference Garcia-Mazcorro, Barcenas-Walls and Suchodolski 22 ), various breeds of dogs were supplemented with a prebiotic blend, containing inulin, making up approximately 0·5 % of the diet on a DM basis. Similar to the present study, no significant treatments clustered in the unweighted or weighted principal coordinate analysis plots. The microbial changes we observed in this study were not altered in that study( Reference Garcia-Mazcorro, Barcenas-Walls and Suchodolski 22 ). The bacteria belonging to the family Erysipelotrichaceae possess bile-salt hydrolase genes, which may modify BA via deconjugation( Reference Labbe, Ganopolsky and Martoni 64 ). An increase in BA in the colon may allow bile-metabolising bacteria such as those present in the Erysipelotrichaceae family to flourish. In this study, we show that the relative abundance of some Erysipelotrichaceae increased while others decreased, suggesting that its overall effect on the host is unknown. There is little information about the significance of Turicibacter in the canine gastrointestinal tract, although Turicibacter is reported to be lower in dogs with GI inflammation( Reference AlShawaqfeh, Wajid and Minamoto 65 ). In contrast, another study reported that bacteria belonging to the family Turicibacteraceae were more abundant in dogs with active inflammatory colorectal polyps compared with healthy controls( Reference Igarashi, Ohno and Horigome 66 ). Although overweight, all dogs in the current study were otherwise healthy, so the relevance of this change in abundance in this study is unknown. Although substantial changes to the relative abundance of faecal microbial taxa were not observed, changes in gene expression/functional capacity of the microbiome may be important and should be examined in future studies.
There were some important study limitations that probably contributed to the lack of significant results. After study completion, a retrospective power analysis for ANOVA was conducted using G*Power (Heinrich-Heine University). IAUC data for glucose, insulin and active GLP-1, as well as faecal total SCFA data, were used to determine effect size. Although we estimated that 9 dogs were needed per treatment to reach a power of 80 %, retrospective power analysis reveals that the predicted number of animals was too small, and a power of only 40 % was achieved. Lack of significant outcomes with respect to the second-meal effect may be a result of under-powering. In addition, although a lower dose of the prebiotic was intentionally selected to represent a feasible inclusion level from a consumer (cost) prospective, it was insufficient to produce significant results.
In summary, this study suggests that low doses of prebiotic inulin are not sufficient to produce a significant second-meal effect in overweight dogs. As the study was underpowered, as analysed by a retrospective power analysis, future trials with increased animal or human participant numbers are warranted. The prebiotic did result in an increase in relative abundance of some members of the phylum Firmicutes and a decrease in the relative abundance of some Proteobacteria. In addition, supplementation with the prebiotic tended to increase the total concentration of excreted faecal BA, particularly secondary BA. These findings provide valuable information that may be used to design future studies investigating the ability of different prebiotics to produce a second-meal effect and the dosage required. Further studies in dogs and humans may provide new insights as to how prebiotic fibres can contribute to a second-meal effect and elicit shifts in the gastrointestinal microbiome and BA pool.
Acknowledgements
The authors sincerely thank Kiley Algya, Toshiro Baba, Laura Bauer, Amanda Dainton, Katelyn Detweiler, Chelsea Iennarella, Daisy Ignatova, Jessica Kordas, Anne Lee, Ching-Yen Lin, Lexi Meverden, Juliana Nogueira, Thunyaporn Phungviwatnikul, Karine Santos and Zachary Traughber for their involvement in sample collections.
This study was supported by Beneo GmBH.
K. S. S. designed the experiment. C. A., T.-W. L. C. and S. D. performed the animal trials and laboratory analyses. C. A. performed the statistical analysis and wrote the manuscript.
F. N. and S. T. are employed by Beneo GmBH. The rest of the authors have no conflicts of interest to declare.
Supplementary material
For supplementary material/s referred to in this article, please visit https://doi.org/10.1017/S0007114518001952