BMI has been the most commonly used measure of adiposity in epidemiological research. Numerous studies have found that obesity, defined by BMI, to be a significant risk factor for many diseases( Reference Renehan, Tyson and Egger 1 , Reference Kopelman 2 ). However, BMI, which is calculated by weight in kilogram divided by height in meter squared, reflects both lean body mass and fat mass. Lean body mass accounts for most of the human body and is known to play an important role in many physiological processes (e.g. physical, social and metabolic functions)( Reference Wolfe 3 ). Reduction in lean body mass may have negative effects on many health outcomes( Reference Wolfe 3 – Reference Ruiz, Sui and Lobelo 5 ). On the other hand, excess body fat is linked to adverse metabolic disease risks( Reference Goodpaster, Krishnaswami and Harris 6 ). Among those with the same weight or BMI, different body composition in terms of lean body mass and fat mass could result in different health outcomes. Moreover, lean body mass is even more important for the elderly population because ageing is related to substantial decrease in lean body mass and increase in fat mass( Reference Castillo, Goodman-Gruen and Kritz-Silverstein 7 ). In recent years, studies have suggested that sarcopenia (i.e. ageing-related loss of muscle) and sarcopenic obesity (i.e. age related loss of muscle and increase in fat mass) are associated with various medical conditions, including functional status, falls and mortality( Reference Visser and Schaap 8 , Reference Stenholm, Harris and Rantanen 9 ). Therefore, explicit understanding of these two compartments of the body can provide important insights and may help explain controversial issues around optimal weight for health in general and patient populations( Reference Kalantar-Zadeh, Horwich and Oreopoulos 10 – Reference Dixon and Egger 13 ).
Assessing body composition is difficult in large epidemiological studies because it requires sophisticated and expensive technologies such as dual-energy X-ray absorptiometry (DXA) or imaging techniques (i.e. MRI and computerised tomography). Therefore, research to examine the effect of body composition on health outcomes have largely been hampered due to practical issues. On the other hand, anthropometric measures are simple, cheap and non-intrusive, and hence are frequently measured in large health surveys and cohort studies. For this reason, efforts have been made to develop prediction equations for lean body mass and fat mass using anthropometric measures. However, no consensus has been made to date for anthropometric equations that could be validly used in clinical and epidemiological studies. Most of the previously developed equations were not cross-validated in a validation sample( Reference Al-Gindan, Hankey and Leslie 14 ), and the validated equations were limited in generalisability due to small sample size and narrow range of subject characteristics (e.g. age, race and BMI). These equations could not be widely used in epidemiological studies due to low predictive power and less practicality. To our knowledge, no studies have validated their equations using obesity-related biomarkers.
The purpose of this study was to develop simple anthropometric prediction equations for lean body mass, fat mass and percent fat using the large samples of the National Health and Nutrition Examination Survey (NHANES) 1999–2006 in order to provide updated and unified equations to estimate body composition in both clinical and epidemiological settings. Furthermore, we validated our anthropometric prediction equations using biomarkers to examine whether the predicted body composition scores are useful to predict obesity-related biomarkers.
Methods
Study population
Participants were from the NHANES, which is a cross-sectional survey of the health and nutritional status of the non-institutionalised civilians in the USA conducted by the National Center for Health Statistics and Centers for Disease Control and Prevention( Reference Evans 15 ). The survey sampled participants using a complex multistage probability sampling design to allow generalisability of the results to the rest of the population. The current study used four cycles of the continuous NHANES data from 1999 to 2006. The study sample was restricted to adult (≥18 years old) who had information on DXA measurements (n 18 750). We excluded participants who had no information on anthropometric measures (n 4685). After exclusion, there were 7531 males and 6534 females who had all information on DXA and anthropometric measures.
Dual-energy X-ray absorptiometry measurements
Whole-body DXA were performed at the Mobile Examination Center using a Hologic QDR 4500 A fan beam X-ray bone densitometer (Hologic Inc.). Participants were excluded if they had radiographic contrast material tests in the past 72 h or a nuclear medicine test in the past 3 d or if they exceeded self-reported weight over 300 pounds or height over 6'·5''. All DXA scans were reviewed for quality control and analysed using Hologic Discovery software, version 12.1, to derive total and regional body composition including lean body mass, fat mass, percent fat and bone mineral content. Invalid DXA scans were coded as missing in the data files and missing DXA values were imputed using a multiple imputation method. For this study, we used the data for total lean body mass, excluding bone density mineral, total fat mass and total percent fat.
Anthropometric measurements
Anthropometric measures were measured by trained health technicians at the mobile examination center following the standard protocols( Reference Evans 16 ). Standing height was measured with a stadiometer to the nearest 0·1 cm. Weight was measured to the nearest 0·1 kg using a Toledo digital scale (Mettler-Toledo Inc.). BMI was calculated as weight in kilograms divided by height in metres squared. Waist circumference was assessed with a measuring tape at the uppermost lateral border of the hip crest (ilium) to the nearest 0·1 cm. Other circumferences such as arm circumference, calf circumference and thigh circumference were measured with a tape to the nearest 0·1 cm. Skinfold thickness of triceps and subscapular were measured with a Holtain caliper (Holtain Ltd) to the nearest 0·1 mm.
Other covariates
Information on other predictors such as age and race/ethnicity were collected via household interview by trained interviewers during the study period.
Biomarker collection
Laboratory-based biomarkers from the continuous NHANES 1999–2006 were used to further validate the developed anthropometric prediction equations. TAG, total cholesterol (TC), LDL-cholesterol, HDL-cholesterol, plasma glucose, insulin, C-reactive protein (CRP), and plasma creatinine were measured using the standard techniques. Fasting measures (i.e. TAG, LDL, insulin and plasma glucose) were assessed in a sub-sample of participants, and those who had fasted for at least 8·5 h were included in the analysis. Detailed information on these measurements is available from the NHANES web site( Reference Roubenoff and Hughes 17 ).
Statistical analysis
We used the existing large sample of the NHANES 1999–2006 to conduct a secondary analysis.
All analyses were conducted separately by sex. To develop the prediction equations for lean body mass, fat mass and percent fat, we first divided all participants randomly into two independent groups using a random number generator: a prediction group was used to develop prediction equations, and a validation group served as a validation data set. The ratio of prediction group and validation group was 70:30. Participant characteristics between the two groups were compared using a Student’s t test for continuous variables and a χ 2 test for categorical variables.
Using the prediction group, we conducted a series of multivariable linear regressions to predict each of the DXA-measured lean body mass, fat mass and percent fat as a dependent variable in relation to the following anthropometric measures as predictor variables. We examined the following anthropometric measures as a continuous variable: height (cm), weight (kg), BMI (kg/m2), waist circumference (cm), other circumference measures (i.e. arm, calf and thigh (cm)) and skinfold measures (i.e. triceps and subscapular (mm)). All models additionally included age (years) and race (i.e. White, Black, Mexican American, Hispanic, Others). Polynomial terms and two-way interaction terms were included in the model to test whether these terms improved the predictive power of the model. If there was no substantial improvement in the model, interaction terms were omitted to keep our models parsimonious. Coefficient of determination (R 2) and standard error of estimate (SEE) were used to compare different models and determine the most accurate model to use for prediction. Of note, R 2 and adjusted R 2 were approximately the same due to the large sample size of the study.
For validation, we calculated predicted lean body mass, fat mass and percent fat scores using the developed anthropometric equations for all participants in the validation group. Then we compared the predicted scores and DXA-measured values in the validation group for cross-validation. First, Paired t test was used to check the difference between predicted values and DXA-measured values. Second, correlation coefficients were calculated to assess the degree of agreement between predicted scores and DXA-measured values in the validation group. Third, R 2 and SEE of the fitted models from the prediction group and validation group were compared. Fourth, we further validated our predicted values for fat mass and percent fat by calculating the correlation of each of these with obesity-related biomarkers. There was no strong statistical evidence for non-linear relationships between adiposity measures and obesity-related biomarkers. To remove extraneous variation due to height which is unrelated to obesity-related biomarkers, predicted fat mass was further adjusted for height in the correlation analyses. If these correlations are similar, or higher, than the correlations of the obesity-related biomarkers with BMI and the actual DXA-measured values, then we considered our predicted values to be sufficiently accurate. Moreover, we further tested whether predicted fat mass or percent fat was significantly better in predicting obesity-related biomarkers, and whether the one equation was superior to the other equations. We calculated sample-weighted Pearson’s correlation coefficients of BMI and DXA-measured and predicted values with log biomarkers. To test for differences in correlation coefficients, Wolfe’s test was used to compare dependent correlation coefficients estimated in the same sample( Reference Rosner 18 ). Multiple comparisons were adjusted using Bonferroni correction. Lastly, we plotted receiver operating characteristic curves and calculated sample-weighted area under the receiver operating characteristic curves for BMI and predicted values to compare the ability to discriminate abnormal values for TAG (≥150 mg/dl; ≥1·7 mmol/l), TC (≥200 mg/dl; ≥5·2 mmol/l), HDL-cholesterol (<40 mg/dl (<1·0 mmol/l) for men, <50 mg/dl (<1·3 mmol/l) for women) and glucose (≥100 mg/dl; ≥5·6 mmol/l)( Reference Grundy, Brewer and Cleeman 19 ).
All statistical tests were two-sided and analysed using SAS version 9.4 (SAS Institute Inc.), SAS-callable Sudaan (Research Triangle Institute) and STATA, version 14.0 (Stata Corporation). Complex sampling of the NHANES data were properly accounted by using provided sample weights( Reference Wolfe 3 , Reference Frontera, Hughes and Fielding 20 ).
Results
Participants’ characteristics stratified according to sex in the prediction group and validation group are presented in Table 1. The average age was 42·7 (sd 22·4) for men and 45·3 (sd 24·2) for women. The mean BMI was slightly higher in men (26·6 kg/m2) than in women (25·8 kg/m2), though the variability was higher in women (sd of 8·7 v. 5·8 kg/m2). On average, men had 18 kg higher lean body mass and 4 kg lower fat mass, and consequently 11 % lower percent fat, compared with women. Moreover, men had higher variation in lean body mass, whereas women had higher variation in fat mass. The majority of the participants were Whites (approximately 50 %). Overall, there were no significant differences in age, anthropometric measures, actual body composition and race/ethnicity distribution between the prediction group and validation group for both men and women.
Table 1 Characteristics of participants in the prediction and validation group sampled from the National Health and Nutrition Examination Survey (1999–2006)Footnote * (Mean values and standard deviations)

* Analysis included all subjects who had dual-energy X-ray absorptiometry and anthropometric measurements.
† Weighted number of participants.
Prediction and validation of lean body mass
The proposed anthropometric equations are shown in Table 2. The simplest model including age, height, and weight explained 88 and 85 % of the variation in lean body mass for men and women, respectively. For men, adding waist circumference in the model significantly increased the R 2 from 88 to 91 % and decreased SEE from 2·96 to 2·55 kg, indicating improved predictive ability of the model. Moreover, addition of other circumference measures (i.e. arm, calf and thigh circumferences) and skinfold measures (i.e. triceps and subscapular) slightly improved the prediction model for men. For women, adding waist circumference in the model did not substantially change R 2 and SEE, but there was a slight improvement of the model when additional other circumference and skinfold measures were included. Adding polynomial and/or interaction terms did not significantly improve the models (data not shown).
Table 2 Anthropometric prediction equations for lean body mass, fat mass and percent fat in the prediction group sampled from the National Health and Nutrition Examination Survey (1999–2006)Footnote *
Sub, subscapular; SEE, standard error of estimate.
* Analysis included all subjects who had dual-energy X-ray absorptiometry and anthropometric measurements
† For race variable, White is the reference group.
‡ Unit for dependent variables: lean body mass (kg), fat mass (kg), percent fat.
When equations were further evaluated in the validation group, there was no significant difference between DXA-measured and predicted lean body mass in both men and women (Table 3). Moreover, R 2 and SEEs in the validation group were approximately the same to those in the prediction group.
Table 3 Validation of anthropometric prediction equations for lean body mass, fat mass and percent fat in the validation group sampled from the National Health and Nutrition Examination Survey (NHANES) (1999–2006)Footnote *
SEE, standard error of estimate; DXA, dual-energy X-ray absorptiometry.
* Analysis included all subjects who had DXA and anthropometric measurements from the NHANES 1999–2006.
† Unit for difference (DXA-equation), sd and SEE: lean body mass (kg), fat mass (kg), percent fat.
Prediction and validation of fat mass
The simplest model including age and BMI explained 86 and 93 % of the variation in fat mass for men and women, respectively (Table 2). For men, adding waist circumference in the model substantially increased the R 2 and decreased SEE (R 2=0·90, SEE=2·60 kg). The addition of other circumference measures was not helpful though addition of skinfold measure improved the model for men (R 2=0·93, SEE=2·16 kg). For women, the simplest model had relatively high predictive ability (R 2=0·93, SEE=2·45 kg), and addition of other anthropometric measures only slightly improved the model. Similar to lean body mass, no significant improvement was shown when polynomial and/or interaction terms were included in the models (data not shown).
When equations were cross-validated in the validation group, there was no significant difference between DXA-measured and predicted fat mass in both men and women (Table 3). Moreover, R 2 and SEE in the validation group were similar to those in the prediction group.
Prediction and validation of percent fat
Compared with the equations for lean body mass and fat mass, the proposed equations for percent fat showed relatively lower R 2 for both men (ranging from 0·61 to 0·81) and women (ranging from 0·64 to 0·72). However, the general trend in variation explained with additional waist and other circumferences was similar. But, addition of skinfold measures substantially improved the predictive power for percent fat for both sexes. Similarly, validation of the proposed equations for percent fat in the validation group showed consistent results as the equations for lean body mass and fat mass.
Validation using biomarkers
The proposed equations were further validated using biomarkers with all participants in the NHANES 1999–2006 (Table 4). Predicted fat mass adjusted for height and percent fat scores were positively associated with TAG, TC, LDL, glucose, insulin and CRP, and inversely associated with HDL. Moreover, correlation coefficients of predicted fat mass adjusted for height and percent fat with biomarkers were consistent across different equations. The equation 3 and 4 were not significantly better than the equation 2. Compared with BMI, the correlations with TAG, TC, LDL, glucose and CRP were significantly stronger for predicted fat mass adjusted for height and predicted percent fat. The magnitude of associations was significantly higher for percent fat in most obesity-related biomarkers. When the correlation coefficients between DXA-measured values and biomarkers, and the correlation coefficients between predicted values (derived from the equation 2) and biomarkers were compared in the validation group, there were no significant differences in predicting obesity-related biomarkers between DXA measurements and predicted scores, except that predicted fat mass adjusted for height and percent fat predicted glucose better in men, and predicted percent fat predicted TC and glucose better in women (Fig. 1). Moreover, DXA-measured lean body mass and predicted lean body mass score showed comparable correlations with serum creatinine, after adjusting for height (data not shown). Consistent with the correlation analyses, predicted fat mass adjusted for height and percent fat (derived from the equation 2) had a higher AUC than that of BMI in terms of discriminating the abnormal values for TAG, TC and glucose for both men and women (online Supplementary Fig. S1).
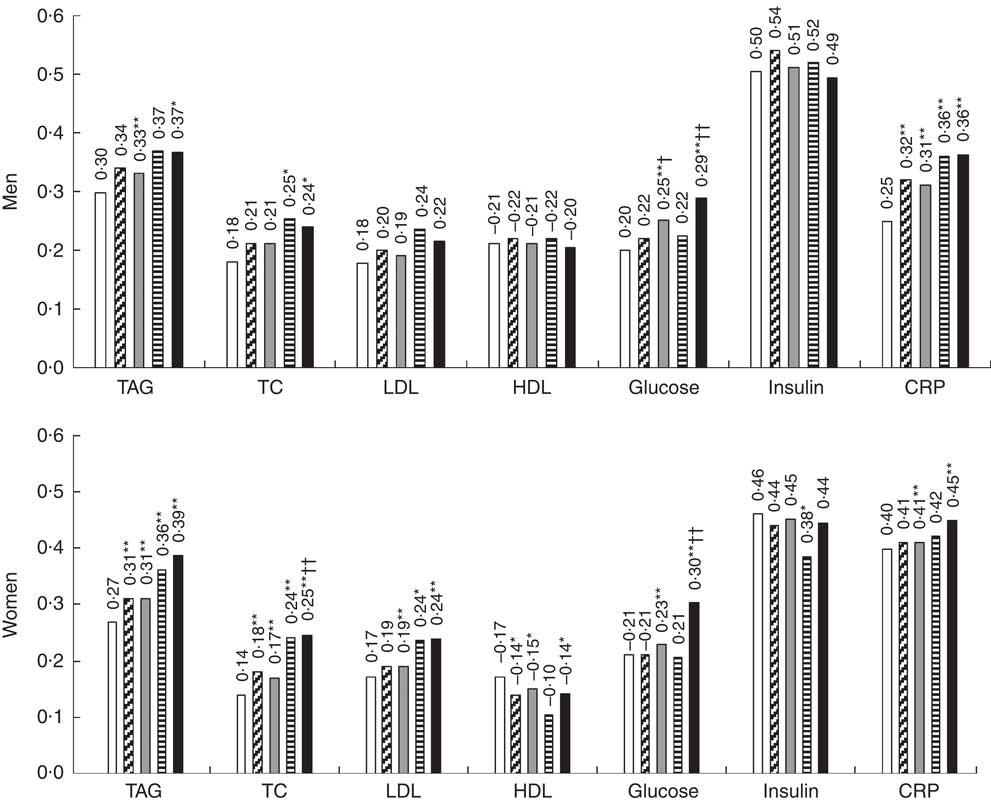
Fig. 1 Correlation coefficient of dual-energy X-ray absorptiometry (DXA)-measured, predicted fat mass and percent fat with obesity-related biomarkers in the validation group sampled from the National Health and Nutrition Examination Survey (NHANES) (1999–2006). ![]() , BMI;
, BMI; ![]() , DXA fat mass;
, DXA fat mass; ![]() , predicted fat mass;
, predicted fat mass; ![]() , DXA percent fat;
, DXA percent fat; ![]() , predicted percent fat; TC, total cholesterol; CRP, C-reactive protein. Predicted fat mass and percent fat were calculated using anthropometric equation 2. Height-adjusted DXA fat mass and predicted fat mass were used in the analyses. Biomarkers were log transformed. Analysis included all subjects who had DXA, anthropometric measurements and biomarkers from the NHANES 1999–2006. * P<0·01 (BMI v. predicted scores), ** Bonferroni-corrected P<7·1×10−4 (BMI v. predicted scores); † P<0·01 (DXA v. predicted scores); †† Bonferroni-corrected P<7·1×10−4 (DXA v. predicted scores).
, predicted percent fat; TC, total cholesterol; CRP, C-reactive protein. Predicted fat mass and percent fat were calculated using anthropometric equation 2. Height-adjusted DXA fat mass and predicted fat mass were used in the analyses. Biomarkers were log transformed. Analysis included all subjects who had DXA, anthropometric measurements and biomarkers from the NHANES 1999–2006. * P<0·01 (BMI v. predicted scores), ** Bonferroni-corrected P<7·1×10−4 (BMI v. predicted scores); † P<0·01 (DXA v. predicted scores); †† Bonferroni-corrected P<7·1×10−4 (DXA v. predicted scores).
Table 4 Correlation coefficient of predicted fat massFootnote * and percent fat scores with obesity-related biomarkersFootnote † in the National Health and Nutrition Examination Survey (NHANES) (1999–2006)Footnote ‡
TC, total cholesterol; CRP, C-reactive protein.
* Height-adjusted predicted fat mass was used in the analyses.
† Biomarkers were log transformed. To convert TAG in mg/dl to mmol/l, multiply by 0·0113. To convert TC, LDL and HDL in mg/dl to mmol/l, multiply by 0·0259. To convert glucose in mg/dl to mmol/l, multiply by 0·0555. To convert insulin in μU/ml to pmol/l, multiply by 6·945. To convert CRP in mg/dl to nmol/l, multiply by 95·24.
‡ Analysis included all subjects who had anthropometric measurements and biomarkers from the NHANES 1999–2006.
§ Bonferroni-corrected P<5·0×10−4 (BMI v. predicted fat mass/percent fat 2).
|| Bonferroni-corrected P<5·0×10−4 (predicted fat mass/percent fat 2 v. predicted fat mass/percent fat 3 and 4).
¶ Bonferroni-corrected P<5·0×10−4 (predicted fat mass 2 v. predicted percent fat 2).
Validation in subgroups
For an additional validation in subgroups of the validation group, equation 2, which used age, race, height, weight and waist circumference, was chosen a priori as the most practical equation, considering the availability of anthropometric measures in large epidemiological studies (online Supplementary Table S2). Subgroup of participants with diseases or age over 65 years tended to have slightly lower R 2 and higher SEE, but in general R 2 and SEE were consistent across different subgroups (i.e. disease status, age, BMI, smoking status and race/ethnicity).
Discussion
In this study, we developed and validated anthropometric prediction equations to estimate lean body mass, fat mass and percent fat using the large representative sample of the US population (NHANES data). Given the practicality of anthropometric measures in the clinical and epidemiological settings, we considered four equations using different combinations of weight, height, waist circumference, other circumference and skinfold measures. Overall, the proposed equations had good predictive ability to assess lean body mass, fat mass and percent fat. Furthermore, the anthropometric equation with weight, height and waist circumference, which was selected a priori as the most practical equation, showed valid results with high predictive ability that has the potential to be widely used in epidemiological settings.
A number of studies have previously developed anthropometric prediction equations for body composition, but only a few of them were validated and/or aimed to directly estimate lean body mass or skeletal muscle mass( Reference Al-Gindan, Hankey and Govan 21 – Reference Lee, Wang and Heo 24 ). One study used a large sample of Indian subjects to develop anthropometric prediction equations for lean body mass using DXA as a reference method( Reference Kulkarni, Kuper and Taylor 23 ). These equations showed high R 2 ranging from 0·90 to 0·94 and low SEE ranging from 1·5 to 1·9 kg. However, the study sample being restricted to the Indian population limited the generalisability of the proposed equations to other racial/ethnic populations. Moreover, two studies developed and validated anthropometric equations for skeletal muscle mass using MRI as a reference method. Lee et al.( Reference Lee, Wang and Heo 24 ) proposed two equations (i.e. body weight and height model, and skinfold-circumference model) using 244 multi-ethnic subjects. The skinfold-circumference model had a high predictive ability (R 2=0·91 and SEE=2·2 kg) whereas the simple body weight and height model had a relatively lower R 2 of 0·86 and a SEE of 2·8 kg. However, the skinfold measures are less practically applicable and the predictive ability for skeletal muscle mass could have been overestimated by failing to distinguish between men and women in the prediction models. More recently, one study proposed more practical anthropometric prediction equations for men and women, separately( Reference Al-Gindan, Hankey and Govan 21 ). For men, the equation including age, weight, waist and hip circumferences had a R 2 of 0·76 and a SEE of 2·7 kg. For women, the equation including age, weight, height and hip circumference had a R 2 of 0·58 and a SEE of 2·2 kg. Despite the high practicality of the models, low predictive power for skeletal muscle mass limited the applicability of these equations. Moreover, study subjects were restricted to those who participated in studies that used whole-body MRI.
In contrast to these previous studies, our study included the largest nationwide representative samples from the NHANES. Compared with the previously developed equations, our equation including age, race, weight, height and waist circumference showed substantially higher predictive ability for both men (R 2=0·91) and women (R 2=0·85). The SEEs of the equations were comparable with the previously proposed equations. Interestingly, the contribution of waist circumference to the explained variation in the lean body mass was large only in men, for whom lean body mass was highly inversely associated with waist circumference, whereas positively associated with weight and height. Given the same age, race, weight and height, lower waist circumference was associated with higher lean body mass. This difference by sex could be because men tend to accumulate fats in abdominal area, whereas women are more likely to accumulate fat in other areas.
The effort to estimate body fat using anthropometric measures has been made with diverse populations using different reference methods. In 2014, Cui et al.( Reference Cui, Truesdale and Cai 25 ) evaluated the validity of previously published anthropometric equations for percent fat using the NHANES data. Most of the equations had moderate R 2 between 0·5 and 0·7. Moreover, the equations with waist circumference performed well in men, whereas the equation with BMI performed adequately in women. However, most equations had substantial non-systematic and systematic biases when evaluated in a representative sample. Our equations for percent fat showed similar results but no substantial bias was found when cross-validated in the overall, and subgroups of, validation group, although R 2 were generally lower among older individuals. One recent study developed valid and unbiased equations for percent fat using the NHANES but the actual coefficients of the practical equations that do not include circumference measures were not provided( Reference Stevens, Ou and Cai 26 ). Many large prospective studies have measures of height, weight, waist and hip circumferences, but rarely skinfold and other circumference measures. Moreover, these equations were not further validated using obesity-related biomarkers. Another study proposed an equation for total adipose tissue fat mass using MRI as a reference method. The equations including hip and/or waist circumference showed slightly higher accuracy (men: R 2=0·82, SEE=2·8 kg; women: R 2=0·89, SEE=3·4 kg), compared with the simpler equations including weight and/or waist circumference (men: R 2=0·79, SEE=3·0 kg; women: R 2=0·88, SEE=3·4 kg). Our comparable equations for fat mass including BMI and waist circumference showed higher R 2, particularly in men, and lower SEE in general. Consistent with previous studies, waist circumference was a strong predictor in men, whereas BMI was strongly associated with fat mass in women.
We further validated our anthropometric prediction equations in subgroups of the validation group. Although several equations developed previously have showed a moderate predictive ability, most of them were not validated in subgroups of population with restricted characteristics. Therefore, there could be systematic errors when those equations are applied to other populations with different characteristics. On the other hand, our equations were further validated in different subgroups of the validation group. The predictive ability was slightly lower among those with older age or diseases that could affect body composition (e.g. cancer, thyroid or liver diseases), but R 2 and SEE were generally consistent across subgroups. There were no significant differences between DXA-measured and predicted values, indicating robustness of our equations in populations with diverse characteristics.
We additionally evaluated the validity of predicted fat mass and percent fat derived from the proposed equations using biomarkers as objective measure of obesity. To account for variation in body size, fat mass adjusted for height was used instead of absolute fat mass. Although predicted fat mass is intuitive to use as it is, we suggest further adjusting for height when predicted fat mass is used as a measure of obesity to examine the relationship with health outcomes. Interestingly, we found strong correlations of predicted fat mass adjusted for height and percent fat with obesity-related biomarkers. The more complex equations were not superior than the simpler equation including age, race, height, weight and waist circumference. The correlations were significantly stronger than those for BMI. Moreover, correlation coefficients for predicted and direct DXA measurements were similar or even better in some biomarkers for predicted scores. These results showed that we do not lose much in large epidemiological studies by not having direct measurements, but equation-derived fat mass adjusted for height and percent fat were more useful than BMI in predicting obesity-related biomarkers, which are associated with chronic diseases( Reference Ridker 27 – Reference Kahn, Hull and Utzschneider 30 ). Although lean body mass could not be thoroughly validated using biomarkers, we found a consistent and significant correlation of height-adjusted DXA-measured and predicted lean body mass with serum creatinine, which is a byproduct of muscle metabolism. This result suggested that, on relative scale, predicted lean body mass could be as good as DXA-measured lean body mass. Overall, the validation tests showed promising results that our anthropometric prediction equations could be a valuable tool in estimating body composition in wide epidemiological settings. With these equations, future studies could be done efficiently to better understand the critical role of body composition (e.g. body fat, sarcopenia, sarcopenic obese, etc.) on various health outcomes, including chronic diseases and mortality.
To our knowledge, this is the largest study using a nationally (US) representative sample to develop and validate anthropometric equations for lean body mass, fat mass and percent fat. A large number of subjects with wide range of diverse characteristics, including those who were severely obese or sarcopenic obese, allowed us to develop equations with high precision. Moreover, validations of the proposed equations in different subgroups and using biomarkers further confirmed the generalisability of our equations and the usefulness of predicted body composition scores to predict health outcomes in epidemiological settings.
There are limitations in this study. First, anthropometric measures that were not assessed in the NHANES (e.g. hip circumference) could not be considered in the development of equations. However, previously published equations including hip circumference were not superior to our equations with waist circumference. Moreover, simpler equations are preferable as hip circumference is less frequently measured in large health surveys or cohort studies. Second, although our equations were developed from the large samples including multi-ethnic groups, the proposed equations may not be generalisable to other race/ethnic groups or those with different characteristics.
In conclusion, we developed and validated anthropometric equations with a large representative sample of the NHANES 1999–2006. The simple anthropometric prediction equation derived using weight, height and waist circumference was useful to predict the actual lean body mass, fat mass and percent fat, especially for men. Our validation results showed robust evidence that the proposed equations could be validly used in wide epidemiological settings to assess body composition.
Acknowledgements
This research received no specific grant from any funding agency, commercial or not-for-profit sectors.
Conception or design of the work: D. H. L., E. L. G.; data collection: D. H. L.; data analysis, interpretation, critical revision of the article and final approval of the version to be published: D. H. L., N. K., F. B. H., E. J. O., E. B. R., Q. S., W. C. W., E. L. G.; drafting the article: D. H. L.
The authors declare that there are no conflicts of interest.
Supplementary material
For supplementary material/s referred to in this article, please visit https://doi.org/10.1017/S0007114517002665