


Chronic kidney disease (CKD) is increasingly recognised as a major global public health problem( Reference Jha, Garcia-Garcia and Iseki 1 ). Patients with CKD are at an increased risk for CVD, end-stage renal disease and all-cause mortality. Primary prevention of CKD is therefore clearly an important public health priority.
One modifiable factor that could reduce the risk of CKD may be diet. Evidence suggests that diets low in animal protein, animal fat, cholesterol and Na and high in β-carotene may be protective against renal dysfunction( 2 ). However, as the examination of nutrients only is unlikely to completely reflect health effects of diet, studying food groups may be a useful complementary approach. We recently found that coffee consumption was associated with a slightly higher estimated glomerular filtration rate (eGFR; lower eGFR may be a marker of renal damage)( Reference Herber-Gast, van Essen and Verschuren 3 ). We also found a higher low-fat dairy product consumption to be associated with less annual decline in eGFR( Reference Herber-Gast, Biesbroek and Verschuren 4 ). A link between consumption of whole grains, fruit and vegetables, for instance, and renal function may be plausible too, as these food groups have earlier been associated with type 2 diabetes and CVD, which are related to renal dysfunction( Reference Chanson-Rolle, Meynier and Aubin 5 – Reference Mellen, Walsh and Herrington 9 ). Indeed, cross-sectional findings from the Multi-Ethnic Study of Atherosclerosis (MESA) showed that higher consumption of whole grains and fruit was associated with lower albumin:creatinine ratio (ACR; greater ACR may be a marker of renal damage)( Reference Nettleton, Steffen and Palmas 10 ). These associations may partly be attributable to major components of these food groups, such as fibre, Mg, antioxidants and several B vitamins( Reference Chen, Yang and Hsiao 11 – Reference Massy and Drueke 14 ).
Until now, only two longitudinal studies reported on the associations of these food groups with indices of renal function, and their findings are inconsistent. In the Northern Manhattan Study (NOMAS), a high consumption of vegetables was associated with decreased risk of incident low (<60 ml/min per 1·73 m2) eGFR( Reference Khatri, Moon and Scarmeas 15 ). The Framingham Heart Study (FHS), however, found no associations between consumption of whole grains, fruit and vegetables and microalbuminuria (moderate increase of albumin excretion in the urine, which is a predictor of poor renal outcomes), incident low eGFR or risk of rapid eGFR decline (loss of >3 ml/min per 1·73 m2/year)( Reference Foster, Hwang and Massaro 16 ). However, both study populations comprised relatively older men and women and mostly had a mildly impaired eGFR (<90 ml/min per 1·73 m2) at baseline. Furthermore, serum creatinine was available at only two time points 10 years apart, which did not allow for accurate assessment of annual rate of renal function decline.
In the present study, we therefore aim to investigate associations between consumption of whole grains, fruit and vegetables and decline of the eGFR, in a population-based cohort of adults, with 5-yearly repeated measurements of all variables, over 15 years of follow-up. We will also study associations between consumption of these food groups and ACR. Furthermore, we will examine whether possible associations are mediated through increased fibre, Mg, antioxidant and/or B vitamins intake.
Methods
Study setting
The Doetinchem Cohort Study is a Dutch prospective population-based study on factors affecting the health and well-being of Dutch adults. The first examination round (1987–1991; R1) was carried out among 12 405 men and women aged 20–59 years from the town of Doetinchem. Because of the extension of the study protocol, with similar budget, not all 12 405 participants could be re-invited. Instead, of those, a random sample of 7768 was re-invited to be examined in 1993–1997 (R2, n 6113), 1998–2002 (R3, n 4916), 2003–2007 (R4, n 4520) and 2008–2012 (R5, n 4017). The study was approved by an ethical review board, and informed consent was received from all participants. Further details of the study design have been described elsewhere( Reference Verschuren, Blokstra and Picavet 17 ).
Study population
For the analysis with changes in eGFR as the outcome, we included those who responded to R2 in 1993–1997 (n 6113), because data on diet and eGFR were not available before 1993. For the analysis with ACR as the outcome, we included those who responded to R4 in 2003–2007 (n 4520), and who had ACR measured in R5 in 2008–2011, giving a total of 1929 participants. ACR data were not available before 2008 and after 2012. Pregnant women were censored at the round in which they reported to be pregnant. Furthermore, for both analyses we excluded participants as indicated in Fig. 1.
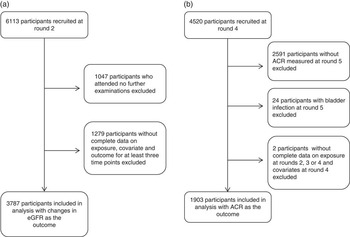
Fig. 1 Flow diagram of (a) analysis of consumption of whole grains, fruit and vegetables and changes in estimated glomerular filtration rate (eGFR), and (b) analysis of consumption of whole grains, fruit and vegetables and albumin:creatinine ratio (ACR).
Dietary assessment
Diet was assessed at R2–R4, using a self-administered semi-quantitative validated FFQ, which was developed for the European Prospective Investigation into Cancer and Nutrition study. Participants reported their usual frequency of consumption of 178 food and beverage items over the past 12 months, partially supported by coloured photographs. Consumption of food and beverage items (in g/d) and nutrient intakes were calculated using an extended version of the Dutch Food Composition database of 1996( 18 ). Total vegetable consumption included intake of chicory, endive, lettuce, spinach, cucumbers, butter beans, bell peppers, tomatoes, carrots, red beets, cabbages, mushrooms, green beans, spring beans, onions, garlic, stalk vegetables, sprouts and green peas. We did not consider potatoes as vegetables, as their nutritional value differs significantly from that of vegetables. Consumption of fruit comprised intake of applesauce, apples, pears, bananas, cherries, citrus fruits, grapes, kiwis, melons, peaches and strawberries. Fruit and vegetable juices were not included as they differ from their source of origin in terms of added sugar and food matrix( Reference Cooper, Forouhi and Ye 19 ).Unfortunately, our FFQ could not distinguish 100 % fruit and vegetable juices from other juices. Whole grains were defined as wholemeal bread, rye bread and unrefined grains (e.g. brown rice)( Reference Tabak, Smit and Heederik 20 ).
The Spearman correlation coefficients for reproducibility after 12 months were 0·76 in men and 0·65 in women for vegetable intake, 0·61 in men and 0·77 in women for fruit intake and 0·86 in men and 0·85 in women for bread intake (as a proxy for whole grains)( Reference Ocke, Bueno-de-Mesquita and Goddijn 21 ). Furthermore, the validity was tested against twelve repeated 24-h recalls. Pearson’s correlation coefficients were 0·31 in men and 0·38 in women for vegetables, 0·68 in men and 0·56 in women for fruit and 0·76 in men and 0·78 in women for bread. Furthermore, the tracking coefficients covering a 15-year period were found to be moderate for whole grains (0·47), fruit (0·61) and vegetable (0·51) consumption (all P<0·001)( Reference Twisk 22 ).
Assessment of renal function
In all rounds, trained staff collected 30-ml non-fasting plasma blood samples. Cystatin C was measured by particle-enhanced turbidimetric immunoassay using reagents from Gentian (Gentian), with intra-assay and interassay CV of <4·1 and 3·3 %, respectively. Serum creatinine was measured by dry chemistry (Eastman Kodak), with intra-assay and interassay CV of 0·9 and 2·9 %, respectively. All available samples for each participant from successive rounds were measured in a single run in 2012, which optimally reduced the interassay variation( Reference Vart, Bakker and Schottker 23 ). We estimated GFR using the Chronic Kidney Disease-Epidemiology (CKD-EPI) creatinine–cystatin C equation (2012), as both serum creatinine and cystatin C more accurately estimated renal function compared with models that included creatinine and cystatin C alone( Reference Inker, Schmid and Tighiouart 24 ). Annual decline of eGFR was calculated by subtracting eGFR between successive examinations and dividing by five, as each round was approximately 5 years apart. Urinary albumin and creatinine were assessed from spot urine samples obtained at R5. Albumin was measured by nephelometry, with intra-assay and interassay CV of 2·2 and 2·6 %, respectively (Dade Behring Diagnostic). Urinary creatinine was assessed by Kodak Ektachem dry chemistry (Eastman Kodak). Intra-assay and interassay CV were 0·9 and 2·9 %, respectively. ACR was determined from urinary albumin and creatinine and expressed as mg/g.
Covariates
Data on socio-demographic, lifestyle, medical history of chronic diseases and medication use were collected at each round. Education was assessed as the highest level attained over follow-up and classified into low (intermediate secondary education or less), intermediate (intermediate vocational or higher secondary education) or higher (higher vocational education or university) education. Smoking status was classified as never smoker, ex-smoker or current smoker, and alcohol consumption as non-drinker, light drinker (0–4·9 g/d for both women and men), moderate drinker (5·0–14·9 g/d for women; 5·0–29·9 g/d for men) or heavy drinker (≥15·0 g/d for women; ≥30·0 g/d for men)( 25 ). Physical activity was assessed by the Cambridge Physical Activity Index score, on the basis of the frequency and total duration of activity during leisure time and work, and classified as inactive, moderately inactive, moderately active or active( Reference Wareham, Jakes and Rennie 26 ). BMI was calculated as the ratio of measured weight to height squared (kg/m2). Diabetes was defined as self-reported diabetes or a random glucose level ≥11·1 mmol. Hypercholesterolaemia was defined as non-fasting total cholesterol ≥6·5 mmol/l and/or the use of cholesterol-lowering medication. Hypertension was defined as systolic blood pressure ≥140 mmHg, and/or diastolic blood pressure ≥90 mmHg, and/or the use of antihypertensive medication. Low-fat dairy products were defined as milk and milk products with a fat concentration <2 g/100 g. Coffee intake was measured in cups per day and intake of nuts was measured in g/d. Intake of antioxidants comprised vitamin C, vitamin E, β-carotene, lutein, flavonoids and lignans, and was computed as described previously( Reference Nooyens, Milder and van Gelder 27 ). A standardised z score for all antioxidants was constructed at each round, on the basis of the means and standard deviations of intakes at baseline. Standardised z scores were then summed to calculate daily total intake of antioxidants. The B vitamins included B1, B2, B3 and B6, and a total vitamin B composite variable was constructed for each round (mg/d). Supplemental intakes of vitamin C, vitamin E, B complex and multi-vitamins were assessed based on questionnaire data (self-report).
Statistical analyses
Participants were categorised into tertiles (for analysis of ACR) and quartiles (for analysis of changes in eGFR) for each of the assessed foods. We used the residual method to adjust intakes of whole grains, fruit and vegetables and nutrients for total energy intake( Reference Willett, Howe and Kushi 28 ). Baseline characteristics are presented according to quartiles of baseline consumption of whole grains.
To examine the prospective associations between consumption of food groups (at R2–R4) and subsequent annual changes in eGFR (between R2 and R5), the technique of generalised estimating equations (using an exchangeable correlation structure) was adopted because this method accounts for multiple observations for each participant. For these analyses, consumption of energy-adjusted food groups in R2, R3 and R4 was included as time-varying covariates (Fig. 2(a)). Linear regression coefficients and their 95 % CI of changes in eGFR were calculated for continuous data (per 50 g increase) and quartiles of whole grains, fruit and vegetables, using the first quartile as the reference category.

Fig. 2 Visualising the generalised estimating equation regression and linear regression models to study the associations between (a) consumption of whole grains (WG), fruit (F) and vegetables (VEG) (at R2–R4) and subsequent annual changes in estimated glomerular filtration rate (eGFR) (between R2 and R5), and (b) average consumption of whole grains, fruit and vegetables (at R2, R3 and R4) and albumin:creatinine ratio (ACR) (at R5).
For analysis of ACR, we calculated the average consumption for each food group using 5-yearly updated information for each participant from the repeated FFQ collected at R2, R3 and R4. To correct for skewness, ACR at R5 was transformed to the natural log scale. We used linear regression analysis to assess associations between tertiles of the average energy-adjusted consumption of whole grains, fruit and vegetables at R2, R3 and R4 and the natural logarithm of ACR at R5 (Fig. 2(b)). As our outcome was log-transformed, we exponentiated (back-transformed) the β-coefficients to obtain ratios of geometric means of ACR for each exposure tertile in relation to the reference category that has the null value of 1.
For both analyses, tests for trends across tertiles or quartiles were conducted by modelling the median value for each category as a continuous variable. Furthermore, we first adjusted for only age and sex (model 1). In model 2, additional adjustments were made for attained level of education and physical activity, BMI, smoking, alcohol consumption, daily energy intake, energy-adjusted intake of total protein, low-fat dairy products, coffee and nuts, supplement use and presence of diabetes, hypertension and hypercholesterolaemia. We also fitted model 3 with additional adjustment for energy-adjusted intake of Mg, fibre, vitamin B and antioxidants to investigate the possible mediating roles of these nutrients. Once participants were classified as having diabetes, hypertension or hypercholesterolaemia, they were considered to have that condition at all subsequent rounds. For analysis of changes in eGFR, all covariate variables were included as time-varying covariates. For analysis of ACR, data on covariates (other than intakes of whole grains, fruit and vegetables) collected closest to the round when ACR was measured (R4) were used. We also formally tested effect modification by adding interaction terms between the exposures and age and sex. Differences with P<0·05 were considered to be statistically significant. Analyses were performed using SAS 9.4.
Results
Participant characteristics
Of 6113 participants who responded to R2, data from 3787 (62 %) were included in the analyses on changes in eGFR. There were some baseline differences between included and excluded participants, with the latter being older, less well educated and generally less healthy (online Supplementary Appendix S1). There was no difference between included and excluded participants in terms of vegetable consumption at baseline, but the consumption of total fruit and whole grains was lower among those who were excluded.
At baseline (R2), 52 % of our study population comprised women with a mean age of 45 years and an average eGFR of 104·6 ml/min per 1·73 m2. Mean annual decline over 15 years of follow-up was 0·95 (sd 0·67) ml/min per 1·73 m2. Furthermore, mean BMI was 25·3 kg/m2, participants were physically active on average (52 %) and had a low education level (42 %). Furthermore, 27 % were current smokers and 41 % were moderate consumers of alcohol (Table 1). Compared with participants in the lowest quartile of whole-grain intake, those in the upper two quartiles were more educated, more likely to be female and had higher intakes of fruit and vegetables, low-fat dairy products, fibre, Mg, antioxidants and B vitamins; in addition, they were less likely to be current smokers and non-drinkers and more physically active.
Table 1 Baseline characteristics of 3787 men and women according to quartiles of whole-grain intake (Mean values and standard deviations: continuous values; percentages and numbers (categorical values); medians and interquartile ranges (IQR))

eGFR, estimated glomerular filtration rate.
Whole grains, fruit and vegetables and annual changes in estimated glomerular filtration rate
After adjusting for age and sex, we observed that a higher intake of whole grains was associated with a slightly less decline in eGFR per year (Table 2). Compared with the lowest quartile, decline in eGFR, respectively, 0·10 ml/min per 1·73 m2 (95 % CI 0·02, 0·17) and 0·09 ml/min per 1·73 m2 (95 % CI 0·02, 0·16), per year was less in the third and fourth quartiles of whole grains, with a borderline significant trend across quartiles (P=0·06). However, in the model adjusted for education, dietary and lifestyle variables, only the second and third quartiles of whole grains remained significantly associated with less decline in eGFR (β 0·09; 95 % CI 0·01, 0·16 and 0·07; 95 % CI 0·002, 0·15 ml/min per 1·73 m2, respectively; P trend=0·25). Further adjustment for intake of Mg, fibre, B vitamins and antioxidants only slightly decreased this estimate, but the CI became wider and this association was further attenuated to null (P trend=0·94).
Table 2 Associations between intake of whole grains, fruit and vegetables at rounds 2–4 and subsequent yearly changes in estimated glomerular filtration rate between rounds 2 and 5 among 3787 participants of the Doetinchem Study (Linear regression coefficients (β) (ml/min per 1·73 m2) and 95 % confidence intervals)

Ref., referent values.
* Model 1: adjusted for age at baseline and sex.
† Model 2: model 1 and highest attained level of education and time-dependent physical activity, BMI, smoking, alcohol consumption, daily energy intake (kJ (kcal)), energy-adjusted intake of total protein, low-fat dairy products, coffee and nuts, supplement use, presence of diabetes, hypertension and hypercholesterolaemia.
‡ Model 3: model 2 and energy-adjusted intake of Mg, fibre, vitamin B and antioxidants.
Neither intake of fruit nor intake of vegetables (both as continuous and categorical variables) were statistically significantly associated with changes in eGFR, a pattern that did not change after adjustment for potential confounders and intermediates (Table 2).
Whole grains, fruit and vegetables and the urinary albumin:creatinine ratio
The median ACR at R5 was 9·44 mg/g (interquartile range 6·05, 16·89). There was no evidence of an association of average intakes of whole grains, fruit and vegetables at R2–R4 with ACR at R5 in any of the models (Table 3). After adjustment for all covariates in model 2, the ratio of geometric mean was 1·07 (95 % CI 0·97, 1·19), 1·05 (95 % CI 0·95, 1·16) and 1·01 (95 % CI 0·91, 1·12) in the third tertiles of, respectively, whole grains, fruit and vegetables. Adjustment for intake of Mg, fibre, B vitamins and antioxidants had little effect on these estimates.
Table 3 Associations between average intake of whole grains, fruit and vegetables at rounds 2–4 and albumin:creatinine ratio (ACR) at round 5 among 1903 participants of the Doetinchem StudyFootnote * (Geometric means (exponentiated linear regression coefficients) and 95 % confidence intervals)
Ref., referent values.
* Rows include ratios of geometric means of ACR at R5 obtained by back-transforming coefficients as the outcome was log-transformed in analyses. These are interpreted as percentage (relative) differences; for example, the results from model 3 for whole grains show a non-significant 7 % increase in those with the highest tertile of intake compared with those in the lowest tertile.
† Model 1: adjusted for age at baseline and sex.
‡ Model 2: model 1 and highest attained level of education and time-dependent physical activity, BMI, smoking, alcohol consumption, daily energy intake (kJ (kcal)), energy-adjusted intake of total protein, low-fat dairy products, coffee and nuts, supplement use, presence of diabetes, hypertension and hypercholesterolaemia.
§ Model 3: model 2 and energy-adjusted intake of Mg, fibre, vitamin B and antioxidants.
Finally, in both analyses, there were no statistical significant interactions between age or sex and studied food groups.
Discussion
In this analysis in a large cohort of generally healthy men and women, we found a trend towards slightly less decline in renal function among those with higher intakes of whole grains. This trend, however, was attenuated and no longer significant in multivariate models. Intakes of fruit and vegetables were both not associated with changes in renal function. Furthermore, no associations were observed with continuous urinary ACR.
Earlier findings from the prospective FHS, NOMAS and the Nurses’ Health Study that showed that higher diet quality( Reference Foster, Hwang and Massaro 16 , Reference Ma, Jacques and Hwang 29 ), better adherence to a Mediterranean Diet( Reference Khatri, Moon and Scarmeas 15 )or a DASH-style diet, but not prudent diet( Reference Lin, Fung and Hu 30 ), was associated with reduced incidence of low eGFR or risk of rapid decline. As whole grains, fruit and vegetables are highly presented in these dietary patterns, it is expected that these individual foods are associated with renal function too. In our study, this was not the case. Until now, few studies have examined the effects of consumption of whole grains, fruit and vegetables on renal function. Similar to our findings, the FHS did not find associations of consumption of whole grains, fruit and vegetables with odds of microalbuminuria, incident low eGFR or rapid eGFR decline( Reference Ma, Jacques and Hwang 29 ). However, a high vegetable intake was found to be associated with a significantly lower risk of incident eGFR<60 ml/min per 1·73 m2 among participants of the NOMAS study( Reference Khatri, Moon and Scarmeas 15 ). In addition, cross-sectional findings from the MESA study showed that higher intakes of whole grains and fruit, but not vegetables, were associated with lower ACR( Reference Nettleton, Steffen and Palmas 10 ). Differences in findings may be because of differences in cohort composition and study design. For example, participants of the NOMAS and MESA study included elderly people of mixed origin with relatively low eGFR at baseline, whereas participants of the Doetinchem Study were relatively young, white people with well-preserved renal function. Furthermore, creatinine-based eGFR was used in the NOMAS study, which is known to be less accurate in comparison with creatinine- and cystatin C-based estimates of GFR( Reference Inker, Schmid and Tighiouart 24 ). In addition, FFQ used and categorisation of food groups in NOMAS and MESA differed from ours, and both studies lacked repeated dietary assessments over time. Relative validity of FFQ to estimate intakes of food groups in NOMAS and MESA, however, may be higher than in our study population, but this information is not provided in their reports, making it difficult to examine this potential difference. Furthermore, only the MESA study reported the average intakes of food groups. Although it is difficult to make direct comparisons of dietary intake between countries, intakes in our cohort seemed to be similar (fruit) or slightly higher (vegetables and whole grains). Still, it may not have been high enough to detect an impact on eGFR changes and ACR in a relatively healthy cohort. On the other hand, results from our group have shown that higher intakes of whole grains, fruit and vegetables are associated with decreased risk of chronic obstructive pulmonary disease and CHD in the Doetinchem Study( Reference Tabak, Smit and Heederik 20 , Reference Oude Griep, Geleijnse and Kromhout 31 ). These findings indicate that, although self-reported, the selected food groups do relate to other outcomes in previous studies. Nevertheless, additional large prospective population-based studies, with objective measurement of individual foods and food groups in addition to accurate estimates of renal function, are needed to investigate whether our findings can be confirmed.
The relatively narrow CI in our study suggest that we had sufficient power to assess the association between diet and renal outcomes. Furthermore, compared with the previous investigations, our observational study has the advantage of 15 years of follow-up and inclusion of over 3500 men and women of the general population. Of the studies on eGFR changes, ours is the largest to date to examine the association between consumption of whole grains, fruit and vegetables and renal function outcomes. Repeated measurements of exposures and outcomes enabled us to take into account changes over time. In addition, the use of both creatinine and cystatin C in estimating the GFR currently provides the most precise and accurate estimate of kidney function( Reference Inker, Schmid and Tighiouart 24 ). Because all available samples for each participant were measured in one assay run, we optimally reduced the chances of interassay variation( Reference Vart, Bakker and Schottker 23 ).
There are a few limitations. First, the participants not included in our analyses were generally less healthy than included participants, which means we cannot exclude some selection bias. Second, intakes of exposures were based on self-report, which may have introduced some errors. However, the FFQ was previously validated and was found to be useful for the assessment of usual intake( Reference Ocke, Bueno-de-Mesquita and Goddijn 21 ). Energy-adjusted correlation coefficients for fruit and bread were reasonable to good, with correlation coefficients >0·56. For vegetable intake, the relative validity was lower, suggesting that these particular findings should be interpreted with caution. Third, although exposure data were measured before ACR measurements were taken, ACR was measured only once in R5 in 2008–2011. We therefore do not know whether participants had an altered ACR before 2008 and whether they changed their diet because of it. Fourth, the number of participants with unstable intakes of whole grains, fruit and vegetables was too low to perform stratified analysis of stable v. unstable intakes. Fifth, there may be some residual confounding because we did not collect information on salt intake and drug subclasses. Finally, the low risk of renal dysfunction in our study population meant that the number of persons with microalbuminuria was too low for a meaningful analysis; instead, we modelled urinary ACR continuously.
In conclusion, consumption of whole grains, fruit and vegetables is not associated with changes in eGFR and mean ACR in young to middle-aged adults from a population-based cohort. This is contrary to expectations, given that previous studies have shown associations between a higher diet quality or better adherence to a Mediterranean diet and reduced incidence of low eGFR or risk of rapid decline. Further research is needed to replicate our findings in other large prospective population-based studies and to determine which specific food groups are responsible for the associations found with the Mediterranean diet.
Acknowledgements
This work was supported by a grant from the Dutch Kidney Foundation (PV42). The supporting agency had no role in the design or conduct of the study; collection, analysis or interpretation of the data; or the preparation and approval of the manuscript.
G.-C. M. H.-G. and A. M. W. S. designed the study. M. V. was in charge of data collection and design of the cohort. G.-C. M. H.-G. and M. B. analysed the data and wrote the paper. All authors were involved in the interpretation of the data, critically reviewed the manuscript and approved the final version. G.-C. M. H.-G. and A. M. W. S. were responsible for the manuscript’s contents.
None of the authors declared a conflict of interest.
Supplementary material
For supplementary material/s referred to in this article, please visit https://doi.org/10.1017/S0007114517001726


 Open access