


The current WHO guidelines strongly recommend a reduction in Na intake to < 2 g/d (i.e. < 5 g salt/d)( 1 ). There is conclusive evidence that reduction in Na intake reduces blood pressure( Reference Graudal, Hubeck-Graudal and Jurgens 2 – Reference He and MacGregor 5 ). The relationship between Na consumption and the risk of CVD and stroke is less clear than that of hypertension. For example, a systematic review of randomised controlled trials has found no relationship between Na intake and CVD risk( Reference Taylor, Ashton and Moxham 6 ); however, a meta-analysis of thirteen cohort studies has concluded that there is a direct relationship between increased Na consumption and the subsequent risk of CVD and stroke( Reference Strazzullo, D'Elia and Kandala 7 ).
Data from an international epidemiological study on dietary factors in the aetiology of unfavourable blood pressure (the INTERMAP study) showed that sources of dietary Na can vary considerably. For instance, processed foods contribute heavily to Na intake in the USA and the UK (70–95 %), whereas in China, most dietary Na intake (76 %) is from salt added during home cooking( Reference Anderson, Appel and Okuda 8 ). Another study, in which Li was used as a marker to assess the intake of household salt, has shown that the median contribution of household salt was 8–10 % of the total salt intake in a Danish population( Reference Andersen, Rasmussen and Larsen 9 ).
In general, 24 h urine collection is considered to be the most reliable method to evaluate salt intake( Reference Brown, Tzoulaki and Candeias 10 , Reference Ribic, Zakotnik and Vertnik 11 ). However, the 24 h urinary excretion method does not account for Na loss other than via the kidneys and will, therefore, tend to slightly underestimate true Na intake depending on the amounts excreted via sweat( Reference Holbrook, Patterson and Bodner 12 ). Although the 24 h urine collection method is not prone to reporting biases, participant burden is high and collections must be complete to ensure that excretion estimates are not biased( Reference Brown, Tzoulaki and Candeias 10 ). Available methods to verify completeness of urine collections include (1) the use of a diary for participants to report any urine voiding not collected; (2) recovery of para-aminobenzoic acid (PABA)( Reference Bingham and Cummings 13 ); (3) a creatinine index of observed-to-expected urinary creatinine excretion( Reference Joossens, Geboers, De Backer, Pedoe and Ducimetiere 14 ). Although the creatinine-based identification method of incomplete urine collections is frequently used, previous findings have shown that the creatinine index is an unreliable marker for detecting incomplete urine collections when compared with an internal standard such as PABA( Reference De Keyzer, Huybrechts and Dekkers 15 ).
Given the important health-associated risks of high Na intakes, monitoring of Na consumption is essential and should be integrated in national surveillance programmes. There is a European consensus that two non-consecutive 24 h dietary recalls (24-HDR) using EPIC-Soft are the preferred method for estimations of Na intake at the population or group level( Reference Brussaard, Lowik and Steingrimsdottir 16 ). Although the methods for collecting food consumption data have been improved over time, validation studies have shown that there is underestimation of protein (2–13 %) and K (4–17 %) intakes( Reference Huybrechts, Geelen and de Vries 17 ); however, the bias is comparable across European countries( Reference Crispim, Geelen and de Vries 18 ). To date, the reporting accuracy of dietary Na intake has not been assessed using the EPIC-Soft 24-HDR. Therefore, the objective of the present study was to assess the estimated dietary Na intake from self-reported dietary recalls using EPIC-Soft with 24 h urinary Na excretion. In addition, a salt adjustment procedure, using data from a questionnaire on the discretionary use of salt during food preparation or at the table, was evaluated to assess reporting accuracy.
Materials and methods
Design
The present study was performed as part of the European Food Consumption Validation (EFCOVAL) study that was completed in five European countries. The EFCOVAL study aimed at further developing and validating the use of repeated 24-HDR using the EPIC-Soft to assess the intake of foods, nutrients and potentially hazardous chemicals for surveillance purposes relevant to health and safety policies in Europe( Reference de Boer, Slimani and van 't Veer 19 ). The fieldwork was performed from October 2007 to April 2008.
At the beginning of the study, subjects had their body weight (kg) and height (cm) measured at the study centres before the first urine collection. Then, a 24-HDR and a 24 h urine collection were obtained, covering the same reference day. Subjects were aware of the days of data collection but not aware of the purpose of the interviews. The second recall and urine collection were obtained at least 1 month after the first one.
The present study was conducted according to the guidelines laid down in the Declaration of Helsinki, and all procedures involving human subjects were approved by the Ethical committees of each participating country involved in the data collection. Written informed consent was obtained from all the subjects.
Subjects
The study group comprised a subsample of healthy European adults aged 45–65 years who participated in the EFCOVAL study. Data for reporting accuracy of population dietary Na intake were collected in three European countries: Belgium, Czech Republic and Norway. Taking into account an anticipated dropout of 20 % and aiming at a net sample of fifty per stratum, a minimum of sixty men and sixty women were recruited per country (n 360). Subjects were recruited by convenience sampling through advertisements (newspapers and websites) and mailing lists, among others, and we aimed to include at least ten men and ten women in each of the three predetermined categories of education level (low, intermediate and high) per country. Exclusion criteria included the following: use of diuretics; simultaneous participation in another study; pregnancy or lactation; having diabetes mellitus or a kidney disease. In addition, because of PABA administration during urine collections, use of sulphonamide-based antibiotics or acetaminophen painkillers (e.g. paracetamol) was not allowed, and subjects who were hypersensitive to sulphonamides or PABA were also excluded.
Dietary sodium
The two 24-HDR were assessed using the EPIC-Soft software (version 9.16; International Agency for Research on Cancer). The structure and standardisation procedure of EPIC-Soft have been described elsewhere( Reference Slimani, Deharveng and Charrondiere 20 , Reference Slimani, Ferrari and Ocke 21 ). Briefly, EPIC-Soft is a computer-assisted dietary intake assessment tool that follows standardised steps when describing, quantifying, probing and calculating food intakes across countries( Reference Slimani, Deharveng and Charrondiere 20 ). A concept of facets (questions: e.g. source) and descriptors (answer options: e.g. cow, goat, sheep and pork) is used to describe the foods and recipes recalled during the 24 h recall interview. The following two modes of administration were used: one by phone and one face-to-face at the centre. The order of the administration mode and the day of the week were randomly allocated among the subjects. Interviewers in each centre were nutritionists or dietitians who were trained in interviewing skills and working with EPIC-Soft in the context of a validation study. It is noteworthy that the EPIC-Soft versions used in the EFCOVAL study did not include any particular questions regarding Na content/intake (no facet was dedicated to salt content of specific foods/recipes).
The methods of the estimation of portion size included household measures, weight/volume, standard units and portions, drawings of bread shapes and photographs. Given the absence of harmonised recent food composition tables (FCT) for all the three countries under study, Na contents in foods were calculated using country-specific FCT( 22 – 24 ). For the Czech Republic, a FCT was compiled for EFCOVAL purposes by using the composition of most foods based on the Slovakian tables because national data were lacking( 25 ).
To calculate dietary Na intake, two different scenarios were used. First, Na was calculated using Na concentrations reported in country-specific FCT( 22 , 24 , 25 ), i.e. only Na naturally present in foods or Na added during food processing reported as such in the FCT was counted (SODIUM scenario). Second, for prepared food items (e.g. meat, fish, potatoes and cooked vegetables), Na contents were increased to reflect Na levels of foods prepared using salt (SODIUMSALT scenario). For Belgium, the amounts of salt used for adding were extracted from the US Department of Agriculture National Nutrient Database for Standard Reference( 26 ), and for the Czech Republic, local salt addition factors were available and used in the present analysis. For Norway, salt addition factors were not available and, therefore, not used in the present analysis.
Questionnaire on salt use
After the collection of the two 24-HDR, participants were mailed and requested to complete a short questionnaire on salt use that asked whether they usually use salt ((a) No, salt is not used, neither during preparation of meals nor by adding salt during consumption; (b) Yes, salt is added to meals during consumption, not during preparation of meals; (c) Yes, salt is used during preparation of meals, no salt is added to meals during consumption; (d) Yes, salt is used during preparation of meals and added to meals during consumption). In addition, respondents were asked about the frequency of salt addition to their meals during consumption ((w) never; (x) occasionally; (y) often; (z) always).
Urinary sodium
All subjects were carefully instructed to keep two 24 h urine collections according to a standardised protocol. Subjects were asked to urinate upon rising in the morning; this micturition was completely discarded. Subsequently, all urine produced during the next 24 h was collected up to, and including, the first voiding of the following day. Subjects were provided a diary to record the time of rising, medication use and possible deviations (e.g. missing urine) from the urine collection protocol. To verify the completeness of urine collections, an 80 mg PABA tablet (PABAcheck; Laboratories for Applied Biology) was taken three times during the day. After approximately 1 month, the same procedure was repeated, so every subject yielded two 24 h urine collections. At the study centre, urine samples were weighed and well mixed by study site staff before aliquoting into 10 ml cryostorage tubes. Aliquots of the 24 h urine samples were frozen at − 20°C until shipment on dry ice to the central laboratory at the Division of Human Nutrition of Wageningen University. PABA was measured using the colorimetric diazocoupling method described by Bingham & Cummings( Reference Bingham and Cummings 13 ). The recoveries of PABA below 50 % were treated as incomplete collections and those between 50 and 85 % were proportionally adjusted to 93 % of PABA recovery( Reference Johansson, Bingham and Vahter 27 ). Na concentrations were determined by indirect potentiometry on a Synchron LX20 (Beckman Coulter). Excretion values of Na were calculated by multiplying with the factor 100/90, because on average 90 % of Na consumed is excreted via the urine( Reference Holbrook, Patterson and Bodner 12 ). The EFCOVAL protocol for specimen collection, storage and transport was used by all the study centres.
Statistical analyses
Statistical analyses were performed using IBM SPSS Statistics for Windows (IBM Corporation Released 2011, version 20.0; IBM Corporation). Because of methodological differences between the countries in calculating dietary Na intake, country-specific data are presented here.
The reporting accuracy of dietary Na intake was assessed using two scenarios. In the first scenario, no data processing step was applied with respect to salt addition. Therefore, Na values were aggregated to calculate total Na intake. The second scenario presented Na intake after salt adjustment based on the respondent's answer to a question about the use of salt during food preparation or at the table. For respondents who did not add salt to their food (answer option (a)), salt adjustment was not performed and total Na values equalled those from the first scenario. Respondents who indicated that usually salt is used during cooking (answer options (c) and (d)), total Na intake was calculated by summing up the Na levels of foods prepared using salt (SODIUMSALT scenario). Finally, for respondents who indicated that, in general, salt is added to their meal during consumption using a salt shaker (answer options (b) and (d)), a standard amount of Na was added to reflect salt addition. The amounts of Na added were based on the respondent's answer to the question on the frequency of salt added to meals ((w) 0 mg; (x) 25 mg; (y) 50 mg; (z) 100 mg).
Dietary Na intake (DRNA) and urinary Na excretion (URNA) were log-transformed to improve the distribution towards normality. To account for serial correlations between individual subject dietary recalls and between individual urinary excretions, sample within-subject variances and standard deviations were estimated from a linear mixed model of dietary Na intake and urinary Na excretion with random intercepts and all fixed effects for up to two dietary recalls and urinary excretions. Within sex and country, means and 95% CI for 24 h Na intakes were estimated using the estimated marginal means subcommand. Logarithmic means were back-transformed to geometric means on the original scale. Reporting accuracy was calculated from subgroup geometric means as a ratio of dietary Na:excreted urinary Na (DRNA:URNA).
The 95 % confidence limits of the log ratio were calculated by adding
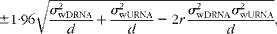 $$\begin{eqnarray} \pm 1\cdot 96\sqrt {\frac { \sigma _{wDRNA}^{2}}{ d } + \frac { \sigma _{wURNA}^{2}}{ d } - 2 r \frac { \sigma _{wDRNA}^{2} \sigma _{wURNA}^{2}}{ d }}, \end{eqnarray}$$
where σwDRNA is the within-subject standard deviation for the log of 24 h dietary Na intake; d is the number of days of dietary Na intake; σwURNA is the within-subject standard deviation for the log of urinary Na excretion; and r is the correlation between the log of dietary and urinary Na( Reference Rhodes, Murayi and Clemens 28 ). On the original scale, the 95 % confidence limits are given by the exponential of the limits on the log scale.
Assuming independence for the two 24-HDR and the two urinary Na excretion measurements, σwDRNA and σwURNA can be estimated as one-half of the dietary Na intake sample variance of (logDRNA1− logDRNA2) and one-half of the urinary Na excretion sample variance of (logURNA1− logURNA2), respectively, in a design with two dietary Na intakes (d= 2) and two urinary Na excretion measurements per subject( Reference Julious 29 ).
Results
The net study sample comprised fifty-eight to sixty-three subjects for each sex and country stratum, resulting in a total of 183 males and 182 females. Demographic characteristics of the study sample are presented in Table 1. Of these subjects, 57 % were highly educated. There was a significant difference in education level across the countries for women (χ2= 13·204, df = 4; P =0·01). More women (58 %) than men (29 %) were considered normal weight (BMI 18·5–24·9 kg/m2).
Table 1 Demographic characteristics of the study sample (n 365)* (Mean values and standard deviations or percentages)

* Some percentages do not total 100 because of rounding.
All participants (n 365) collected their urine the first time, but two participants failed to perform the second collection, resulting in a total of 728 urine samples. Samples with PABA recoveries < 50 % were treated as incomplete and excluded from the data analysis (n 9). Specimens with PABA recovery between 50 and 85 % (n 57) had their urinary concentrations proportionally adjusted to 93 % of PABA recovery. Recoveries >85 % were included in the data analyses without adjustments (n 662).
Geometric means for Na measured by the urinary biomarker and calculated based on self-reports from the EPIC-Soft 24-HDR are presented in Table 2. The mean dietary Na, calculated by using individual subject means for the two recalls from Belgium, represented 61 and 59 % of the mean Na biomarker for men and women, respectively. The mean dietary Na was 75 and 70 % for Norway and 67 and 66 % for the Czech Republic, for men and women, respectively. Reporting accuracy was higher after the data were adjusted for salt intake during preparation and consumption of foods. Reporting accuracy increased by 7 % for Belgium, 1 % for Norway and 13 % for the Czech Republic.
Table 2 Daily dietary sodium intake and urinary excretion measured in male and female subjects according to country (Geometric means* and 95 % confidence intervals)

DRNA, dietary Na intake; URNA, urinary Na excretion.
* Based on least-squares means and lower and upper limits of CI generated by a linear mixed model for repeated measures for sex- and country-specific 24 h dietary recall or urinary biomarker.
† Unadjusted Na values.
‡ Adjusted for salt use based on a salt questionnaire.
§ Calculated as 24 h urinary Na divided by 0·9, with the assumption that 90 % of Na consumed is excreted in the urine.
∥ Ratio of Na intake estimated from the dietary recall to that estimated from the urinary biomarker (DRNA:URNA).
Reporting accuracy was highest among normal-weight subjects, except for obese women from Belgium and Norway where reporting accuracy was highest among obese subjects (Table 3). Among the normal-weight subjects from Belgium and Norway, reporting accuracy was higher for men than for women (0·80 and 0·69; 0·86 and 0·73, respectively). For the Czech Republic, reporting accuracy was similar for both normal-weight men and women (0·84 and 0·87, respectively). No consistent differences were found between educational level and reporting accuracy by country and sex (data not shown).
Table 3 Daily dietary sodium intake and urinary excretion measured in male and female subjects by BMI and country (Geometric means* and 95 % confidence intervals)

DRNA, dietary Na intake; URNA, urinary Na excretion.
* Based on least-squares means and lower and upper limits of CI generated by a linear mixed model for repeated measures for sex-, country- and BMI-specific 24 h dietary recall or urinary biomarker.
† Adjusted for salt use based on a salt questionnaire.
‡ Calculated as 24 h urinary Na divided by 0·9, with the assumption that 90 % of Na consumed is excreted in the urine.
§ Ratio of Na intake estimated from the dietary recall to that estimated from the urinary biomarker (DRNA:URNA).
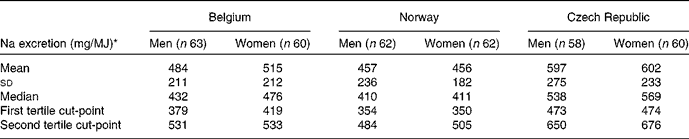
Male and female subjects were classified into tertiles of urinary Na excretion (mg/d) per MJ of dietary energy intake. Arithmetic means, standard deviations, medians and tertiles are presented in Table 4. The median energy-adjusted Na excretion is higher for women than for men from Belgium (476 and 432 mg/MJ) and the Czech Republic (569 and 538 mg/MJ), respectively.
Table 4 Energy-adjusted urinary sodium excretion of the subjects by sex and country (Mean values, standard deviations, median values and tertiles)
* Urinary Na excretion (mg/d) per MJ of dietary energy intake estimated from the EPIC-Soft 24 h dietary recall.
Na measurements and reporting accuracy for tertiles of energy-adjusted Na excretion are presented in Table 5. For the subjects among the lowest tertile of Na excretion per MJ, reporting accuracy was highest in all sex and countries. For subjects from the Czech Republic with low Na excretion per MJ, reporting accuracy of dietary Na intake was overestimated by 24–22 % for men and women, respectively.
Table 5 Daily dietary sodium intake and urinary excretion measured in male and female subjects by tertiles (T) of energy-adjusted sodium intake and country (Geometric means* and 95 % confidence intervals)

DRNA, dietary Na intake; URNA, urinary Na excretion.
* Based on least-squares means and lower and upper limits of CI generated by a linear mixed model for repeated measures for sex-, country- and tertile of energy-adjusted Na intake-specific 24 h dietary recall or urinary biomarker.
† Tertiles of urinary Na excretion (mg/d) per MJ of dietary energy intake.
‡ Adjusted for salt use based on a salt questionnaire.
§ Calculated as 24 h urinary Na divided by 0·9, with the assumption that 90 % of Na consumed is excreted in the urine.
∥ Ratio of Na intake estimated from the dietary recall to that estimated from the urinary biomarker (DRNA:URNA).
Discussion
The present study was the first to investigate the reporting accuracy of dietary Na intake estimated by the EPIC-Soft 24-HDR method, which did not specifically ask for salt contents or use. Since 24 h urine collections were provided during the EFCOVAL study, analysis of urinary Na excretion provided a unique opportunity to assess the reporting accuracy of dietary Na intake. It is worth mentioning that at the time the EFCOVAL study was performed, calculation of dietary Na intake was not a priority; hence, procedures to link Na to foods and recipes were different across the participating countries. Nevertheless, although it was not the intention to assess dietary Na intake a priori, the available data are scientifically very interesting to explore and to allow further optimisation of the dietary intake assessment methods under study.
The reporting accuracy of dietary Na intake without salt adjustment (SODIUM scenario) tended to be lowest for Belgium and highest for the Czech Republic. This is probably because in the Belgian version of EPIC-Soft, no salt is added to composite meals. Only in recipes of soups, the Na present in stock cubes is taken into account. All other recipes and composite meals are treated as if no salt is added. In contrast, the EPIC-Soft version of the Czech Republic had salt included in standard recipes; therefore, dietary Na intake estimations were higher and closer to urinary Na excretion, resulting in higher reporting accuracy. For Norway, salt was only added to some standard recipes such as bread, meat sauce and fish cakes.
The salt adjustment procedure used information from the salt questionnaire to take into account the discretionary use of cooking or table salt (SODIUMSALT scenario). The salt adjustment procedure improved reporting accuracy among the subjects from both Belgium and the Czech Republic, while only 1 % increase in reporting accuracy was found for Norway. This can be explained because for Norwegian data, no salt addition factors were available for culinary treated food items. Since 89 and 77 % of Norwegian men and women, respectively, reported to use salt during cooking, a considerable part of the Norwegian sample should have had their Na intake being increased during the salt adjustment procedure. From the Norwegian data, it can also be concluded that the correction of Na intake based on the question of table salt use only minimally improved the reporting accuracy by 1 %. Therefore, in future analysis, the effect of higher standard amounts of Na added to reflect the discretionary use of table salt should be investigated. Nevertheless, it is believed that, in general, the contribution of household salt to total salt intake is limited. In a Danish study using a Li marker technique, Andersen et al. ( Reference Andersen, Rasmussen and Larsen 9 ) found that the median contribution of household salt was 8–10 % of total salt intake.
Na intake was highly correlated with energy intake; however, because salt used during preparation of meals or consumption was not included in the EPIC-Soft 24-HDR and no salt facet was foreseen in the EFCOVAL versions of EPIC-Soft, a lower reporting accuracy for dietary Na intake might be expected. A previous study has indicated that extreme energy under-reporting is present in men and women (10 and 14 %, respectively)( Reference Ferrari, Slimani and Ciampi 30 ). On average, men and women under-reported protein intake from two 24 h dietary recalls by 8 %( Reference Crispim, Geelen and de Vries 18 ). When urinary Na excretion was adjusted for dietary energy intake, it was found that reporting accuracy was highest among the subjects from the lowest tertile, in all countries and both sexes. Therefore, it can be concluded that as Na density of a daily diet increases, the reporting accuracy of Na intake decreases. Na intake was overestimated by 24 and 22 % of Czech males and females among the lowest tertile of urinary Na per MJ of energy intake. When the SODIUM scenario was used, reporting accuracy was 1·10 and 0·98 for men and women, respectively (data not shown). Further analysis of salt addition factors for culinary treated foods revealed that these factors were considerably higher in the Czech Republic compared with those used in Belgium. It is assumed that these higher addition factors are responsible for the overestimation of Na intake among the subjects in the lowest tertile of urinary Na excretion per MJ of energy intake.
In a study of 465 American subjects aged 30–69 years, the overall reporting accuracy of dietary Na intake using the automated multiple-pass method compared with 24 h urinary excretion was 0·93 for men and 0·90 for women( Reference Rhodes, Murayi and Clemens 28 ). A larger underestimation of Na intake was found with increasing BMI category among men and women. In a study of 353 young, lean (mean BMI 21·1 kg/m2) female Japanese dietetic students, over-reporting of Na decreased with increasing BMI quintile category( Reference Murakami, Sasaki and Takahashi 31 ). The present study shows that for Belgian and Norwegian women, dietary Na intake was highest for obese subjects compared with normal-weight and overweight subjects; while in contrast to all the other obese subjects, their urinary Na excretion was lower than overweight subjects.
The participants of the present study were highly motivated; only two subjects failed to collect their second urine sample. PABA was used to verify the completeness of urine collections. Based on the recovery of PABA, only 1 % was treated as incomplete (PABA recovery below 50 %) and 8 % of collections were proportionally adjusted to 93 % of PABA recovery (50 % < PABA recovery < 85 %). When proportionally adjusted collections were excluded from the analysis, overall reporting accuracy did not differ from that reported.
The correction factor used for estimating Na intake from 24 h urine collections should be taken into account when interpreting the results of the present study. Since the fieldwork of the urine collections was performed during winter, a correction factor of 90 % was chosen. Holbrook et al. ( Reference Holbrook, Patterson and Bodner 12 ) showed that seasonal variation in urinary Na excretion is present, probably associated with sweating. In the study performed by Rhodes et al. ( Reference Rhodes, Murayi and Clemens 28 ), a correction factor of 86 % was used, while other studies used 95 %( Reference Vandevijvere, De Keyzer and Chapelle 32 ). The use of other correction factors or no correction factor would influence the magnitude of misreporting.
It is challenging to assess dietary Na intake in free-living individuals due to its high day-to-day variation, its diversity in sources (naturally present, added by the industry or discretionary use of salt at home) and changing salt concentrations of industrial foods over time. Indeed, Na reduction intervention plans have led to considerable commitment of the food industry to lower the Na content of processed foods. Consequently, the large diversity of foods available on the food market and the change in Na content due to the reformulation of foods require a continuous updating of food composition databases.
Conclusions
The present study shows considerable underestimation of dietary Na intake at both the population and subgroup levels when using the EPIC-Soft 24-HDR versions that do not include any specific questions regarding salt content/use. The salt adjustment procedure presented herein increased the reporting accuracy, but not to satisfying levels. Given that during the EPIC-Soft-guided 24-HDR, discretionary use of table or cooking salt was not assessed and no salt facet was foreseen, the low reporting accuracy observed is not surprising. Reporting accuracy tended to be highest in the Czech Republic with considerable overestimation of Na intake among the subjects with low urinary Na excretion per MJ of energy intake. Data from Belgium showed the lowest reporting accuracy. Therefore, inclusion of salt use in composite meals and recipes should be considered in future. Finally, to accurately estimate the population dietary Na intake, using the EPIC-Soft 24-HDR method, future development of facets and descriptors related to discretionary use of salt is necessary.
Acknowledgements
The authors thank the EFCOVAL partners for their useful advice and the respondents for their participation. The EFCOVAL partners are Ghent University (DPH), Belgium; Academy of Medical Sciences (AMZH), Croatia; National Institute of Public Health (NIPH), Czech Republic; National Food Institute, Technical University of Denmark (DTU), Denmark; French Food Safety Authority (AFSSA), France; National Institute for Agricultural Research (INRA), France; German Institute of Human Nutrition (DIfE), Germany; National Research Institute for Food and Nutrition (INRAN), Italy; Wageningen University (WU), The Netherlands; National Institute for Public Health and the Environment (RIVM), The Netherlands; University of Oslo, Norway; Basque Foundation for Health Innovation and Research (BIOEF), Spain; Prima Informatics Limited (Primainfo), UK; and International Agency for Research on Cancer (IARC, WHO). The present study reflects only the authors' views and the European Community is not liable for any use that may be made of the information contained therein. The authors thank Roos Colman for her advice regarding the statistical analysis. They also acknowledge Ziggy Buyle and Hannes Timmerman for their work regarding the Belgian salt addition factors.
The EFCOVAL Project was supported by the community funding under the Sixth Framework Program (FOOD-CT-2006-022895). The present study was supported by the research fund of University College Ghent (to W. D. K.). Both funders had no role in the design and analysis of the study or in the writing of this article.
The authors' contributions are as follows: W. D. K. carried out the data analyses and wrote the paper; E. d. B., P. v. V. and N. S. designed and coordinated the overall EFCOVAL Project; A. G., J. R., I. H., S. D. H. and L. F. A. were local coordinators; W. D. K., M. D., I. T. L. L., M. D. M., I. R. and S. P. C. were involved in the fieldwork. All authors contributed to the interpretation of the results, commented on the paper and approved the final version.
None of the authors has any conflict of interest to declare.


