


Introduction
A common design of a high-level radioactive waste (HLW) disposal system consists of the wastes encapsulated within metallic canisters emplaced in horizontal tunnels or vertical shafts, with the space between the canisters and the surrounding rock filled with a buffer, usually consisting of a bentonite-based material. In particular in the Swiss concept (NAGRA, 2019), the canisters rest on a lower bed made of highly compacted bentonite blocks and the rest of the gallery is filled by granular buffer material (GBM, i.e. pellets). In the early post-closure period the buffer is expected to experience the maximum temperature (~150°C) and be largely unsaturated (Johnson et al., Reference Johnson, Niemeyer, Klubertanz, Siegel and Gribi2002). With the aim of reproducing the conditions corresponding to the initial emplacement of wastes, i.e. high heat generation and low but increasing moisture in the buffer, a 1:2 scale in situ test was designed and constructed at the Mont Terri Underground Research Laboratory (URL) in Switzerland following the Swiss concept (Fig. 1, left), the HE-E (Heating Experiment) (Gaus et al., Reference Gaus, Wieczorek, Mayor, Trick, García-Siñeriz, Schuster, Garitte and Kuhlman2011, Reference Gaus, Garitte, Senger, Gens, Vasconcelos, García-Sineriz, Trick, Wieczorek, Czaikowski, Schuster, Mayor, Velasco, Kuhlmann and Villar2014).
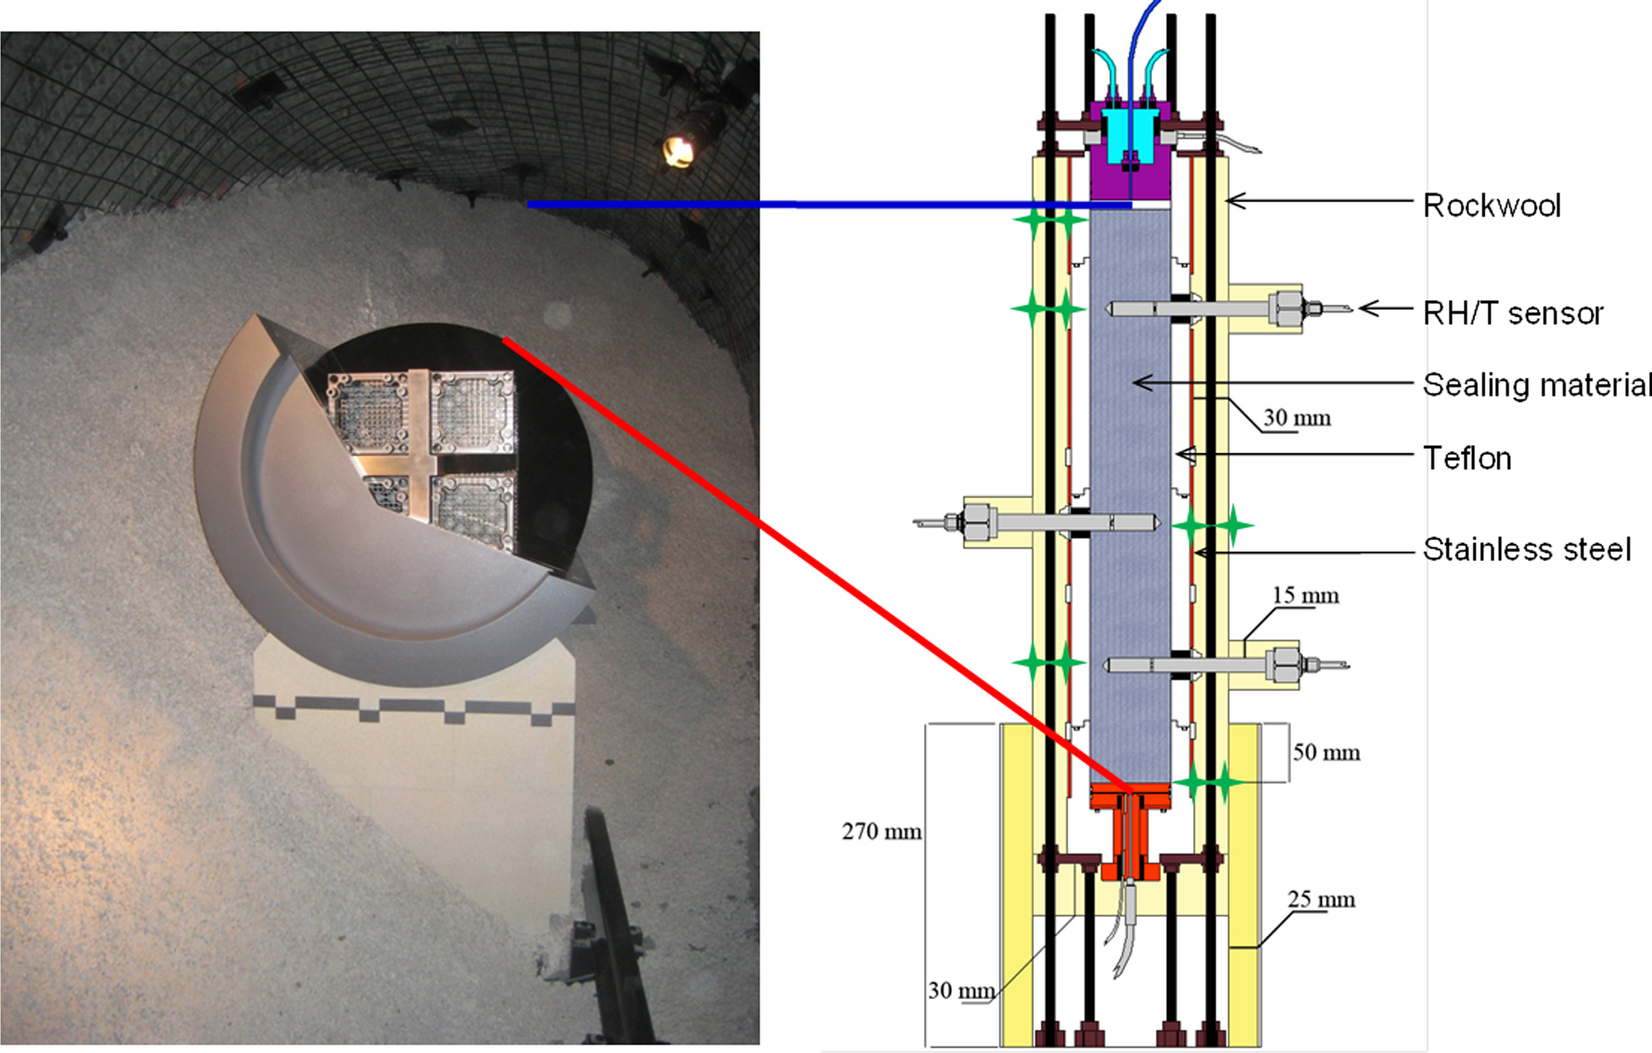
Fig. 1 Reproduction of the Swiss repository concept (Mont Terri URL) and transposition to a test in a cell
The performance of large-scale, in situ tests such as the HE-E has a technical feasibility aim and is also very useful to observe the thermo-hydro-mechanical (THM) processes that take place in the buffer and the geological medium, because these are usually heavily instrumented systems that provide information required for the verification and validation of mathematical models of the coupled processes and their evolution. A summary of the characteristics of some of these tests was given by Villar et al. (Reference Villar, Armand, Conil, de Lesquen, Herold, Simo, Mayor, Dizier, Li, Chen, Leupin, Niskanen, Bailey, Thompson, Svensson, Sellin and Hausmannova2020). The tests are complex and expensive to mount, and for these reasons they should run for long periods of time. The information that can be obtained online about the mineralogical or geochemical evolution is very limited, due to the lack of appropriate instruments. As a result, no information about the mineralogy and geochemistry can be obtained until the tests are dismantled, and even then the number of samples taken may not be enough to allow a representative geochemical characterization of a large-scale system. Such detailed sampling is out of the scope of these demonstration engineering projects, although geochemical information at various pore scales is needed to upscale the progress of reactive transport phenomena (Churakov & Prasianakis, Reference Churakov and Prasianakis2018; Idiart et al., Reference Idiart, Laviña, Kosakowski, Cochepin, Meeussen, Samper, Mon, Montoya, Munier, Poonoosamy, Montenegro, Deissmann, Rohmen, Damiani, Coene and Naves2020). To overcome this lack of experimental evidence at various operation times, laboratory-scale tests in cells are particularly helpful to identify and quantify processes in a shorter period of time and with less uncertainty regarding the boundary conditions than the in situ tests. In these tests, the sealing material in the cells is subjected simultaneously to heating and hydration in opposite directions, in order to simulate the conditions of the clay barrier in the repository, i.e. the interaction of the water coming from the host rock and the thermal gradient generated by the heat emitted by the wastes in the canisters (Fig. 1 right).
This kind of test was performed at CIEMAT with compacted blocks of FEBEX and MX-80 bentonites simulating various repository concepts (e.g. Fernández & Villar, Reference Fernández and Villar2010; Gómez-Espina & Villar, Reference Gómez-Espina and Villar2016). Upon dismantling, the postmortem analyses of the treated buffer materials allowed verification of dissolution of soluble species and their movement by advection and diffusion. Clear changes in the composition of the cation exchange complex were also observed.
In fact, several thermally driven processes that could potentially affect the bentonite barrier have been identified over the years and characterized either through natural analogues, lab and in situ experiments, or modeling work. The most commonly reported alteration processes of bentonite are illitization via potassium fixation in the interlayer, increase in smectite layer charge, and release of silicon (see Leupin et al., Reference Leupin, Birgersson, Karnland, Korkeakoski, Mäder, Sellin and Wersin2014, for a review). Among the main parameters triggering this transformation are temperature and potassium availability, whereas the presence of divalent cations in the interlayer and the unsaturated conditions would suppress conversion. Transformation to chlorite and saponite was also reported (Kumpulainen et al., Reference Kumpulainen, Kiviranta and Korkeakoski2016). In addition, the accessory minerals in bentonite (sulfates, carbonates) will also be affected by the thermal gradient; their dissolution, transport, and re-precipitation could lead to significant salt accumulation close to the heater (Fernández & Villar, Reference Fernández and Villar2010; Kober et al., Reference Kober, García-Siñeriz, Villar, Lanyon, Cloet, Mäder, Wersin, Leupin, Sellin, Gens and Schneeberger2021) and silica precipitation (Svensson & Hansen, Reference Svensson and Hansen2013; Wersin et al., Reference Wersin, Johnson and McKinley2007).
With the double aim of: (1) checking the processes described above in a granular material that had rarely been analyzed previously in such a context; and (2) complementing the information provided by the HE-E in situ test, CIEMAT undertook the performance of a thermo-hydraulic (TH) test in a cell simulating the conditions of the granular sealing material used in the in situ test (Villar et al., Reference Villar, Martín, Romero, Iglesias and Gutiérrez-Rodrigo2016). The test was dismantled in November 2021 (Villar et al., Reference Villar, Iglesias and Gutiérrez-Álvarez2022), and this paper presents the results of the postmortem characterization of the bentonite concerning its mineralogy and geochemistry. To give a background about the conditions to which the material analyzed was submitted and of its final state, the next section presents an overview of the operation phase, the dismantling, sampling, and physical state of the bentonite. This is the first test of this kind reported in which a granular material (pellets) was used instead of compacted blocks.
However, Valter and Plötze (Reference Valter and Plötze2013) performed a series of tests using the same MX-80 bentonite pellets stored in closed systems at various temperatures (from 50 to 150°C) with different degrees of saturation (lower for higher temperatures). The results showed a high mineralogical stability but considerable changes in physicochemical properties, particularly above the critical temperature of 120°C. The cation exchange capacity decreased during heating at 150°C by ~ 10%. The specific surface area dropped by >50%. The water vapor adsorption ability had already dropped by 25% within 3 months at 120°C. These changes were mostly related to the variations in the interlayer cation composition (a slight conversion from the sodium to an alkaline-earth form of the bentonite) and to smectite-aggregation processes.
Background: The In-Cell Test
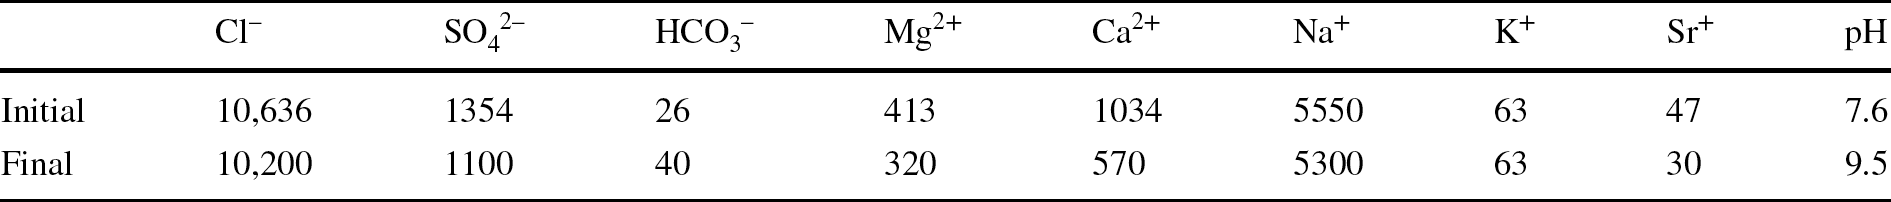
The laboratory TH test was mounted in February 2012. Basically, the test setup consisted of a Teflon cell with an inner length of 50 cm and diameter of 7 cm into which MX-80 bentonite pellets were poured. The cell was instrumented with three relative humidity (RH) and temperature sensors (RH1, RH2, and RH3) and a load cell on top (Fig. 1, right), and surrounded by stainless steel semi-cylinders to limit the Teflon deformation upon bentonite swelling. The initial water content of the pellets was 6%, and the average dry density of the bentonite column was 1.53–1.54 g/cm3, both values close to those of the GBM once emplaced at the URL (5.9% and 1.46 g/cm3). The column was heated at its base at 140°C for 7 months and afterward it was hydrated through the upper surface at a very low pressure for 9 years with a solution contained in a closed vessel. In order to better reproduce the in situ conditions, Pearson water – a sodium-chloride water with minor amounts of sulfate, calcium, and magnesium and a salinity of 19 g/L, replicating host-rock pore water (Pearson, Reference Pearson2002) – was used for hydration of the material in the laboratory. Its chemical composition is indicated in Table 1, along with the chemical composition of the water contained in the hydration vessel determined at the end of the test, when it was dismantled.
Table 1 Initial and final chemical compositions of the water used to hydrate the bentonite column (mg/L)
The temperatures did not change at the beginning of hydration and remained approximately constant until the end of the test. The intense heat dissipation through the bottom of the column gave rise to a sharp thermal gradient close to the heater (Villar et al., Reference Villar, Martín, Romero, Iglesias and Gutiérrez-Rodrigo2016), with temperatures decreasing from 140 to 60°C over 10 cm, and to relatively low temperatures in the rest of the column.
During the dismantling and sampling operations, the column was divided into 26 sampling sections, numbered from S0 close to the hydration surface to S25 close to the heater (Table 2). The thickness of the sampling sections was 2 cm, except for sections S24 and S25 which were 1cm thick to allow for better discrimination in the hottest area. Each of these sections was subsampled for the various measurements reported in the present study.
Table 2 Designations and conditions of the samples taken, and their locations along the column relative to the heater
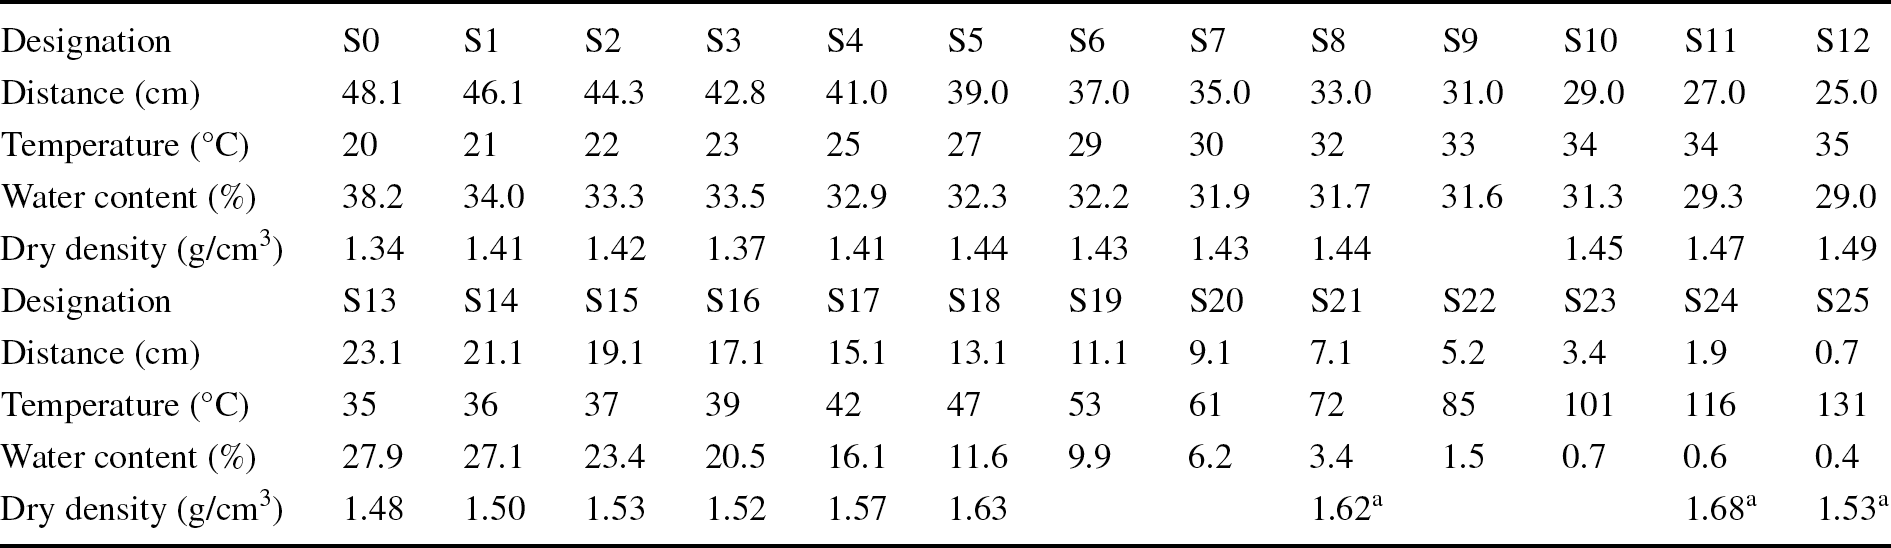
a uncertain values
The water-content and dry-density determinations carried out immediately upon dismantling showed that the upper half of the column had water contents of ~30%, which only increased above this value in the 5 cm closest to the hydration surface. These large water contents corresponded to uniform degrees of saturation between 92 and 99% in the upper half of the column, where the bentonite was compact and dark with a smooth appearance in which no pellets could be discerned. In contrast, the water content and degree of saturation decreased sharply toward the heater in the bottom half of the column, with values close to 0% in the 5 cm closest to the heater. At <16 cm from the heater, the bentonite was lighter in color and was loose. In this respect, the dry density of the upper 30 cm was less than the initial one (particularly close to the hydration surface) but tended to increase toward the heater, where it was difficult to determine because of the disaggregated state of the granulate (consequently the values obtained in this area were uncertain). The best estimation of the average final water content of the column was 22.0%, and of the dry density, 1.52 g/cm3, corresponding to a degree of saturation of ~75%.
The discrepancy between the actual water intake determined upon dismantling and the online measurements (which overestimated the water intake by ~20%) points to the leaking of vapor during operation, possibly via the sensors’ orifices, particularly the bottom one at 10 cm from the heater (RH3). It was not possible to determine at which moment during operation the hermeticity of the seal failed; it was probably related to some sudden temperature change resulting from blackouts that took place on several occasions during the almost 10-year long operation.
Materials and Methods
Material
The same MX-80 bentonite pellets as those used in the in situ test were used for the cell test. The characteristics of the bentonite batch used and the manufacturing process of these pellets were described in detail by Plötze and Weber (Reference Plötze and Weber2007) and summarized by Valter and Plötze (Reference Valter and Plötze2013). The initial water content of the pellets’ mixture was 6.4% and the dry density of the individual pellets was ~2 g/cm3. The grain sizes of the pellets ranged between 10 and <0.1 mm.
The MX-80 bentonite is a brand name used by the American Colloid Company for sodium bentonite from Wyoming (USA), milled to millimeter-sized grains. According to studies performed in different batches of this bentonite by different authors, the montmorillonite content is between 65 and 90%, with quartz, plagioclase, and K-feldspars (contents between 4 and 15%), and minor amounts of cristobalite, tridymite, calcite, gypsum, pyrite, and illite. The cation exchange capacity is 75–82 meq/100 g. Na+ is the main exchangeable cation (50–74 meq/100 g), with Ca2+ (10–30 meq/100 g) and Mg2+ (3–8 meq/100 g) also present.
For the pellets used in this test, the CEC determined in duplicate samples was 78 meq/100 g and the main exchangeable cations were Na+ (62 meq/100 g), Ca2+ (17 meq/100 g), Mg2+ (2 meq/100 g), and K+ (2 meq/100 g). The dry density of the solid grains, determined with pycnometers using water as dispersing agent, was 2.75 g/cm3.
Methods
After the subsamples were obtained, they were analyzed following the methods described below, using PANREAC™ chemicals of analytical grade (Castellar del Vallès, Spain), unless otherwise indicated.
Mineralogy by X-ray diffraction (XRD)
Portions of ~10 g were ground gently in an agate mortar and dried under vacuum at ambient temperature. 0.5 g of the dried samples were further ground to <5 µm using an MM200 RETCH zircon ball grinder (Verder Scientific GmbH & Co. KG, Haan, Germany). The samples were equilibrated and stored in polycarbonate tubes in a 55% RH chamber (controlled by MgNO3 saturated solution at 25°C) for > 48 h prior to taking randomly oriented powder XRD patterns. At this RH, Na smectite typically exhibits a 1.25-nm basal reflection and Ca-smectites at ~1.50 nm (MacEwan and Wilson, 1984). The XRD patterns were recorded in an angular range of 3–70°2θ in an X-PERT Panalytical instrument with an X-CELERATOR detector (Malvern PANalytical™ Ltd, Malvern, UK), which allowed the taking of measurements equivalent to 0.016°2θ angular steps for 100 s for each step. The voltage and intensity of the X-ray Cu tube were 45 kV and 40 mA, respectively. The equipment used monochromatic radiation provided by a Ge 111 primary monochromator.
The mineralogical composition was identified qualitatively taking into account the International Centre for Diffraction Data (ICDD) powder diffraction files (PDF) standards supported by the High Score Expert Plus© software (version 2.1.b 2005). Direct comparison of graphical representations of XRD sample profiles was preferred to semi-quantitative interpretations to assess mineralogical differences related to smectite hydration states or distribution of exchangeable cations.
The variation of the d values of the basal reflections for montmorillonite in powder patterns was used to confirm changes in the distribution of exchangeable cations. The measurement of the basal spacing was performed also in <0.5 µm fractions previously extracted by means of deionized water suspension and centrifugation. To obtain the <0.5-µm fraction from the 10-g ground portion mentioned above, ~ 3 g of bentonite was wetted in 800 cm3 of deionized water in a 1-L polypropylene beaker for at least 24 h. After this time, the clay-water mixture was treated using a rod stirrer and an ultrasonic water bath simultaneously for 5 min; then it was just stirred for 5 min, and this cycle was repeated five times. After 1 h, none of the mixtures flocculated and the <0.5 µm size fraction was separated by centrifugation with no dispersing agent added in order to avoid changing artificially the structural-chemical composition of the clay fraction. However, as will be discussed in the Results section, this was not true due to the dissolution of soluble salts that may change the distribution of exchangeable cations to some extent. A centrifuge was used with an oscillating rotor (SIGMA® (Osterode am Harz, Germany) mod. 3–16, 11,133, swing out rotor max. 5500 rpm, 664 × g), thus allowing the calculation of the centrifugation time for the size fraction. Calculations were done using Centriset© software (Poppe & Eliason, Reference Poppe and Eliason2009). The <0.5 μm size fraction suspensions were flocculated by the addition of 10 cm3 of 95% ethanol. Washings were performed by repeating ultrasonic bath dispersion and centrifugation until ethanol electrical conductivity was <10 µS/cm, which was achieved typically after 3–5 washing cycles. The ethanol wet slurries were dried in a desiccator with silica gel. The oriented aggregates were prepared using a 0.05 g/mL dispersed slurry that was smeared onto a 2-cm2 glass tile and left to dry in the laboratory under ambient conditions. Ethylene glycol (EG) solvation was performed inside a closed plastic box, adding a filter paper inside impregnated with a few drops of EG. EG vapor entered the clay film deposited on the glass tiles lying on the paper (48 h). These samples were scanned from 3 to 40°2θ under the same conditions as the powder patterns. Basal spacing reflections were treated using the DRXWin® software (vs. 2.3.22. V. Primo©). Peak positions were determined using a deconvolution algorithm based on Pseudo-Voigt functions.
A portion of the <0.5-μm size fraction of selected samples and the reference MX-80 bentonite was Ca-homo-ionized by soaking the centrifuged <0.5-μm size fraction in a 0.5 M CaCl2 solution for 1 h. The suspension was washed in a first batch with pure water followed in subsequent steps by using 95% ethanol. The XRD random powder profiles were registered for these fractions in order to check their monomineralic character. The Ca-homo-ionized <0.5-µm size fractions were used for X-ray fluorescence analysis (XRF) and 29Si and 27Al Nuclear Magnetic Resonance (MAS-NMR) measurements.
X-ray fluorescence analysis
The Ca-homo-ionized <0.5-µm fraction, obtained as outlined above, was dried at 60°C and ground in an agate mortar. 0.5 g of the dried sample was fused with lithium tetraborate (0.3:5.5 sample:flux) in a PerlX’3 automatic bead preparation system (PANalytical™ B.V., Almelo, The Netherlands). The major elements were determined by means of wavelength dispersive XRF in a ZETIUM instrument using a rhodium X-ray tube (Malvern PANalytical™ Ltd, Malvern, UK).
Thermogravimetric analysis (TGA)
Thermal analysis of the samples was performed with 0.5 g of the bulk sample prepared just by ball milling (as detailed above for bulk randomly oriented powder XRD) ground to <5 µm. They were tested in a DSC/DTA/TGA Q600 TA Instruments R module (TA Instruments, Crawley, UK) from 25 to 1000°C at a temperature increment rate of 10°C/min.
Scanning Electron Microscopy and Energy Dispersive X-ray Spectroscopy (SEM–EDX)
SEM–EDX analyses were performed using an Hitachi S-3000N with a theoretical resolution of 3 nm at 25 kV and voltage from 0.3 to 30 kV. An EDX detector was coupled to an Oxford Instruments X-ray Energy Dispersive analyzer, model INCAx-sight (Oxford Instruments Analytical, High Wycombe, UK). Measurements were made in high vacuum, and secondary-electron or backscatter-electron detectors were used. Samples were prepared by scrapping unaltered chips at the surfaces, which were then dried in vacuum for at least 24 h. Finally, they were adhered to a flat aluminum sample holder by means of graphite adhesive tape and metallized with Au prior to observation. EDX chemical analysis included C and O, quantified with significant uncertainty. Nevertheless, they were included in order to support criteria for consideration of the presence of carbonates and Fe oxides.
High-resolution 29Si, 27Al, and magic angle spinning (MAS) Nuclear Magnetic Resonance (NMR)
The MAS-NMR spectra were recorded at 79.49 and 104.23 MHz (9.4 T magnetic field), with single pulse experiments by spinning the samples at 10,000 cps at the magic angle (54°44'') using a Bruker Avance 400 spectrometer equipped with a Fourier-transform unit (Bruker, Karlsruhe, Germany). The pulse lengths were 5 and 2 μs and the recycle delays were 10 and 5 s, respectively, for the 29Si and 27Al nuclei, to get a maximum in the intensity of the experimental signal. The number of accumulations was 800 for 29Si (4.6% abundance) and 400 for 27Al (100% abundance) signals. Chemical shifts are reported in ppm relative to tetramethylsilane (TMS) for 29Si and 1 M AlCl3 aqueous solution for 27Al. This analysis was performed with 0.5 g of the Ca-homo-ionized <0.5-µm fraction, prepared as outlined above, and ground to <5 µm.
Aqueous extracts
The total amount of dissolved inorganic solutes was analyzed in aqueous extract solutions. To prepare the aqueous extracts, the samples were crushed after some air drying and mixed with deionized water to give a solid:liquid weight ratio of 1:8 (with 5 g of clay). The suspensions were shaken and allowed to react for 24 h under atmospheric conditions. After phase separation by centrifugation for 30 min at 15,500 rpm (26,326 × g), using a high-speed refrigerated bench top centrifuge (Sigma 3K30, Osterode am Harz, Germany) with a fixed 25º-angle rotor, the supernatants were filtered through a 0.45-µm filter and the concentration of major cations analyzed by Inductively Coupled Plasma-Atomic Emission Spectrometry (ICP-AES, Varian 735ES spectrometer, Agilent Technologies, Santa Clara CA, USA), sodium and potassium by flame atomic emission spectrometry (FAES, in an Agilent AA 240 FS spectrometer, Santa Clara CA, USA), anions by ion chromatography (using a Dionex ICS-2000 equipment, Sunnyvale CA, USA) and alkalinity by potentiometric titration (using a Metrohm (Herisau, Switzerland) Titroprocessor MOD796 equipped with a pH micro-electrode 6.0224.100, with a specific dynamic equivalence point titration (DET) method). The data obtained were corrected, taking into account the gravimetric water content of each sample, which was determined for each sample after a period of air drying enough to allow its crushing. All the measurements were performed in duplicate and the values given are the average of the two.
Cation exchange capacity (CEC) and exchangeable cations
The CEC was measured with a 0.01 M copper triethylenetetramine (Cu-Trien) solution according to Ammann et al. (Reference Ammann, Bergaya and Lagaly2005), dispersing 0.2 g of bentonite in 25 mL of deionized water and 10 mL of Cu-Trien (0.01 M). The 0.01 M solution of Cu-Trien was prepared by dissolving 0.01 mol of triethylenetetramine (Merck ≥ 97% for synthesis; Darmstadt, Germany) and 0.01 mol of CuSO4 (Merck 99–101%). The standard deviation of the measurement was ± 2 meq/100 g. After 1 h of shaking, a complete exchange of the Cu-Trien complex with the exchangeable cations was guaranteed. Afterward, the suspensions were centrifuged at a constant rotation speed of 15,500 rpm (same equipment and conditions as for the soluble salts) for 20 min, 3 mL of the clear solution was filled into 1-cm optical glass cuvettes and the absorbance of the solution at 578 nm was measured using a Merck Spectroquant VEGA 400 spectrophotometer (Darmstadt, Germany). The determination of the exchangeable cation population was performed by using cesium as the index cation (Sawhney, Reference Sawhney1970). Cs acts as a highly selective cation, displacing all exchangeable cations from the clay minerals if its concentration is sufficiently high. The clay samples were equilibrated at a 1:8 (5 g:40 mL) solid to liquid ratio with a solution 0.5 M of CsNO3 (Sigma Aldrich 99%; Steinheim, Germany) at pH 8.2. After phase separation by centrifugation (30 min at 15,500 rpm), the supernatant solutions were analyzed. Sodium and potassium were determined by FAES and the concentration of the rest of the major cations was analyzed by ICP-AES using the same equipment as indicated above. The values obtained for CEC and exchangeable cations were corrected, taking into account the water content of the samples, i.e. the values were recalculated for bentonite dry weight. All the measurements were performed in duplicate and the values given are the average of the two.
Results
Mineralogy by XRD
The main mineralogical component of the bentonite is montmorillonite, with percentages between 70 and 80%. The (hk0) XRD random powder montmorillonite reflections near 20 and 62°2θ corresponding to a dioctahedral smectite maintained shape and intensity in all the analyzed samples (Fig. 2). Gypsum was detected in the raw bentonite and in the samples located at distances between 10 and 44 cm from the heater, with a maximum at 20 cm from the heater (where the intensity of the 0.76-nm reflection was remarkable). However, it was absent in the 10 cm closest to the heater and in the ~6 cm closest to the hydration surface. Halite was present at 10 cm from the heater and the calcite reflection was seen in samples S24 and S25 (2 cm from the heater).
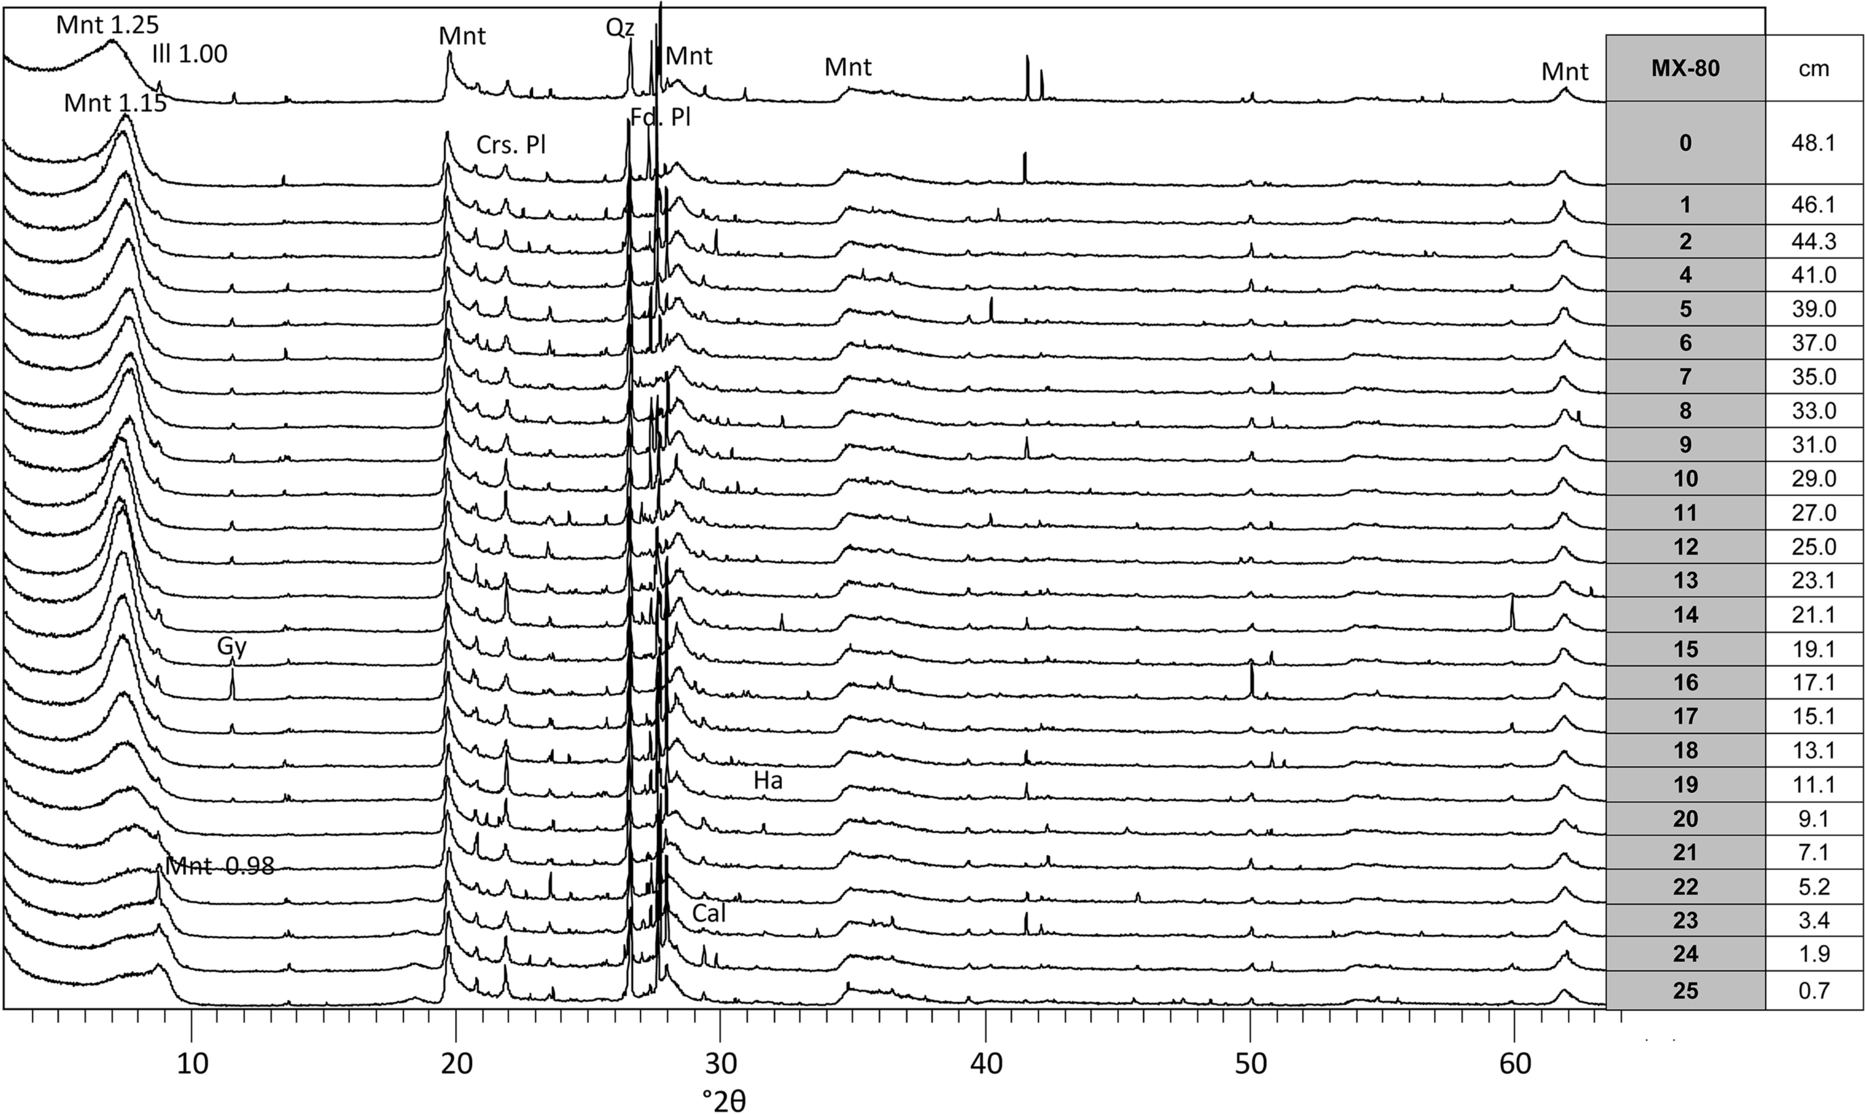
Fig. 2 Random powder XRD patterns of MX-80 column samples taken at various distances from the heater (see Table 2) equilibrated for 48 h at RH 55%. The spacing of some reflections is indicated in Å. Montmorillonte (Mnt), illite (Ilt), gypsum (Gp), Cristobalite (Crs), plagioclase (Pl), quartz (Qz), K-feldspar (Kfs), halite (Hl)
The dominant basal spacing of the montmorillonite stabilized for 48 h at RH = 55% can be traced by comparing the powder patterns of the samples taken at different distances from the heater in Fig. 2. Spacings at 1.11–1.25 nm dominated, in agreement with the Na-smectite character of MX-80, although a peak shoulder toward lower angles indicated some divalent cation substitution. In the 30 cm closest to the hydration surface the reflection at 1.14 nm predominated over the 1.25 nm peak, probably indicating the displacement of cations in the interlayer by the sodium coming with the Pearson solution used for hydration. In the region between 10 and 20 cm from the heater, the reflection at 1.25 nm plus the low-angle shoulder were present. In the 10 cm closest to the heater, the main reflection was at 1.14 nm, a 1.0-nm illite spacing became visible and a tail centered at 0.98 nm (dehydrated smectite) was also visibly present. Close to the heater, where the temperature was highest (Table 2), a severe dehydration of the smectite structure occurred which was not recovered even after placing the samples at 55% RH conditions for 48 h.
In fact, the basal reflection of the samples could be deconvoluted into two peaks (Fig. 3, left). The values of these two peaks were significantly different in the samples at less than 10 cm from the heater than in the other ones. In most of the samples the main reflection corresponded to the 1-layer hydrate of a predominantly sodium montmorillonite (between 1.2 and 1.3 nm), but with a trend to increase toward the hydration surface, which would be consistent with the incorporation of divalent cations toward it. In these samples, the secondary reflection had a rather constant value at 1.14 ± 0.01 nm. In the four samples closest to the heater, the main reflection corresponded to an unusual thickness for 1-layer hydrate (1.10 nm) and the secondary one to the totally collapsed interlayer (0.98 nm), which highlights their difficult rehydration under room conditions.

Fig. 3 Main and secondary peaks obtained by deconvolution of the basal reflection of the bulk samples stabilized at 55% RH (left) and of air-dried oriented aggregates (right)
As explained in the Methodology section, the 0.5-µm size fraction was separated by suspension in water and centrifugation and the slurries obtained were smeared onto glass tiles to be air dried and EG solvated. The procedure involving the direct wetting of bulk samples should be valid to produce rehydration if the smectite structure was not damaged. Results reported in Fig. 4 confirmed regular EG expansion as expected for an unaltered, fully expandable smectite. Also, in the EG-OA patterns a 1.0-nm, low-intensity illite reflection was identified along with the (002) 0.84-nm reflection of smectite (Fig. 5).
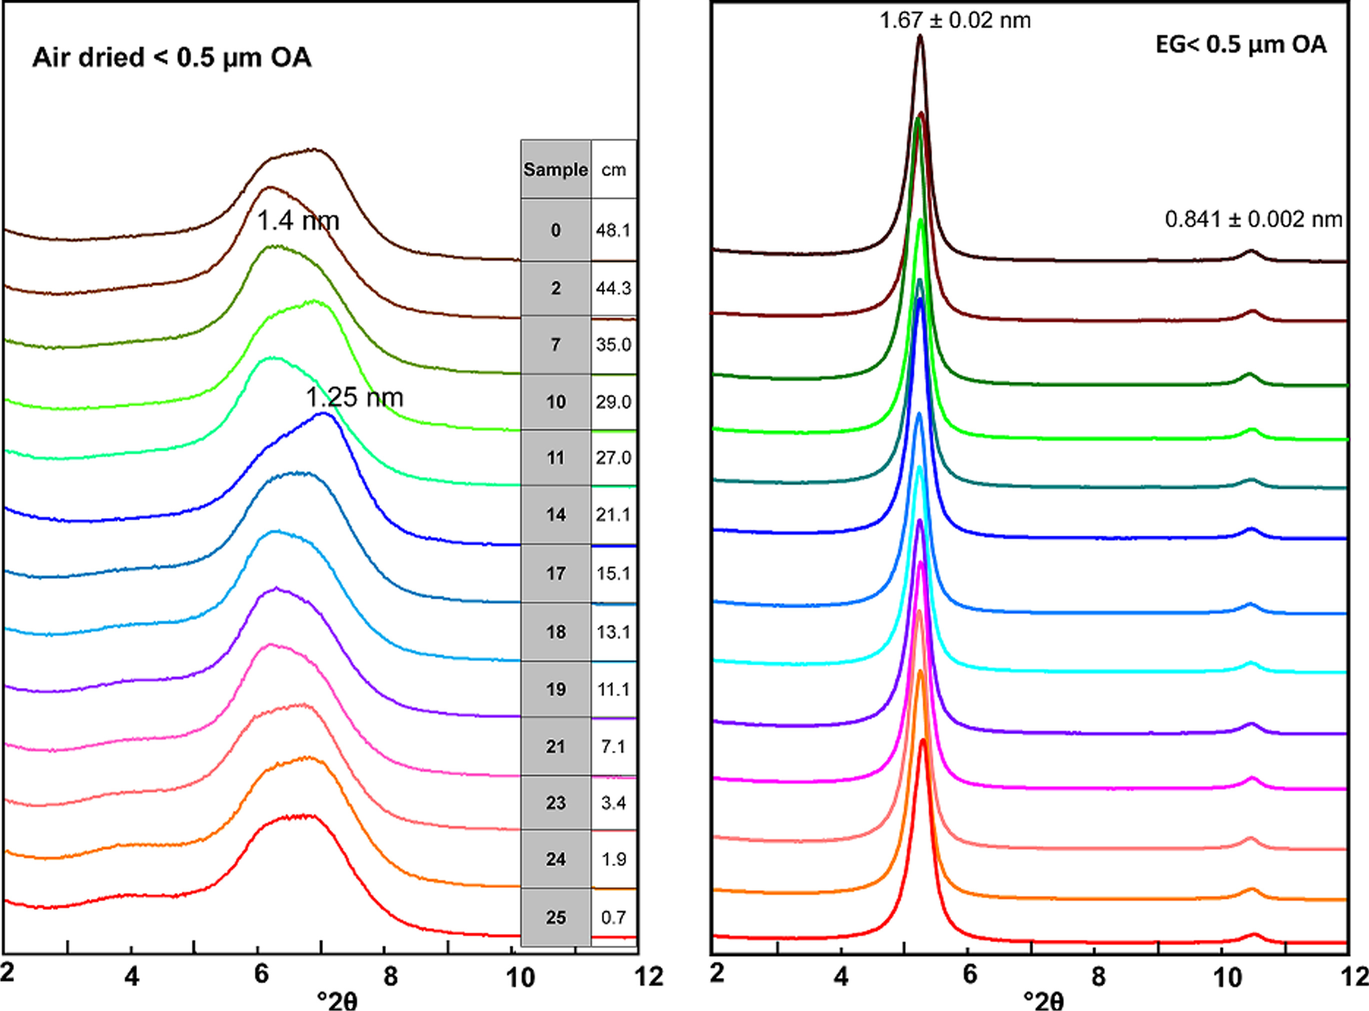
Fig. 4 XRD patterns of the air-dried (OA) and ethylene–glycol solvated (EG) oriented aggregates of samples taken along the bentonite column (the sample designations according to Table 2 and their distance to the heater is indicated)

Fig. 5 Random powder XRD pattern of the Ca-homo-ionized <0.5-µm size fraction of sample S7 (upper left); detail of presence of cristobalite (Crs) and quartz (Qz) (bottom left); linear regression for K2O and SiO2 in the XRF analyses (upper right); 1.0 nm illite to (002) Mnt (IEG/002) in the ethylene glycol-solvated, oriented aggregate (EG-OA) XRD patttern versus cristobalite (0.403 nm) plus quartz (0.334 nm) normalized to the (060) montmorillonite reflection (bottom right)
Air-dried oriented aggregates revealed a complete hydration behavior and the presence of both sodium and divalent cations (mainly calcium, as will be shown below) in the exchange complex, evinced by a bimodal reflection in the basal spacing. The deconvolution of the basal reflection of the XRD patterns of the oriented aggregates showed, in most cases, four peaks, the two major ones being at 1.26 ± 0.03 nm and at 1.43 ± 0.02 nm (Fig. 3, right), with no clear trend along the column. The ratio between the area of the 1.4-nm reflection (2-layer hydrate) to the 1.3-nm reflection (1-layer hydrate) would indicate the predominance of the first one, which would correspond to a divalent smectite dried under room conditions, in contrast with what was observed in the random powders of the bulk samples. This difference will be examined in the Discussion section.
Chemical Analysis and Calculation of the Smectite Structural Formulae
The analyses of major elements by XRF in the separated Ca-homo-ionized <0.5-µm size fraction are shown in Table 3. The dry mass for extracting this size fraction, obtained by using, at least twice, the two-step suspension and centrifugation method, was 1–0.5 g, and, frequently, obtaining a precise loss on ignition percentage to fulfil the major oxide analysis inventory using XRF was not possible. An example of XRD patterns of the random powders of this Ca-homo-ionized <0.5-µm fraction is shown in Fig. 5.
Table 3 XRF chemical analysis of the Ca-homogenized <0.5-µm size fraction of some samples
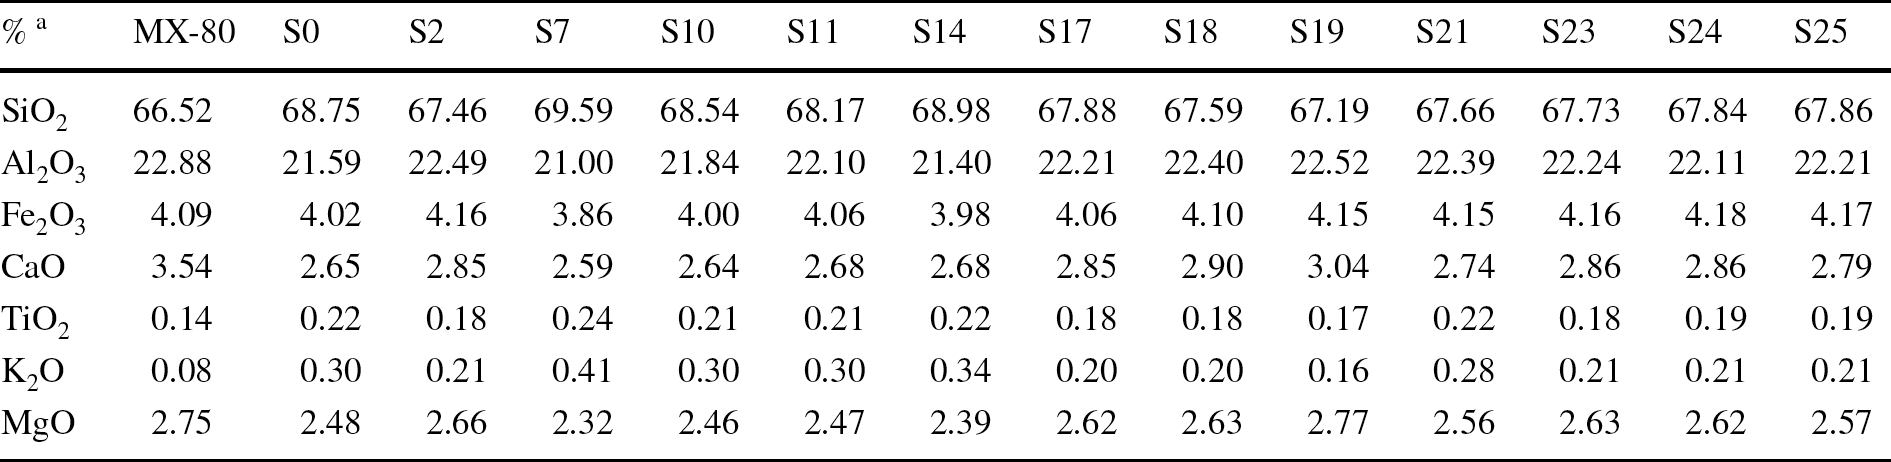
a Major ions recalculated to sum to 100%. P2O5 and MnO were also analyzed (<0.05%)
The chemistry of the clay fractions in the experiment varied systematically from the reference MX-80. All the samples had more K2O than the reference one, and the K occupation increase was related to the Ca decrease in the calculated structural formulae (Table SM1 in Online Resource 1). The calculated Si was set to 4 in the samples in which the first calculation gave numbers above 4. Although the <0.5-µm fraction was mostly composed of montmorillonite, the enlargement of the 18–28°2θ range shows the presence of cristobalite and quartz as fitted by Xpert Highscore Plus vs. 2.1b (2005), without any traces of plagioclase and feldspars (Fig. 5 bottom left). K2O and SiO2 were well correlated (Fig. 5 top right), which evinces the presence in this small size clay fraction of both silica minerals and confirms the presence of a discrete illite-like phase, the latter in very small amounts (<2% if illite is considered ideally as K0.7Al2Al0.7Si3.3O10(OH)2; Guggenheim et al., Reference Guggenheim, Adams, Bain, Bergaya, Brigatti, Drits, Formoso, Galan, Kogure and Stanjek2006; Nieto et al., Reference Nieto, Mellini and Abad2010). This discrete illite-like mineral was an original accessory mineral in the MX-80 bentonite as shown by its presence both in the untreated MX-80 sample and in several samples along the column (Fig. 2). It would not be a new mineral produced by a progressive illitization process, which is usually characterized by the formation of random illite–smectite mixed-layering (e.g. several examples in Meunier, Reference Meunier, Fiore, Cuadros and Huertas2013). The areas measured in the EG-OA patterns for the illite main reflection (Fig. 4, right) and for the silica minerals in the <0.5-µm clay fraction random powder were well correlated (Fig. 5, bottom right). In any case, this is to be taken just as a qualitative trend because the relationships between the XRD reflection areas could be perturbed by differences in preferred orientation (powder or oriented aggregates mounts) of these minerals of very distinct habits (Dohrmann et al., Reference Dohrmann, Rüping, Kleber, Ufer and Jahn2009). The presence of these impurities in the analyzed fraction does not allow a discussion of the precise changes in layer charge and cation occupancy, although compositions tended to be somewhat constant along the column with respect to the original montmorillonitic (octahedral charge predominance) character. A correlation analysis showed significant relationships among K2O, TiO2, and SiO2 percentages (Pearson regression coefficient, r > 0.9; p-value <1‰), which were negatively correlated with the MgO percentage (r < -0.9; p-value <1‰), whereas octahedral Al and Fe and octahedral charge itself did not show significant correlation with any variable. This led us to assume that the calculated formulae (Table SM1) contained accessory quartz and cristobalite related also to the presence of a micaceous (illite-like) mineral.
The constancy of the values in the calculated formulae indicates a minor alteration of montmorillonite along the bentonite column, with no clear trends along it.
Differential Thermogravimetric Analysis
Differential thermogravimetric analysis (DTG) determines changes in the dehydration temperature (Fig. 6). The samples taken very near to the heater and close to the hydration surface (S25, S24, and S0, which showed basal spacings at 1.15 nm, Fig. 2) experienced a clear dehydration at 54°C. In contrast, samples taken at distances from the heater between 10 and 30 cm (S19 to S11, in blue-green color, with basal reflections at 1.25 nm in the random powders) exhibited an increased dehydration temperature to ~75°C and also a 110°C effect; all this indicated more divalent cation occupancy in the exchange complex (Caglar et al., Reference Caglar, Afsin, Tabak and Eren2009). Low intensities in the 54–75°C dehydration peaks in samples near the heater were related to smaller water contents than in the rest of the samples, in agreement with the critical dehydration effect described above. The dehydroxylation temperature at 670–680°C and the identical peak shape and area among the samples indicated that no relevant changes occurred in the smectite structure.
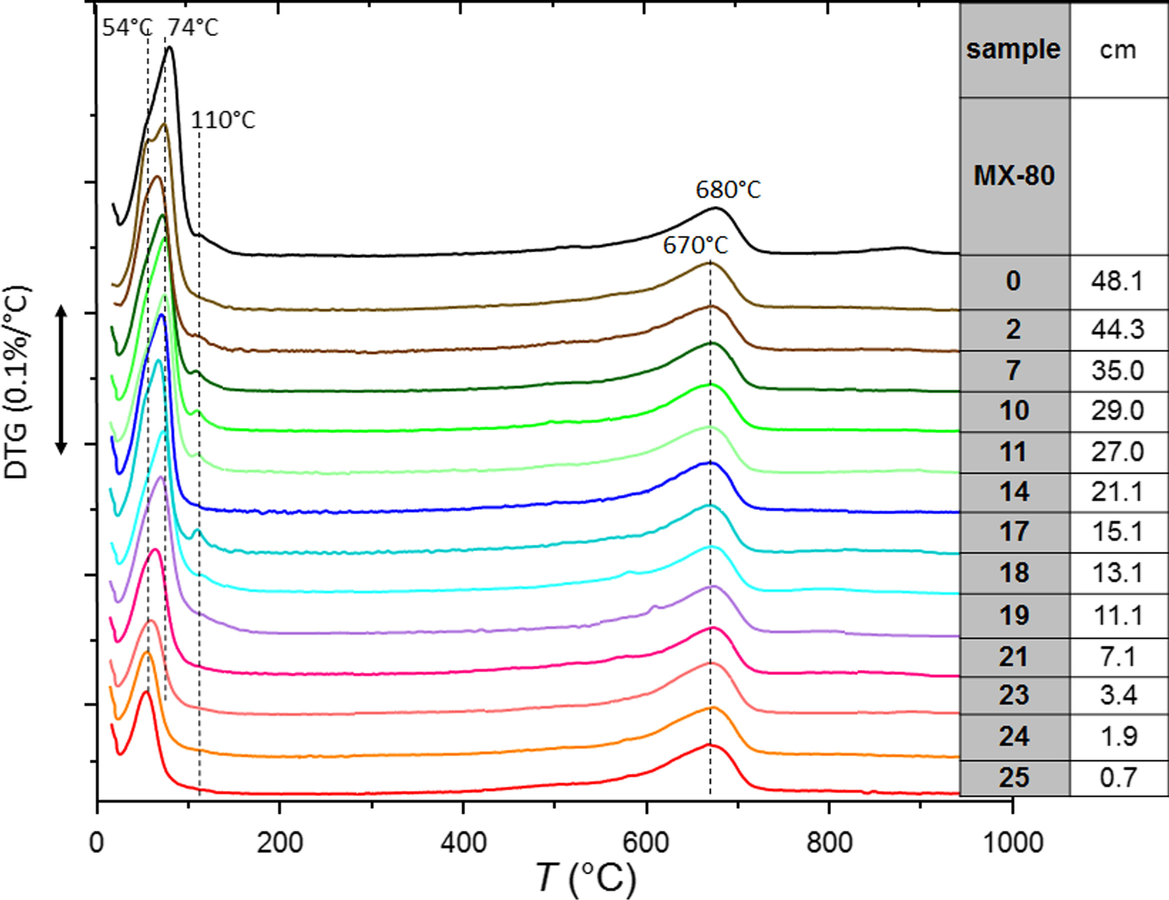
Fig. 6 DTA data of selected samples along the HEE column experiment
Nuclear Magnetic Resonance (NMR)
The 27Al MAS NMR spectra of the treated samples and of the reference MX-80 bentonite contained a central-transition resonance for one octahedrally coordinated Al site, at δ = 1.5 ppm (Fig. 7), related to the Al in the octahedral sheet. This central band from octahedrally coordinated Al exhibited an asymmetric line shape with a tail to lower frequency that is characteristic of Al sites experiencing a small distribution in quadrupole coupling parameters and chemical shifts. This distribution may reflect the presence of multiple Al sites in the octahedral VIAl layer, having different surrounding environments as a result of the partial substitution of Al by Mg and Fe (Morris et al., Reference Morris, Bank and Ellis1990).
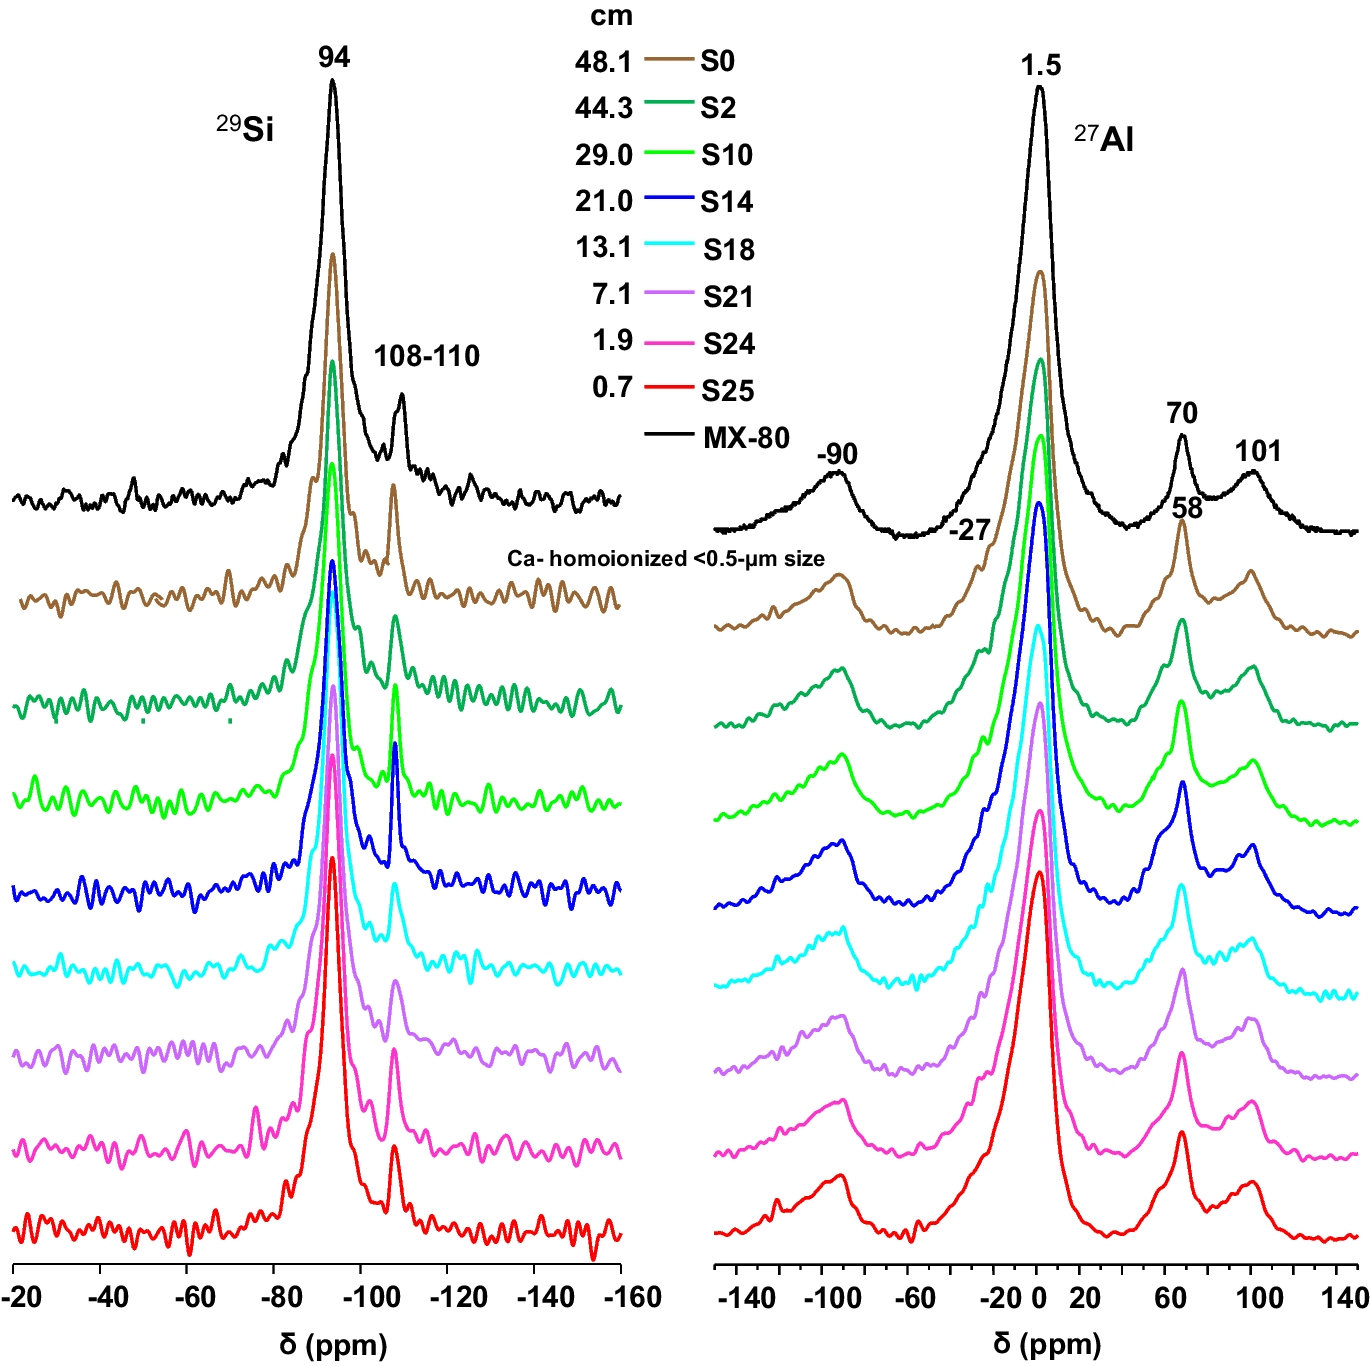
Fig. 7 29Si and 27Al MAS-NMR spectra for the Ca-homo-ionized <0.5-µm size fraction of selected samples
Besides, Al occupies sites in two tetrahedral environments (δ = 58 and 70 ppm). The higher-frequency tetrahedral resonance reflects a small degree of isomorphic substitution of aluminum into the tetrahedral silicon layer, whereas the 27Al signal at ~58 ppm indicates the presence of a very small quantity of an impurity phase from an Al(OSi)4 site typical of the illite-like component mentioned above (Mantovani et al., Reference Mantovani, Escudero and Becerro2009).
The 29Si NMR spectra displayed the main signal at δ ~ –94 ppm, which is attributed to IVSi in montmorillonite and corresponds to Q3Si (Lippmaa et al., Reference Lippmaa, Mӓgi, Engelhardt and Grimmer1980). The corresponding signal had a rather broad line indicating local disordering of the Si environment within the montmorillonite structure. The presence of a shoulder in the main signal at relative lower chemical shifts can be assigned to Q3 [1Al] sites and indicates a low degree of partial substitution of IVAl for IVSi in the tetrahedral sheets (Sánchez et al., Reference Sánchez, Cuevas, Ramírez, Ruiz-De-León, Fernández, Vigil-De-La-Villa and Leguey2006). Signals at –101 ppm, corresponding to [(SiO), SiOH], and around –108 and –112 ppm were assigned to Q4-29Si chemical shifts (Q4(0Al) and Q4(1Al), respectively) of the silica polymorphs: quartz and cristobalite present in the <0.5 µm size fraction (Smith & Blackwell, Reference Smith and Blackwell1983).
Summarising these observations, the NMR analyses showed that Si was in pure SiO4 environments with Al mostly in octahedral coordination, with small tetrahedral coordination for Al replacing Si. Hence, no changes were observed with respect to the reference MX-80 montmorillonite.
Scanning Electron Microscopy and Energy Dispersive X-ray Spectroscopy (SEM–EDX)
Electron microscopy observation was used to show the morphological and compositional characteristics of three main zones along the column experiment: (1) the heater contact, with loose dry pellets and bentonite powder (S25); (2) the > 60°C zone (10 cm closest to the heater), where there was evidence of difficult rehydration (S20); and (3) the hydration source (S0).
At the heater contact (S25 sample), pellets were fractured and examined. Clay surfaces taken from fresh fracture of these dry pellets had the aspect of dense, stacked laminar aggregates. In the borders of the laminar aggregates there were disperse cavities with very fine-grained coatings (fill) inside (Fig. 8). Localised EDX analyses were also taken in the cavity clay wall and in the clay at the border outside the cavity (out) and both the analyses and the structural formulae calculated from them are shown in Table 4. The fillings or crusts in the voids contained relatively large C, Na, and S proportions with respect to the clay walls of the cavities or the outer clay. These clays had greater quantities of exchangeable K and octahedral Fe than the surrounding clay analyses. In spite of the large K content, they had layer charge magnitudes very similar to the average for the clay at the heater contact calculated from 12 analyses. The calculated structural formulae were in agreement with the presence of a dioctahedral smectite (2 octahedral cations/O10(OH)2 basis). Na predominated in the exchangeable cation distribution. The tetrahedral charge was greater than those calculated from XRF analysis in the Ca-homo-ionized <0.5-µm fraction shown in Table SM1. The values obtained by EDX should be taken as an approximation, because some Mg could be allocated to the interlayers and the octahedral charge might rise (García-Romero et al., Reference García-Romero, Lorenzo, García-Vicente, Morales, García-Rivas and Suarez2021). Sulfur was present in small quantities in the clay; dispersed spots (<1 µm in size) were identified as pyrite (FeS2).
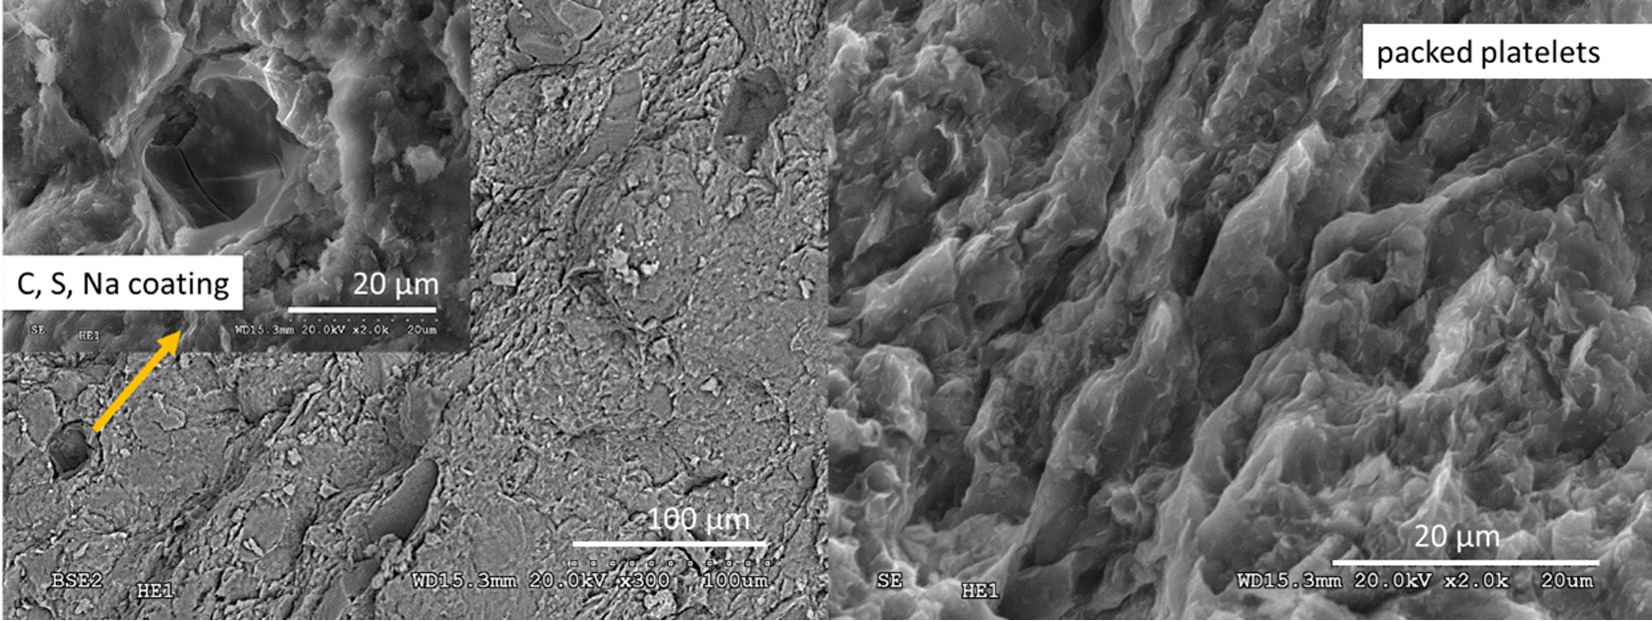
Fig. 8 SEM–EDX observation at the heater contact (S25 sample): scattered cavities with fine-grained coatings (left); dense stacked clay-aggregate fabric in the heater zone (right)
Table 4 SEM–EDX localized analyses in sample S25 and structural formulae calculated from them. Fill: inside cavity; Wall: cavity rim; Out: external clay surrounding cavity; Bulk: clay analyses in the dense aggregates. Average of three analyses in cavity zones and 12 analyses in the dense clay aggregates matrix. LCh: layer charge (K + (2xCa) + Na/O10(OH)2); Sumoct: sum of octahedral cations

a S, Na, Ca contents too large to fit the smectite structural formulae
Sample S20 (taken at 9 cm from the heater) was characterized by the bright patched surfaces corresponding to NaCl glassy coatings (Fig. 9a). These coatings did not have the typical euhedral crystalline cubic morphologies expected from NaCl crystallization. This would mean that a fast precipitation process was involved in the formation of these coatings. Gypsum was detected inside the relatively dry pellets (Fig. 9d), as well as in the more hydrated samples S17 and S19 (not shown here). The chemical analyses of clay zones are presented in Table 5. The structural formulae were corrected for sodium chloride and they were very similar to those obtained previously with no indication of crystal-chemical changes in this saline environment.
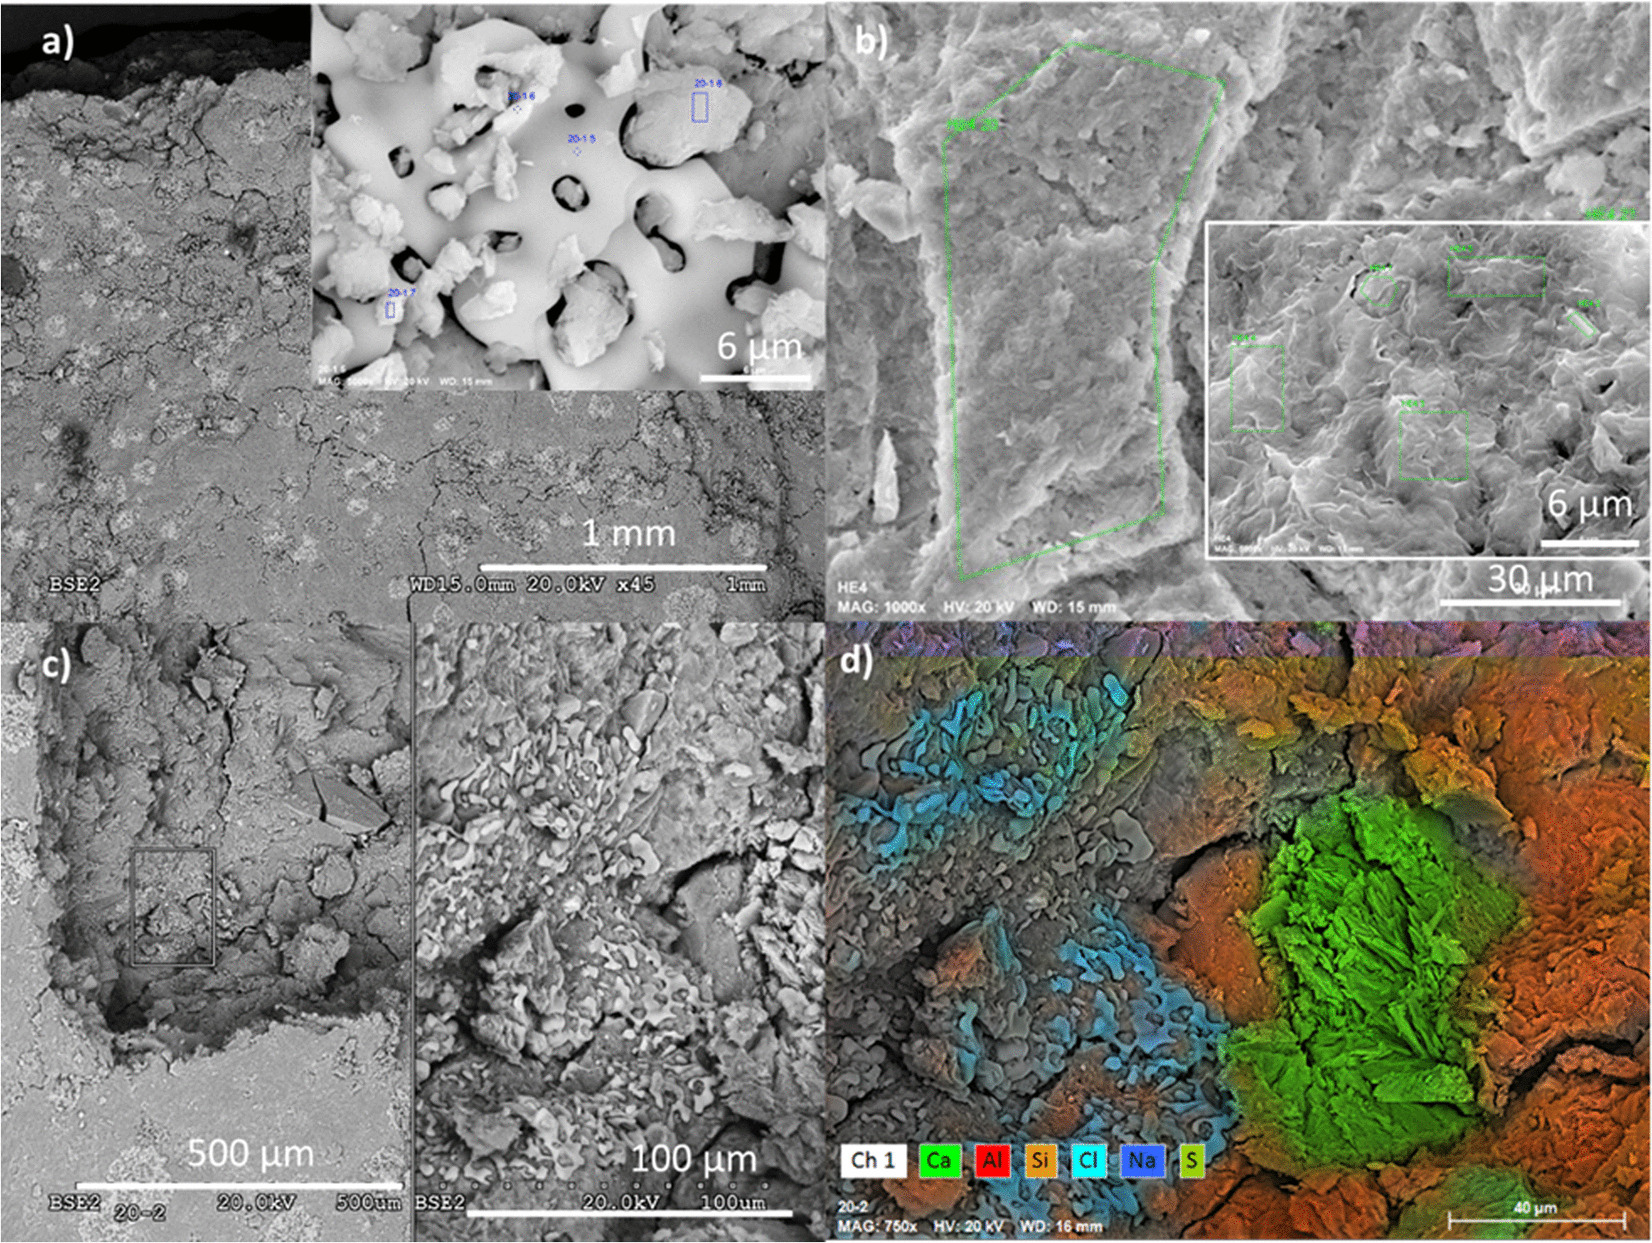
Fig. 9 a SEM–EDX examination of clay pellets at 9 cm from the heater (sample S20) and at the hydration surface (sample S0); inset, an S20 pellet surface and detail of NaCl glassy morphology coatings; b hydration zone with filter cellulose fiber marks and detail of typical smectite platelets fabric; c backscattered electron images of S20 pellets showing glassy NaCl coatings also inside a broken pellet; d EDX characteristic X-rays used to outline colours corresponding to NaCl and CaSO4 precipitated around cracks and plate-like discontinuities within the pellets
Table 5 Average and standard deviation for six and 12 EDX analyses performed in the clay materials of samples S20 and S0, respectively, and structural formulae calculated from them (Sumoct: sum of octahedral cations; LCh: layer charge (K + (2xCa) + Na/O10(OH)2))

(a) Na and Ca contents too large to be corrected properly with Cl and S
The sample closest to the hydration surface (sample S0) was composed of a homogeneous clay material in which the clay aggregate borders were not easily distinguished (Fig. 9b). Fresh fractures revealed polygonal honeycomb textures typical of low-density porous zones in smectitic clays (Fesharaki et al., Reference Fesharaki, García-Romero, Cuevas-González and López-Martínez2007). These zones and the hydration contact surface (in which cellulose fibers from the filter paper remained) were analysed by EDX once the cellulose filter had been removed (Table 5). Clay formulae, calculated from EDX analyses, were in agreement with the presence of a dioctahedral smectite (2 octahedral cations/O10(OH)2 basis). The Ca/Na ratio in the analyses of the hydration zone was greater than at the heater zone (bulk sample S25), although Na predominated. The Na and Ca contents were large compared to the heater zone. Tetrahedral charge predominated slightly over octahedral. Zinc was probably leached from the metallic parts of the water inlet connections and was observed to have precipitated as chloride and sulfate. The structural formulae of sample S0 are also compatible with montmorillonite, although it was not possible to apply a reasonable correction because the layer charge was too high to be consistent with the previous data. Small spots (<1 µm), observed bright under back-scattering electron mode, with pyrite composition were also observed at numerous locations in this zone.
Aqueous Extracts
The main ions in the aqueous extracts of the untreated pellets were sulfate and sodium (with an ionic strength of 0.02 mmol/L). During the test, the average sodium and chloride contents increased with respect to the initial content, because these were the predominant ions in the hydration water (Table 1); the average Na+ content in the column after the test was 19.9 meq/L and the Cl– content was 7.0 meq/L, whereas the initial values were 17.0 and 0.4 meq/L, respectively. The fact that the increase in chloride was much more significant could indicate that part of the sodium content measured in the aqueous extracts of the initial material actually corresponded to exchangeable sodium. The average amount of calcium, magnesium, and potassium ions clearly increased, as did that for sulfate. The solubilization of mineral species by the increase in water content, along with the input of ions with the hydration water, would be responsible for the overall increase in ion content, which was particularly significant in the region between 5 and 20 cm from the heater (Fig. 10, Fig. 11). Bicarbonate was the only ion that decreased on average with respect to the initial value. Only potassium and bicarbonate (in minor concentrations in the hydration water) decreased in the uppermost 30 cm of the column, whereas sulfate remained in this area in concentrations similar to the initial one, except in the 5 cm closest to the hydration surface, where it decreased. The concentration of all the cations peaked at two different distances from the heater, at between 9 and 11 cm (closer to the heater for Ca2+ and Na+) and at 17 cm from the heater. However, the anions behaved differently; Cl– peaked at just 9 cm from the heater and SO4 2– at 17 cm from it. It is worth mentioning that the concentration peak closest to the heater coincided with the location of sensor RH3 (indicated in the Figures with dotted vertical lines), which was found corroded and not well sealed (Villar et al., Reference Villar, Iglesias and Gutiérrez-Álvarez2022). From this location toward the heater, the concentration of all the ions decreased, reaching minima at 5 cm from the heater, and then increased again. In the case of sulfate, the minimum concentration region spanned from 5 to 13 cm from the heater. In contrast to the rest of the ions, bicarbonate, which was below its initial concentration in most of the column, started to increase at 17 cm from the heater toward it and reached greater values than the initial one in the 5 cm closest to the heater.
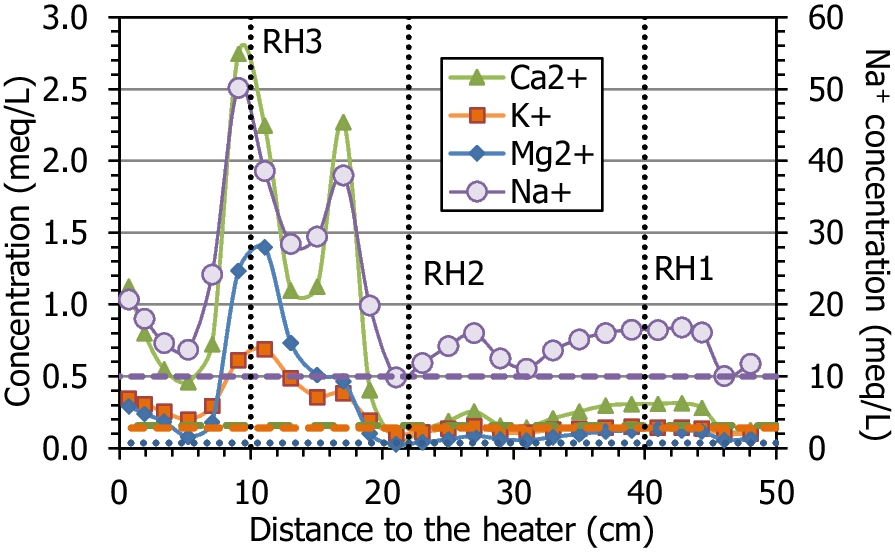
Fig. 10 Main cations measured in aqueous extracts of samples of cell HEE-B (the horizontal lines indicate the concentrations in the untreated pellets and the vertical dotted lines the positions of the sensors)
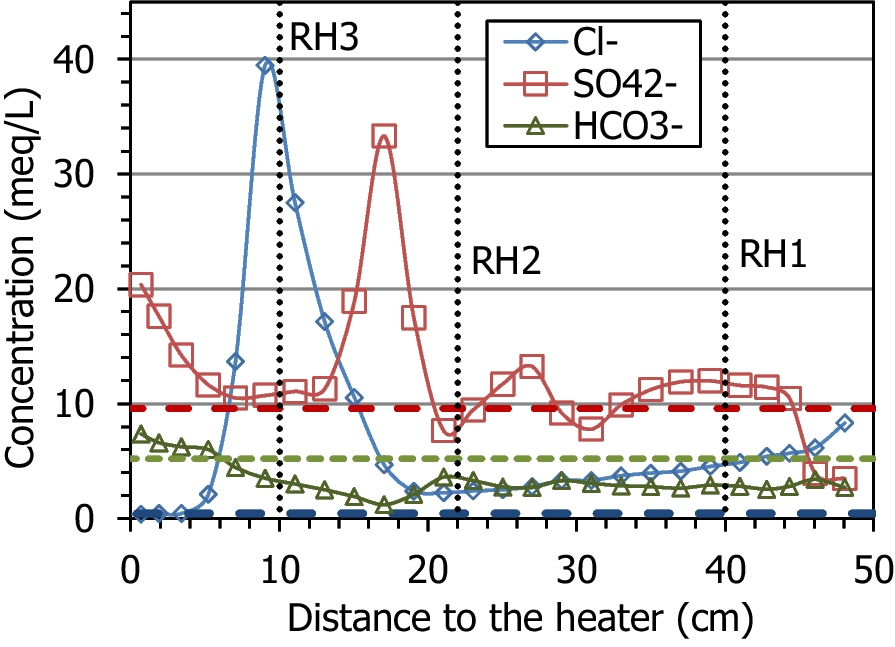
Fig. 11 Main anions measured in aqueous extracts of samples of cell HEE-B (the horizontal lines indicate the concentrations in the untreated pellets and the vertical dotted lines the positions of the sensors)
To counterbalance the huge sodium concentration, chloride and sulfate had to be summed up, because if sodium is presumed to come only from NaCl dissolution, there would be a significant excess of it (except at 9 cm from the heater, Fig. 12). In fact, the balance is slightly improved if not only sodium, but also the rest of the cations (Mg2+, Ca2+, and K+) are considered. However, close to the heater there was an excess of cations (Na+) with respect to sulfate, which were counteracted by inorganic carbon anionic species (bicarbonate in aqueous extracts).
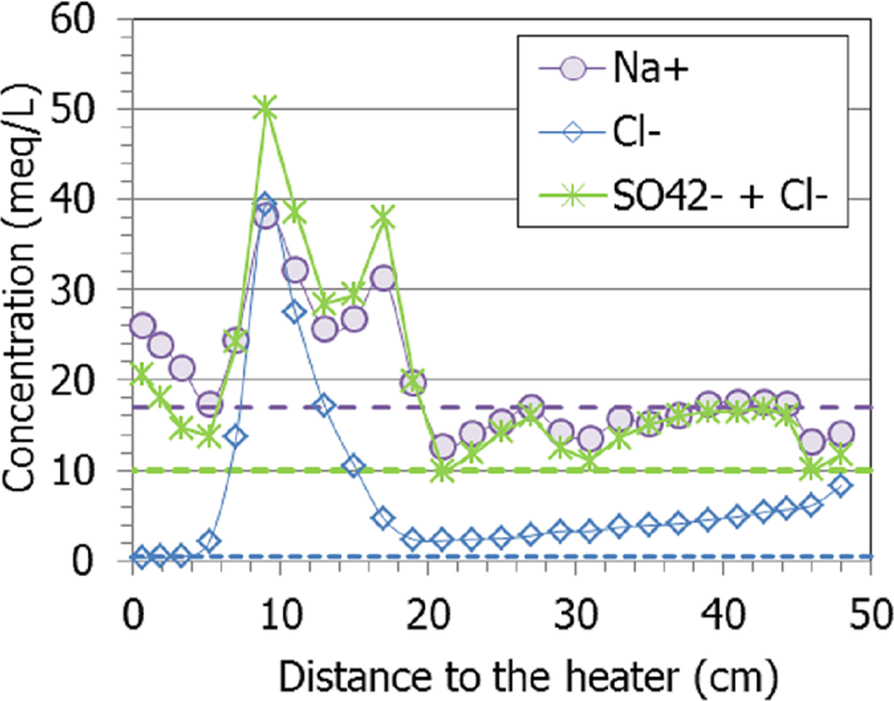
Fig. 12 Concentration of sodium, chloride and sulfate measured in aqueous extracts of samples of cell HEE-B (the horizontal lines indicate the concentrations in the untreated pellets)
In contrast with what was observed in other highly saturated Wyoming-type samples from TH cells (Gómez-Espina & Villar, Reference Gómez-Espina and Villar2016), where the presence of non-filtered colloids was considered responsible for the large contents of Fe3+, Al3+, and Si4+ measured in the aqueous extracts, in the present column no significant amounts of Fe3+ and Al3+ were measured in any sample (although the largest contents were measured in drier samples). The fact that the column was hydrated with a highly saline water would have avoided the formation of colloids. In addition, the amount of aqueous silica was below the initial amount in most of the samples and only increased above it in the 10 cm closest to the heater, peaking at 5 cm (Fig. 13). This could be explained by the dissolution of quartz and cristobalite during the test because of the high temperature in the area (solubility is increased), and the precipitation of Si as amorphous silica during the cooling stage prior to sampling.
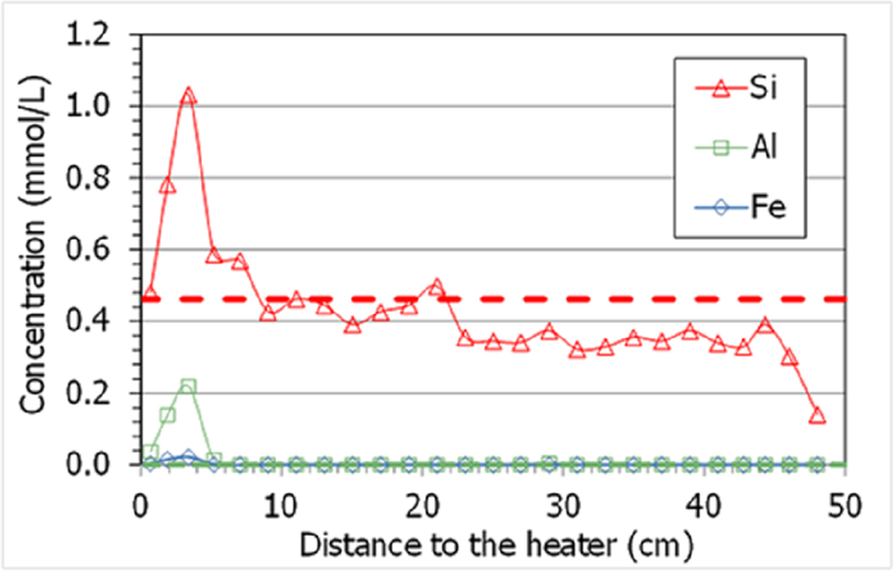
Fig. 13 Concentrations measured in aqueous extracts of samples of cell HEE-B (the horizontal line indicates the aqueous silica concentration in the untreated pellets; the other ions were not detected)
Cation Exchange Capacity and Exchangeable Cations
Because the methodology followed for the extraction of exchangeable cations did not involve prior washing of the samples, both exchangeable and soluble cations were actually measured in the extracts prepared. For this reason, the values obtained corresponded, in fact, to ‘extractable’ cations, in the sense that they may include soluble cations in addition to exchangeable ones. This seems to be particularly the case in the lower half of the column (distances to the heater of <20 cm), where the sum of extractable cations was considerably greater than the CEC value (Fig. 14), and this would indicate that part of the extractable cations in this area were not exchangeable. In fact, the aqueous extracts of samples from this area also showed a significantly greater salinity than that of the initial bentonite (Fig. 10, Fig. 11), as a result of hydration with saline water. Furthermore, the sum of extractable cations even reflected the minimum at 5 cm from the heater observed for the soluble salts (Fig. 10).
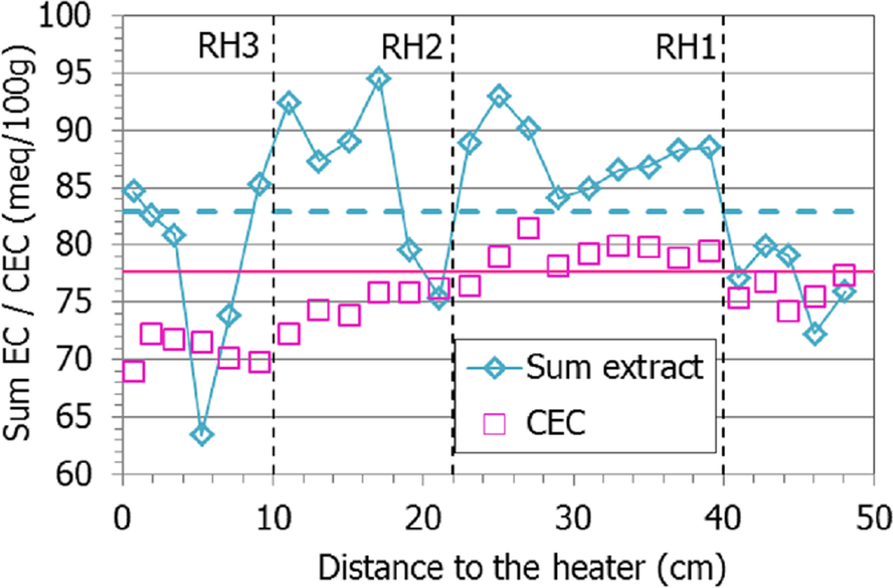
Fig. 14 Sum of extractable cations and CEC along the bentonite column of cell HEE-B (the dotted horizontal lines indicate the initial values)
The extractable calcium, magnesium, and potassium increased globally with respect to the initial values, whereas sodium decreased, particularly toward the column’s ends, which is striking because this was the main cation in the hydration water (Fig. 15). Nevertheless, it remained the main extractable cation in all the samples. The extractable magnesium content was greater than the initial one in the 20 cm closest to the hydration surface, and then peaked at between 10 and 15 cm from the heater, along with potassium. In contrast, the extractable calcium was approximately constant in the upper part of the column and at ~20 cm from the heater started to increase toward it.
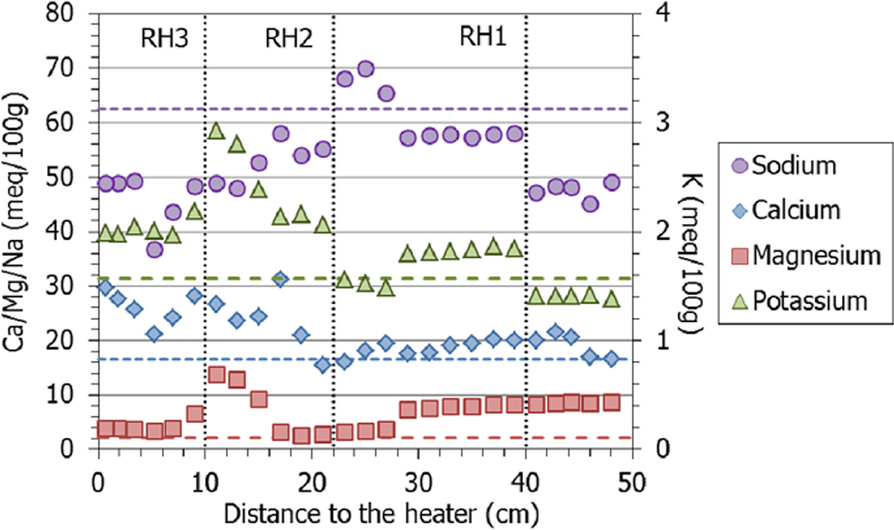
Fig. 15 Main extractable cations along the bentonite column of cell HEE-B (the horizontal lines indicate the concentrations in the untreated pellets and the vertical dotted lines correspond to the positions of the sensors)
Discussion
The methods used for the postmortem mineralogical and geochemical characterization of the samples provided information about different aspects combined interpretation of which clarifies some observations and supports their interpretation.
Mineralogy
Concerning the final mineralogical compositions of the bentonite, XRD showed that all the samples were composed predominantly of dioctahedral smectite. This was confirmed by the chemical composition obtained by XRF of the <0.5-µm fraction and by numerous localized analyses performed in clay-dominated areas by SEM–EDX. Smectite showed a remarkable structural stability supported by the constancy of dehydroxylation temperatures recorded by TGA, in agreement with the constancy of layer charge magnitude and distribution and NMR measurements for all samples. The smectite is actually a montmorillonite, maintaining its composition along the column independent of the temperature during operation, hydration degree reached, or salt concentration in specific zones. This is a remarkable difference with respect to other studies such as the Alternative Buffer Materials (ABM) – a project in which parcels of different clay minerals, MX-80 among them, were exposed to heater temperature of 130°C – in which trioctahedral clays were formed (Kaufhold et al., Reference Kaufhold, Dohrmann, Sandén, Sellin and Svensson2013; Svensson, Reference Svensson2015).
Cristobalite and quartz were also present as accessory minerals in this fine fraction, correlated with the presence of small amounts of a micaceous illite-like accessory mineral phase. This illite cannot be coupled with mixed-layer formation, as the smectite expanded regularly upon EG solvation without signs of alteration. Then, its detection was not considered an indication of alteration and was attributed to the decrease in the size of the illite-like aggregates contained in the original pellets.
Although pyrite was observed by SEM in several locations along the bentonite column (but not close to the heater), it cannot be related to precipitation under reducing conditions because it is an accessory mineral of the untreated bentonite (e.g. Kumar et al., Reference Kumar, Podlech, Grathoff, Warr and Svensson2021; Valter & Plotze, Reference Valter and Plötze2013).
Cation Exchange Complex
As for the exchangeable cation complex, its population could be assessed using results obtained with different techniques: XRD, TGA, the localized structural formula calculations by SEM–EDX, and direct measurement after displacement with Cs.
– X-ray diffraction of the bulk samples showed basal spacings corresponding to predominantly monovalent exchangeable complexes, with values <1.3 nm, tending to decrease toward the heater. The deconvolution of the random powder XRD patterns showed a contribution of divalent cations in the areas at >10 cm from the heater, where the value of the main basal spacing was clearly greater (Fig. 2, Fig. 3).
– The TGA results, with dehydration temperatures at 54°C, also pointed to sodium as the main exchangeable cation, particularly nearer the heater. In the middle part of the column the dehydration temperatures were higher, indicating a more divalent cation occupancy in the exchange complex (Caglar et al., Reference Caglar, Afsin, Tabak and Eren2009).
– Consistently, the structural formulae calculated from SEM–EDX showed a predominance of Na as the exchangeable cation.
These observations could be related to the replacement of cations in the original exchange complex (in which Na predominates, but also Ca and Mg are included) by the sodium coming with the hydrating saline water.
Remarkably, however, the basal reflections of the smectite in the oriented aggregates pointed to the presence of divalent cations in the interlayer space (~1.4 nm). During the preparation of suspensions, some soluble species are generally expected to be dissolved, and the liberated cations may replace others in the interlayer according to the differences in adsorption selectivity influenced by the cation distribution itself (Tournassat et al., Reference Tournassat, Gailhanou, Crouzet, Braibant, Gautier and Gaucher2009, Reference Tournassat, Bizi, Braibant and Crouzet2011). During the preparation of the oriented aggregates, therefore, some species (gypsum) could be dissolved and the Ca released could substitute for Na in the interlayer. Even though the random powders showed basal spacings corresponding to predominantly monovalent exchangeable complexes, dissolution during sample preparation could be the reason why the oriented aggregates presented larger spacings corresponding to predominantly divalent smectites (although with a bimodal reflection that evinced the presence of both types of cations). However, this explanation is not obvious for the samples near the hydration source, where gypsum was scarce. In the area at 2 cm from the heater, calcite was clearly detected, and this would be a potential calcium source during the preparation of the oriented aggregates of samples from the hottest area.
The exchange of Na by Ca during suspension would also have occurred in the samples prepared for the determination of the exchangeable complex by Cs displacement, and could explain the smaller amount of extractable sodium measured in the drier samples, where calcium sulfates (and carbonates) dissolved during sample preparation would have been present (as shown by SEM observations). Hence, this distribution pattern would not reflect the actual distribution during the test. Nevertheless, the exchangeable cation complex determined showed the predominance at the end of the test of sodium in the interlayer, in agreement with the population in the initial bentonite and the large sodium concentration of the hydration solution. At 10 cm from the heater, the exchangeable magnesium (and potassium) content peaked, but the increase did not progress toward the heater, so maybe it was more related to the accidental evaporation at this level than to temperature. The fact that this cell was hydrated with a highly saline water may also have affected the kind and magnitude of interlayer changes.
The CEC decreased slightly toward the heater. This was not reflected in the evolution of the montmorillonite structural formula and its calcium content along the column, with the exception of the perturbation at 10 cm (Fig. S1, left), with the increase in Ca and Mg (Fig. S1, right). The decrease in CEC, therefore, has no obvious explanation, although this phenomenon has been observed systematically in other bentonite heating experiments (Dohrmann & Kaufhold, Reference Dohrmann and Kaufhold2017; Gómez-Espina & Villar, Reference Gómez-Espina and Villar2016; Kaufhold et al., Reference Kaufhold, Dohrmann, Götze and Svensson2017; Villar, Reference Villar2017). In contrast to the generalized reduction of CEC observed in those tests, in the present column the CEC decreased only in the warmer areas. Dehydration and the decrease in surface area as a result of aggregation and formation of dense aggregates have been argued as possible explanations. In turn, these processes could lead to a decrease in some surface positions for cation exchange. Heuser et al. (Reference Heuser, Weber, Stanjek, Chen, Jordan, Schmahl and Natzeck2014) observed that steam treatment on different bentonites reduced CEC, especially in monovalent (Na, K) specimens compared to divalent bentonites. Considering that full rehydration of these samples was achieved during the continuous batch steps for calcium saturation of the montmorillonite (Fig. 4), the CEC could possibly also have been recovered, which should be tested in the future. Another explanation for the CEC decrease would be the smectite alteration, but the results of this research do not point to significant changes in its crystal chemistry.
Movement of Soluble Species
Other similar heating-hydration tests showed that hydration caused the dissolution of some species and that the solubilized ions were transported toward the heater and precipitated further away along the bentonite column as the test went on (Fernández & Villar, Reference Fernández and Villar2010; Gómez-Espina & Villar, Reference Gómez-Espina and Villar2016; Kober et al., Reference Kober, García-Siñeriz, Villar, Lanyon, Cloet, Mäder, Wersin, Leupin, Sellin, Gens and Schneeberger2021). Those tests also showed that, for a given duration, the chloride concentration in the aqueous extracts peaked closer to the heater than the sulfate one, given their different size and the implication of sulfate in other dissolution/precipitation processes. Indeed, sulfate peaked in the present test at ~18 cm from the heater, where the temperature during the test was 40°C, whereas the chloride maximum was at 9 cm from it (T ≈ 60°C), approximately at the location of sensor RH3 (Fig. 11). Interestingly, the calcium and sodium concentrations had maxima at these two distances, so they must be related both to sulfate and chloride. In fact, gypsum solubility increased in the presence of dissolved NaCl and had its maximum at ~40°C (0.05 mol/kg at 1–5 M NaCl, Marshall & Slusher, Reference Marshall and Slusher1966), which was the temperature at ~18 cm from the heater, where the maxima of the two ions were recorded. The high salinity in these areas probably triggered the corrosion of the sensors, particularly the bottom one (Villar et al., Reference Villar, Iglesias and Gutiérrez-Álvarez2022).
The pattern of gypsum distribution as observed by XRD would indicate that sulfate leaching took place. In the more hydrated bentonite, gypsum could not be detected, which could indicate its dissolution and transport. In fact, gypsum appeared in the region between 10 and 30 cm from the heater, where its solubility would tend to decrease because of the progressively higher temperature (Table 2), between 40°C, close to its maximum solubility, and 60°C, close to an anhydrite-dominatedenvironment. Hence, it would precipitate or be replaced by the less soluble anhydrite (Marshall & Slusher, Reference Marshall and Slusher1966; Serafeimidis & Anagnostou, Reference Serafeimidis and Anagnostou2015). In fact, SEM observations revealed occasional calcium sulfates close to the heater (presumably anhydrite traces that were not possible to detect by XRD). In the 10 cm closest to the heater (temperatures >60°C), gypsum was again absent. The sulfate concentration in the aqueous extracts, however, was greater than the initial one in this area, tending to increase toward the heater. Olsson and Karnland (Reference Olsson and Karnland2011) reported in the large-scale LOT project a redistribution of Ca-sulfate phases. Their results indicated that gypsum dissolution occurred in the colder part of the bentonite barrier at the host-rock contact and anhydrite precipitated in the bentonite close to the heater within ~6 y. These observations were reproduced by modeling (Itälä & Olin, Reference Itälä and Olin2011). In the LOT A3 parcel, with MX-80 bentonite submitted for 10 years to heater temperatures of 120–150°C, significant anhydrite accumulation at <2 cm from the heater was found (reported by Villar et al., Reference Villar, Armand, Conil, de Lesquen, Herold, Simo, Mayor, Dizier, Li, Chen, Leupin, Niskanen, Bailey, Thompson, Svensson, Sellin and Hausmannova2020). Anhydrite accumulations in the bentonite close to the heater were reported by Dueck et al. (Reference Dueck, Johannesson, Kristensson, Olsson and Sjöland2011) for the in situ large-scale Canister Retrieval Test and by Kaufhold et al. (Reference Kaufhold, Dohrmann, Götze and Svensson2017) in the ABM-2 in situ test, where the peak temperatures at the heater surface were 140°C.
The increase of bicarbonate in the aqueous extracts near the heater zone may relate to the observed presence of calcite and its dissolution during the preparation of the aqueous extracts. The observation of carbon-rich fill in the cavities could indicate the evolution of a gas phase either with carbon coming from the steel heater or CO2 appearing as a co-product of the evaporation of the salty solutions produced at ~10 cm from the heater. CO2 degassing was invoked to explain calcite precipitation in similar TH tests (Fernández & Villar, Reference Fernández and Villar2010). Calcite was not detected close to the hydration surface and the bicarbonate content was small in this area. In contrast, the analysis of the water left in the hydration vessel after the test (Table 1) showed a significant decrease in calcium and an increase in bicarbonate content relative to the initial value. Both observations could be related to the dissolution of calcite in the more hydrated area, the diffusion of bicarbonate toward the hydration source, and the incorporation of the calcium released to the exchangeable complex substituting for sodium.
The high temperature in the 5 cm closest to the heater could also have caused the dissolution of quartz and cristobalite inferred from the results in Fig. 13 (Tester et al., Reference Tester, Worley, Robinson, Grigsby and Feerer1994). Svensson and Hansen (Reference Svensson and Hansen2013) and Kaufhold et al. (Reference Kaufhold, Dohrmann, Sandén, Sellin and Svensson2013) observed cristobalite dissolution in large-scale tests performed with MX-80 bentonite at locations where the temperature was between 130 and 150°C. The relatively high extractable silica in this zone (Fig. 13) could be related to the presence of amorphous silica, more soluble than quartz (Gunnarsson & Arnórsson, Reference Gunnarsson and Arnórsson2000) and not easily detected by XRD due to its small amount. It must be pointed out that, although vapor clearly leaked through the bottom sensor inlet, this did not happen from the beginning of the test, and during an undetermined period of time (which may have been long), liquid water was probably able to reach areas closer to the heater than the level of the sensor location. In fact, the distribution pattern of soluble ions (Figs. 10, 11, and also that for extractable cations in Fig. 14) shows minimum values at 5 cm from the heater followed by a progressive increase toward it, with overall values in the area higher than the initial ones. This would indicate that water loaded with soluble species was able to reach the area at <10 cm from the heater, and when this water supply stopped as a consequence of the vapor leak, the accumulated salts redistributed by convection-concentration processes.
Effects of Accidental Evaporation
Halite was observed at 10 cm from the heater (sample S20) by XRD and its presence was confirmed by SEM observations. Instead of the usual small cubic or dendritic crystallizations, halite presented undifferentiated morphologies, like rounded glassy efflorescences in which also Ca was detected by EDX (Fig. 9). Sub-millimetric rounded morphologies were prepared by evaporation at 58°C in industrial processes looking for crystal growth inhibition (Mukhopadhyay et al., Reference Mukhopadhyay, Mohandas, Desale, Chaudhary and Ghosh2010), and subhedral rounded morphologies were reported for naturally induced weathering of polyelectrolyte salt brines (Rodriguez-Navarro & Doehne, Reference Rodriguez-Navarro and Doehne1999). This agrees with the large sodium (and Ca, Fig. 10) and chloride contents measured in the aqueous extracts of this region. The hypothesis is that CaCl2 deliquescent salt could take part in the crystallization inhibition during evaporation, although this aspect required further elucidation. Sample S20 was taken at the same distance from the heater at which sensor RH3 was located. This sensor was extracted completely corroded at the end of the test (Villar et al., Reference Villar, Iglesias and Gutiérrez-Álvarez2022). The inlet of this sensor across the Teflon cell wall was probably a leak path which commenced at an undetermined point during the operation, allowing vapor to escape and creating an area of evaporation around it. From this point toward the heater, the bentonite was disaggregated and the water content was smaller than the initial one (Table 2). From this point toward the heater (temperatures >60°C), the rehydration of the bentonite at room conditions was more difficult (Fig. 3). In the nearby sample S19, the amounts of exchangeable magnesium and potassium reached maxima (Fig. 15). The accidental evaporation through the sensor inlet, thus, seems to have allowed particular conditions that significantly affected the processes in this area.
The samples that had been submitted to temperatures >60°C (those at <9 cm from the heater) were not able to completely develop the 1-layer hydrate after 48 h of stabilization at RH 55% and they even showed the reflection corresponding to the completely dehydrated interlayer (Fig. 2). These rather small d 001 values for monovalent hydrates in smectite were predicted for RH conditions <5% by the modeling of hydrates in Na-smectite by Dazas et al. (Reference Dazas, Lanson, Delville, Robert, Komarneni, Michot and Ferrage2015) and Ferrage et al. (Reference Ferrage, Lanson, Michot and Robert2010). However, this was not seen in the oriented aggregates, because they were performed using water-suspended samples, completely hydrated before being dried at room conditions once on the glass tile. Valter and Plötze (Reference Valter and Plötze2013) also observed a decrease in the water vapor adsorption capacity (under RH = 75%) of MX-80 bentonite with degrees of saturation of <50% treated for 12–18 months under hermetic conditions at temperatures >105°C. However, after remolding with water, the water adsorption capacity recovered to the same values as for pristine material. The authors considered that the ability to recover by mechanical remolding could point to cementing processes during the thermal treatment. Additional tests performed with samples from the HE-E column (Villar et al., Reference Villar, Cuevas, Melón, Zabala, Gutiérrez-Álvarez, Ruiz, Ortega, Iglesias, González, Brea and Real2023) showed that un-remolded samples taken close to the heater were able to take as much water as the untreated pellets under a relative humidity of 97%, whereas they took less water under room RH conditions, irrespective of the reaction time. This would indicate that the rehydration capacity of the bentonite was completely recovered when the relative humidity was high or hydration with liquid water was involved.
Conclusions
The mineralogical and geochemical changes in a granular buffer material made of pellets of Wyoming-type bentonite as a result of almost 10 years of hydration under thermal gradient were reported. The aim of the work was to contribute to the understanding of the behavior of this kind of engineered barrier, particularly concerning the effect of prolonged heating on its properties. Several factors confer novelty to this research with respect to previous similar lab and in situ experiments: the material used (pelletized bentonite), the high salinity of the hydration water, the high temperature of the heater simulating the waste canister (140°C), and the long duration of the experiment.
At the end of the test all the samples continued to consist predominantly of a dioctahedral smectite, with no significant differences from the original with respect to the distribution of structural cations and layer charge. No evidence of mixed-layer formation was detected. Sodium continued to predominate in the exchangeable cation complex (according to the measurement of the basal spacing, thermogravimetry, and Cs displacement results), probably as a consequence of the hydration with a predominantly sodic solution (also containing calcium and magnesium). However, some contribution of divalent cations toward the hydration surface could be detected.
Despite the lack of montmorillonite alteration at the structural level, the drier samples, those that were submitted to temperatures >60°C, remarkably had a significant resistance to rehydration under room relative humidity conditions. However, this was not an irreversible process, as the samples hydrated and expanded normally when suspended in water.
Although hydration took place with a highly saline water – which seems to have inhibited the formation of colloids – the overall increase in water content allowed the dissolution of some species and the solubilized ions were transported toward the heater and precipitated at two distinct areas: sulfate, sodium, and calcium peaked at ~18 cm from the heater whereas chloride moved closer to the heater (accompanied by sodium and calcium), concentrating at 9 cm from it, coinciding with a vapor-leak area. This leak started at some undetermined moment during the test through a sensor inlet. This experimental artifact seems to have conditioned the processes around it, such as the movement of solubilized ions. The liquid–water availability was probably affected also in the areas of temperatures >60°C, which would limit the reactivity there. Nevertheless, evidence of precipitation of calcite and calcium sulfates and dissolution of cristobalite and quartz were observed in the areas where the temperature was >100°C.
Overall, the processes described are similar to those observed in other large-scale tests simulating the conditions of a bentonite barrier with temperatures >100ºC. Hence, they would not be affected by the use of pellets or compacted blocks.
Supplementary Information
The online version contains supplementary material available at https://doi.org/10.1007/s42860-023-00238-4.
Acknowledgements
The research leading to these results was performed in the framework of the EURAD project – WP7 HITEC (http://www.ejp-eurad.eu/), which receives funding from the European Union’s Horizon 2020 Research and Innovation Programme under grant agreement No 847593. The laboratory work was carried out at CIEMAT’s facilities by A.E. González.
Authors' Contributions
Villar: conceptualization, formal analysis, investigation, writing, visualization, editing, supervision
Cuevas: conceptualization, formal analysis, investigation, writing, visualization, editing, supervision
Zabala: formal analysis, investigation, resources, visualization, review
Ortega: formal analysis, resources, visualization
Melon: formal analysis, resources, visualization
Ruiz: formal analysis, resources, visualization
Iglesias: formal analysis, resources, visualization
Funding
Open Access funding provided thanks to the CRUE-CSIC agreement with Springer Nature. European Union’s Horizon 2020 Research and Innovation Programme under grant agreement No 847593.
Data Availability
Data available upon reasonable request.
Code Availability
Not applicable.
Declarations
Conflicts of Interest/Competing Interests
The authors declare they have no financial interests or any other conflict of interest.


 Open access