
Abstract
In this contribution, we report the development of in situ electrochemical cells based on proton exchange membranes suitable for studying interfacial structural dynamics of energy materials under operation by near ambient pressure X-ray photoelectron spectroscopy. We will present both the first design of a batch-type two-electrode cell prototype and the improvements attained with a continuous flow three-electrode cell. Examples of both sputtered metal films and carbon-supported metal nanostructures are included demonstrating the high flexibility of the cells to study energy materials. Our immediate focus was on the study of the oxygen evolution reaction, however, the methods described herein can be broadly applied to reactions relevant in energy conversion and storage devices.
1 Introduction
Renewable energy storage and conversion technologies rely on the availability of materials able to catalyse, electrochemically or photo-electrochemically activated, hydrogenation and dehydrogenation reactions of small molecules at potentials as close as possible to the corresponding thermodynamic potential [1, 2]. Most of the commonly investigated redox systems are inspired by the energy cycles occurring in nature: (1) the oxygen redox cycle (O2/H2O), (2) the nitrogen redox cycle (N2/NH3), and (3) the carbon redox cycle (CO2/CxHyOz). Whilst literature on these topics is flourishing [1,2,3], no satisfactory materials have been found to provide the decisive boost for these technologies. The major challenges to face are common to the three systems: (1) reducing material costs, (2) improving the energy efficiencies to practical levels, and (3) reducing material degradation during operation. A thorough understanding of the underlying mechanisms is generally acknowledged to guide towards the synthesis of improved materials. In this respect, for electrochemical processes the understanding of the restructuring and compositional change of the electrode surface upon polarization, activation, and deactivation is especially important. This knowledge can be attained via surface-sensitive in situ spectroscopic techniques that investigate the electronic structure at surfaces and interfaces.
Synchrotron-based soft X-ray photoelectron and absorption spectroscopies are striking methodologies to serve this purpose. Traditionally a vacuum technique, X-ray photoelectron spectroscopy (XPS) nowadays is an established tool for investigating the gas–solid interface. In its “high pressure” configuration, the technique is generally referred to as (near) ambient pressure XPS (NAP-XPS), where near ambient means a working pressure of up to a few millibars [4]. Compared to ex situ, UHV-based XPS [5], NAP-XPS can help to establish more robust structure–function correlations by simultaneously monitoring changes in (1) the electronic structure of the working catalyst, (2) the nature of the adsorbed reactant molecules, and (3) the nature of the products formed at pressures close to relevant conditions. The application of this technique to increasingly important energy-related electrochemical processes is currently pursued at synchrotrons worldwide, with pioneering work at ALS (Berkeley) [6,7,8,9], BESSY II/HZB (Berlin) [10,11,12,13,14,15], and SSRL (Stanford) [16,17,18].
Studying electrochemical processes by NAP-XPS requires the development of adapted in situ electrochemical cells. In the last decade the progress in this field has been gigantic and we will now briefly provide a non-exhaustive list of proposed approaches. Depending on the type of synchrotron radiation employed, different methodologies have been put forward: The research using soft X-rays initially was focused on cells using solid oxide electrolytes [6, 19, 20] as well as on room [10, 16, 17] and higher [11] temperature proton exchange membrane (PEM)-based electrode assemblies in (wet) gaseous atmospheres. To investigate electrochemical reactions in liquid electrolytes by soft X-ray spectroscopies, an alternative approach uses electron-transparent graphene membranes to separate the liquid reaction environment from the vacuum section of the analysis chamber [13, 21]. In the tender X-ray regime, the excited photoelectrons have higher inelastic mean free paths (IMFP) and can penetrate thin matter: In the “dip & pull” technique, photoelectrons are analyzed after penetrating a thin film of liquid electrolyte formed on a metal electrode [7,8,9]. Since photoelectrons excited by tender X-rays can penetrate ultra-thin Si membranes, in yet another approach these membranes are used to separate the liquid solution from the evacuated analyzer chamber [22]. Recently, also hard X-ray-based NAP-XPS generating photoelectrons with even higher IMFPs has been successfully employed for PEM-systems [23]. Finally, liquid jet approaches can be used to study polarized interfaces [24].
Herein, we will focus on PEM-based systems to study water electrolysis with a focus on the oxygen evolution reaction (OER). Due to their practical handling and high potential for implementation in the current electricity infrastructure [25], PEM-based systems have attracted major interest from industry. From the point of view of studying PEM-based electrolyzers or fuel cells by soft X-ray-based NAP-XPS, they present the complication that a high degree of hydration of the PEM is required to enable the device, which is hardly achievable with standard NAP-XPS. To overcome this limitation, we have developed dedicated in situ electrochemical cells to study water electrolysis at the ISISS (Innovative Station for In Situ Spectroscopy) beam line (HZB/BESSY II) in Berlin. We aim to provide here a detailed assay on the experiments performed and the spectroscopic results obtained throughout the entire process of engineering optimization of these in situ electrochemical cells. We will further discuss how these experiments have helped us to probe the working oxidation states of both anions and cations in Pt- and Ir-based electrodes during the OER.
2 Experimental
2.1 Proton Exchange Membrane Activation
PEMs are commonly used as semi-permeable electrolytes in fuel cells or electrolyzers [25]. These acidic membranes conduct protons and, while they let water diffuse, they hinder the passage of gases like O2 and H2. In the present contribution, such PEMs were used as membranes between liquids and an evacuated XPS and NEXAFS (near-edge X-ray absorption fine structure) measurement chamber and simultaneously served as electrolytes for a water electrolyzer system. To investigate reactions in basic environments, the use of anion exchange membranes could be considered. In all experiments presented herein, Nafion® 117 ionomers from AlfaAesar (Thermo Fischer Scientific, Karlsruhe, Germany) were employed as PEMs. Nafion® 117 consists of a polytetrafluoroethylene (PTFE) backbone and regularly spaced perfluorovinyl ether pendant side chains, which are terminated by sulfonate ionic end groups (C7HF13O5S·C2F4, see Fig. 1a) [26, 27]. Only when well hydrated, Nafion® 117 is interspersed with channels that enable proton transport as schematically shown in Fig. 1b [26, 28].

b Schematic representation of Nafion® with proton-conducting channels, adapted from [28]
a Chemical formula of Nafion® ionomer with PTFE backbone (brown) and sulfonate acid-terminated side chains (purple).
To enable the proton conductivity of Nafion® 117, the commercially obtained membranes need to be activated in a two-step process. In the pretreatment step, the membranes were purified from organic contaminants for 2 h at 80 °C in a stirred solution of 3 vol% H2O2, which was prepared from 30% H2O2 ROTIPURAN® (Carl Roth, Germany) and ultra-pure Milli-Q water (18.2 MΩ). In the activation step, the membranes were stirred for 2 h at 80 °C in 0.5 M H2SO4, which was prepared from H2SO4 EMSURE®, 95–97% (Merck KGaA, Darmstadt, Germany) and ultra-pure Milli-Q water. After each step, the membranes were rinsed with ultra-pure Milli-Q water. This activation procedure yields proton-terminated sulfonate ionic end groups, which enable the proton conductivity of Nafion® 117 when hydrated. After the activation, the membranes were dried and stored between clean filter paper.
2.2 Sample Deposition
The investigated materials were either sputter-deposited directly onto activated and dried Nafion® 117 membranes or electrodeposited on carbon paper (Toray™ Carbon paper TGP-H-030, FuelCellStore.com). Other techniques that could be used to deposit electroactive materials onto the PEMs include drop-casting, spin-coating, wet transfer etc. For the sputter-deposition, we used metallic targets (Ir 99.99%, Pt 99.99% and bimetallic Pt 80%/Pd 20%, Elektronen-Optik-Service GmbH, Dortmund, Germany) in a Cressington 208HR sputter coater. The metallic films were deposited in 0.1 mbar Ar atmosphere at a DC current of 40 mA. Depending on the material and the desired film thickness, deposition times ranged from 60 to 300 s. For the electrodeposition, we used a three-electrode setup controlled by a VSP potentiostat (Bio-Logic Science Instruments SAS, France) with a platinized Pt wire counter electrode (CE) and a saturated calomel (SCE) reference electrode (RE). The carbon paper working electrode (WE) was polarized at the respective deposition potential until the desired mass loading was achieved. Details of the deposition steps are given in the respective manuscript sections.
2.3 Scanning/Transmission Electron Microscopy
The morphology of the deposited films was investigated in a scanning electron microscope (SEM) Hitachi S-4800 FEG equipped with a Bruker XFlash detector. Images were taken in both secondary electron (SE) and backscattered electron (BSE) modes with acceleration voltages of 1.5 kV and 15 kV. The nanostructure of the films was assessed using a transmission electron microscope (TEM) FEI TITAN 80-300 with an acceleration voltage of 200 kV.
2.4 In Situ Photoemission and Absorption Measurements
The NAP-XPS end station at the ISISS beam line of the synchrotron radiation facility BESSY II/HZB (Berlin, Germany) served for all in situ photoelectron and absorption measurements presented herein. The system has been described in detail elsewhere [29]. In a recent upgrade, the end station has been modularized. While the lens system with the differential pumping stages and the spectrometer remain fixed, different types of reaction chamber module can be attached to the system. These exchangeable modules are specialized for categories of investigations (e.g. electrochemistry or heterogeneous oxidation catalysis) and prevent cross-contamination between different types of experiment. The dedicated electrochemistry module (EC-module) is shown in Fig. 2. The EC-module was constructed such that wet electrochemical reactions can be studied in situ by XPS and NEXAFS. The EC-module is compatible with different types of electrochemical reaction cell, two of which, namely a two- and a three-electrode cell, will be described in detail below. These cells were used to study the electronic structure of oxygen-evolving electrodes. Furthermore, the EC-module is equipped with a mass flow controller (MFC)-regulated gas inlet system through which additional reactive gases can be dosed into the measurement compartment. For gas analytics, the EC-module features a quadrupole mass spectrometer (QMS, Prisma, Pfeiffer, Vacuum, Inc., Germany). Using mass spectrometry, gases evolved at the working electrode can be detected online.

a Construction model and b photograph of the electrochemistry module (EC-module) compatible with the NAP-XPS end station at the ISISS beamline at BESSY II/HZB. The photograph in b shows in addition to the EC-module the rack with the syringe pump for the continuous electrolyte supply and the external potentiostat to polarize the working electrode
Polarization of the cell electrodes was achieved via an external connection of the cells to a modular research grade potentiostat (SP-300, Bio-Logic Science Instruments SAS, France). For the two-electrode cell, the potentiostat was operated in floating mode and the counter electrode of the cell was grounded via the contact of the stainless steel cell body and the spectrometer. The connection between the CE and the spectrometer aligns the Fermi levels of the materials. Hence, when the WE is polarized with respect to the CE, the actual applied potential can be read off by the observed binding energy shift of the XPS core levels. For the three-electrode setup, the potentiostat was used in grounded mode. The reference electrode of the three-electrode cell was a Ag/AgCl micro RE (DRIREF-2SH, World Precision Instruments, USA). The continuous supply of liquid into the three-electrode cell was achieved through PEEK tubing (1/8 inch outer diameter, 1/16 inch inner diameter, Sigma-Aldrich) that connected the cell to an outside Teledyne ISCO 260D syringe pump. The syringe pump was used to supply the electrolyte at a constant flow rate of 1 ml/min. All electrolytes filled into the cells were based on ultra-pure Milli-Q water. For the preparation of 0.1 M H2SO4, we used H2SO4 EMSURE®, 95–97%, Merck KGaA, Darmstadt, Germany.
All in situ XPS and NEXAFS measurements were collected at room temperature. The focus size of the beam line, i.e. the illuminated area of the electrode, was 150 µm × 80 µm (horizontal × vertical). While XPS measurements probe occupied electronic states, NEXAFS measurements probe unoccupied electronic states.
For all XPS measurements, we used an exit slit setting of the beam line of 111 µm. In this work, depending on the chosen pass and excitation energies, the corresponding resolution was between 0.2 and 0.8 eV, with lower excitation and pass energies yielding higher resolutions. Core lines of the different materials were measured in surface-sensitive modes of different information depths. In the most surface-sensitive mode, the information depth is below 1 nm. The exact measurement conditions will be detailed in the respective manuscript sections. All spectra were calibrated by measuring the Fermi edge after each core level scan and a corresponding rigid shift of the core levels, which is especially suitable for metallic samples.
For all O K-edge NEXAFS measurements, the photon energy was smoothly varied across the absorption edge by a continuous movement of the monochromator. Usually, both Auger and total electron yield (AEY and TEY) were collected. The AEY can be measured via the electron spectrometer at a fixed KE of the registered electrons. We used a KE of 385 eV to partly suppress the contribution of gas-phase oxygen and water [30]. For the Mn L-edges, we used a KE of 500 eV. The used pass energy and further measurement details will be given in the respective manuscript sections. For the TEY collection, we used the Faraday cup of the first aperture of the differential pumping system and applied an accelerating voltage. In general, the probing depths of NEXAFS measurements are slightly higher than those of XPS measurements (AEY: 2–3 nm, TEY: 5–10 nm) [31].
3 Two-Electrode Cell with Reservoir for Liquid [10]
The two-electrode cell primarily designed for the in situ investigation of electrode surfaces during the oxygen evolution reaction (OER) is shown in Fig. 3a. The cell is composed of two core parts: the cell body and the lid. The cell body presents a recess area with a cylindrical cavity, which serves as reservoir for liquid water. The lid fixes an electrode assembly based on a Nafion® PEM onto the cell body. The counter and working electrode materials are applied onto either side of the PEM, e.g. by sputter-deposition, drop-casting, or physically attached porous carbon paper. Electrical contact of the WE and CE to the external potentiostat and grounding of the CE to the spectrometer is achieved through respectively connected sapphire screws. The leak-tightness of the cell is realized through O-rings. The direct contact of the membrane with the liquid water in the reservoir assures the needed hydration of the membrane for achieving good ion conductivity. Mounted onto a standard sapphire sample holder, this in situ cell can be introduced into the NAP-XPS end station at the ISISS beam line at BESSY II/HZB [29]. The working principle of this cell is based on the water permeability of both the PEM and the employed electrode materials as illustrated in Fig. 3b: Due to the pressure difference between the liquid inside the cell body (1 bar) and the evacuated XPS chamber (0.01–0.1 mbar), water diffuses from the inner reservoir through the water permeable electrode assembly into the NAP-XPS chamber. Thereby, the electrode exposed to photons through an aperture in the lid is supplied with the reactant molecules. The electrode directly in contact with the liquid water functions as the CE, whereas the electrode exposed to photons is the WE. By applying chronoamperometry (CA) to the electrode system, this cell can be used to study oxygen-evolving surfaces in situ by XPS and NEXAFS.

b Reproduced with permission from John Wiley and Sons Ltd. from Ref. [10]
a Construction model of the batch-type two-electrode cell for in situ X-ray photoelectron and absorption spectroscopy investigations mounted on a sapphire sample holder. During assembly, first the water regulator and the proton exchange membrane (PEM) with the working and counter electrode (WE and CE) are fixed on the cell body via the lid. Second, the cylindrical cavity is filled with liquid from the rear and subsequently closed with the plug. Finally, the cell body and lid are fixed onto the sapphire via the sapphire screws. b Schematic representation of the cell’s working principle. The zoomed region illustrates that due to the pressure difference between the inner reservoir and the evacuated measurement chamber and due to the porosity of the WE and CE films, the liquid diffuses from the reservoir through the membrane, thereby opening the membrane channels, into the measurement chamber, where it generates a water pressure in the mbar range.
This cell was first used to investigate the reactivity of sputtered Pt films as reported by Arrigo et al. in a previous publication [10]. To ensure the functionality of the cell system, we initially thoroughly characterized its components. Water permeability is achieved since Pt films sputter-deposited on Nafion® have a mud-crack type structure (see Fig. 4a). Electrical conductivity is attained since the Pt films are composed of interconnected nanoparticles (see Fig. 4b). Particularly in these experiments, the Pt film was approximately 50 nm thick. Thinner metal layers did not always result in a continuous film and some regions were found electrically disconnected by XPS. Representative high-resolution transmission electron micrographs (TEM) of the Pt film on the Nafion® before and after the in situ experiment are reported in Fig. 4b, c, respectively. In these TEM images, the characteristic morphology of the film is visible: The film is composed of differently densely packed agglomerates of nanoparticles that are interconnected but randomly interrupted by cracks. The film accommodates onto Nafion® according to the membrane’s morphology, which gives rise to thickness variations as well as roughness. As shown in Fig. 4c, the Pt film after in situ anodic polarization presents areas of less densely packed nanoparticles on both the Nafion®/Pt and Pt/H2O interfaces corroborating a hydration process of the interface upon OER.

a Reproduced from Ref. [12] with permission from the Royal Society of Chemistry. b, c Reproduced with permission from John Wiley and Sons Ltd. from Ref. [10]
a Scanning electron microscopy (SEM) image of a sputter-deposited Pt film on a Nafion® proton exchange membrane (PEM) recorded with an acceleration voltage of 1.5 kV showing the mud-crack type structure of the electrode material ensuring water permeability. b, c Transmission electron microscopy (TEM) images of the sputter-deposited Pt film of b a freshly prepared film and c a film after in situ experiments recorded with an acceleration voltage of 200 kV. The TEM images show that the film consists of interconnected nanoparticles randomly interrupted by cracks. After experiment, the nanoparticles are less densely packed revealing the hydration process of the interface during the oxygen evolution reaction.
The chemical composition of the surface and near-surface region of a freshly prepared Pt film determined by XPS measurements with a probing depth of 0.5 nm is approximately 10 at% O, 10 at% Pt, and 80 at% C. Hence, most of the Pt metal surface is covered with C originating from the sputter-coating procedure. Figure 5a shows that the analysis of surface-sensitive C 1s and O 1s spectra recorded during a preliminary sputtering experiment revealed the presence of C atoms in both sp2/sp3 configurations indicating the amorphous nature of the C deposit. Sputtering in a 10−4 mbar Ar/water atmosphere in the measurement chamber for approximately 15 min was effective to remove part of the C deposit. While sputtering for longer times (e.g. 53 min) lead to a further reduction of the carbon coverage and introduction of C–O species (components at 286.4 eV and 532.4 eV in the C 1s and O 1s (Fig. 5a), respectively), it compromised the integrity of the film: Parts of the film were found electrically disconnected by XPS. More bulk-sensitive survey spectra of the as-prepared film, after 15 min, and after 53 min of sputtering (Fig. 5b) revealed the appearance of F and S core levels originating from the Nafion® substrate. Exposure to air of the cleaned surface results in additional C deposition (Fig. 5a), hence ex situ cleaning would not be as effective. For this reason, before the in situ spectroscopic measurements, the film was sputter-cleaned for 20 min in a 10− 4 mbar Ar/water atmosphere in the measurement chamber to remove C deposits from the surface and to maximize the exposed Pt surface area without compromising the integrity of the film. Further, to attain a robust Pt structure–function correlation, cyclic voltammetry was performed until electron transfer waves typical of Pt electrodes occurred, before water electrolysis was investigated during CA.

a Normalized XPS C 1s spectra of a Pt film sputter-deposited on Nafion® measured in the two-electrode cell at open circuit potential (OCP) and 0.01 mbar as prepared, after 15 min, and after 53 min of sputter-cleaning (10−4 mbar Ar/water atmosphere with an acceleration voltage of 1.5 kV and a current of 20 mA), and after air exposure with a kinetic energy (KE) of the photoelectrons of 150 eV. The inset shows the respectively recorded normalized XPS O 1s spectra. The 15 min sputter-cleaning procedure already effectively reduces the C contamination of the surface. While the 53 min procedure further reduces the carbon contamination, it compromises the film integrity and some parts of the film were found electrically detached. Air exposure after the cleaning process results in additional carbon species. An ex situ cleaning procedure is therefore not suitable. b Respective XPS survey spectra of the as-prepared and the sputter-cleaned films. After 53 min of sputtering, the proton exchange membrane substrate F 1s and S 2p core levels become visible
The major limitations of this cell are: (a) the rapid consumption of water, which causes the loss of membrane ion conductivity as well as desiccation of the metal film and loss of electrical conductivity; (b) the current collector of the WE is a NiCr wire across the aperture of the lid, which is insulated from the electrode. Thus only that part of the sample in electric contact with the wire will be under the applied potential and therefore it is not possible to evaluate precisely the active surface area which can change with time; (c) gases evolved at the CE, in this case H2, but also left-over air bubbles from the membrane mounting process are trapped in the reservoir. These trapped gases exert a pressure on the membrane that soon causes (1) the metal film to break and (2) the H2 to transfer through the membrane as detected by the MS. Additionally, in a typical cyclic voltammogram (Fig. 6), we observe a potential shift of the faradaic processes typically occurring on Pt, more markedly for those cathodic and anodic processes that occur below 0 V versus the Pt quasi reference electrode. We have verified that, despite the acidic nature of the Nafion® membrane, the use of liquid water as electrolyte, as compared to the use of 0.5 M H2SO4, leads to a potential range at which the HER occurs that is consistent with the redox process in neutral pH conditions involving H2O molecules rather than hydronium species. We consider this as an effect of the slow proton transfer across the cell. The slow proton transfer leads to an accumulation of protons on the surface of the working electrode when functioning as oxygen-evolving catalyst and a depletion of protons with consequent increase of the pH when functioning as hydrogen-evolving catalyst, respectively. In addition, we have verified by using the sputtered Pt film with a standard bench scale electrochemical cell that, intrinsically, a two-electrode configuration leads to a broadening of the redox waves and a shift of their potentials if compared to the same cell in a three-electrode configuration. Therefore, the comparison of the potentials measured with our system to values reported in literature is not possible. Regardless, the online detection of the gases and the current density obtained are the most relevant experimental observables to evaluate a robust structure–function correlation.

Cyclic voltammogram (100 mV/s) obtained for a Pt80Pd20/Nafion®/Pt80Pd20 electrode assembly using the two-electrode cell at room temperature and with a water pressure in the chamber of approximately 0.01 mbar
Apart from the discontinuity in the use of the cell, which requires frequent refilling with water, this cell behaves in a very reproducible way. By monitoring the Fermi level shape and shift (expected to be close to the applied potential), the current measured by the potentiostat (approaching the mA range), and the composition of the gas phase, we were able to evaluate whether the collected data were meaningful or affected by any of the technical issues listed above. Note that the presence of F and S during the in situ experiments confirms that the active electrolyte/Pt/water interface is probed.
In the following, we will discuss three case studies, in which we employed the two-electrode cell to monitor oxygen-evolving electrode surfaces in situ by XPS and NEXAFS. In this respect, we will be responsive both to the possibilities the cell offers and the necessary precaution when beam exposure affects the materials’ chemistry. Despite its transient character and the pressure gap if compared to systems operating at atmospheric pressure, the instrumental development here reported has enabled us to cover unexplored conditions and thereby provide new insights into the OER.
Our first case discusses a bimetallic Pt/Pd (80/20) WE film sputtered on a Nafion® membrane and serves as showcase for the cell’s ability to investigate oxygen- and hydrogen-evolving electrodes in situ. A sputtered monometallic Pt film was used as CE. An XPS survey spectrum of the Pt/Pd WE is shown in Fig. 7 and confirms that besides carbon and oxygen, no other contaminants are present on the surface.

XPS survey spectrum of a bimetallic Pt/Pd (80/20) film sputter-deposited on a Nafion® proton exchange membrane measured with the two-electrode cell at open circuit potential and 0.01 mbar. The survey spectrum is exclusively composed of the core levels pertaining to the electrode materials, carbon, and oxygen
The binding energy shift of the spectra when the WE is positively polarized is illustrated in Fig. 8 by O 1s measurements at OCP and + 2 V and the corresponding Fermi edges. The spectra show that the positive polarization leads to a rigid shift of the spectra to higher binding energy. In addition, the shape and intensity of the O 1s spectrum change as response to the positive polarization of the electrode and the corresponding change in the type and concentration of present oxygen species. To be able to compare the measurements at different applied potentials, we used the measured Fermi energy to determine the actual binding energy of present species (BEactual = BEmeasured − FE).

XPS O 1s spectrum and corresponding Fermi edges (FE) of a bimetallic Pt/Pd (80/20) film sputter-deposited on a Nafion® proton exchange membrane measured with the two-electrode cell at 0.01 mbar at open circuit potential (OCP) and + 2 V versus Pt quasi reference electrode, respectively
In an earlier report, Arrigo et al. identified the nature of the Pt species formed on a Pt film upon OER in situ and unveiled their role in the reaction mechanism [10]. Therein, the authors show that the OER-active sputtered Pt film is characterized by (1) a metallic Pt0 component, (2) a component Ptδ+ due to metallic Pt electronically modified by subsurface O species (upshifted by 0.6 eV compared to Pt0), and (3) Pt2+ species (upshifted by 1.3 eV compared to Pt0). Upon the OER, the abundance of the Ptδ+ species on the surface increases significantly, Pt2+ species are only a minor component of the in situ electrochemically oxidized Pt film under ambient pressure of 0.1–0.01 mbar, and Pt4+ species are not observed. Arrigo et al. show that the not observed formation of Pt2+ or Pt4+ is neither related to a protection effect exerted by the C impurities nor to the possible reduction of Pt by beam induced water radiolysis. Rather, Ptδ+ species are the maximum oxidation states achieved under the O2 partial pressure used in this study. This observation strongly suggests that the formation of a stable oxide with Pt2+ species is not a necessary condition for the OER. In contrast, a clear correlation between OER activity and the abundance of Ptδ+ was found. This component is described as clusters of Pt oxide at the steps of the rough Pt surfaces [32], which are able to dissociate water and turn it into O2 when the critical potential is reached. Since similar Pt 4f dynamics have been observed for the PtPd system of the present work, they are not explicitly shown here. Indeed, in this contribution, we focus on the O speciation as this will allow us to describe more in detail the ambient conditions realized in these experiments.
In this respect, Fig. 9 shows the O 1s spectra recorded during polarization experiments of the Pt/Pd film at OCP; − 2 V (HER condition); and + 2 V (OER condition) versus Pt quasi RE. The O 1s spectra are fitted with four components that describe the major changes over time. Note that in these experiments, a positive potential is applied to the analyser cone to suppress the detection of gas-phase related photoelectron peaks.
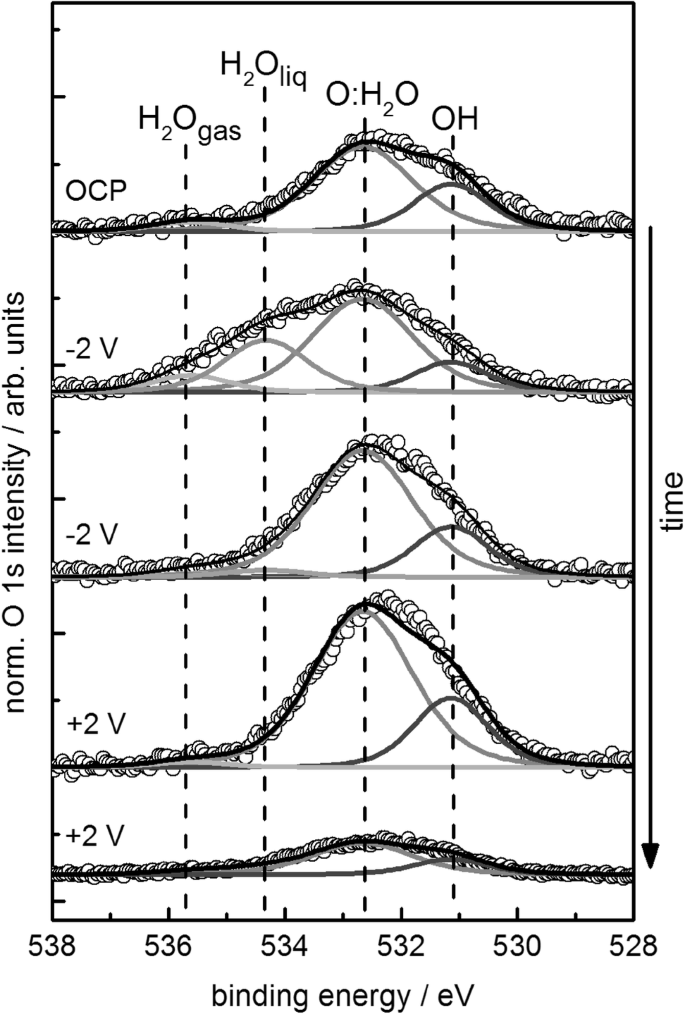
XPS O 1s spectra recorded with the two-electrode cell during polarization of the sputtered Pt/Pd 80/20 film WE at potentials as indicated (kinetic energy (KE) of photoelectrons: 150 eV, exit slit setting: 111 µm, pass energy: 15 eV). From top to bottom the measurement time of each spectrum is: open circuit potential (OCP) (5 min); − 2 V (17 min); − 2 V (47 min); + 2 V (58 min); + 2 V (98 min). The intensity of the Pd 3p3/2 signal expected at 535 eV is too low to be detected and was therefore neglected in the fitting
The O 1s spectrum of the film measured initially at OCP is described by two components: the lower binding energy component at 531.2 eV is attributed to single OH species whereas the higher binding energy component at 532.6 eV groups all the forms of dissociated and non-dissociated chemisorbed water such as single OH, OH–OH, O–H2O species adsorbed on Pt and Pd. Additionally, a small contribution from gas-phase water is visible even though the instrumental setting was adjusted to minimize this contribution. As the Pt film contains C impurities, C–O species may also contribute to the components at 531.2 eV and 532.6 eV [10]. Afterwards, we polarized the WE at − 2 V. To evaluate the stability of the oxygen species, we measured the O 1s region twice at an interval of 30 min. The first O 1s spectrum measured at − 2 V polarization of the WE, shows a broad peak, which requires an additional component at 534.4 eV as well as the gas-phase component at 535.7 eV. In the O 1s spectrum measured 30 min later at the same potential, however, these high binding energy components are reduced almost quantitatively. The appearance of the gas-phase signal at this potential indicates that the gas pressure is locally far above the background pressure of 0.01 mbar. The binding energy chemical shift of the component at 534.4 eV is consistent with liquid water [8, 33], which could be trapped within the pores of the metal film. Indeed, when a negative potential is applied, the transport of water is not only favoured by the pressure difference between the inner container and the evacuated chamber, but also by the applied potential, which induces the transport of H3O+ species towards the WE.
Upon application of a potential of + 2 V at the WE, the system evolves oxygen and the water transport is driven to the opposite direction. At + 2 V, the two components at 531.2 eV and at 532.6 eV, due to single OH species and chemisorbed water, respectively, increase similarly to the case of pure Pt reported earlier [10]. After 80 min of measurement, however, the pressure measured in the XPS chamber decreased dramatically (from approximately 0.01–0.001 to 0.00001 mbar), simultaneously the current dropped, indicating that the water inside the reservoir was fully consumed and the cell stopped to work. Consistently, the O 1s XP spectrum measured in this condition also shows a significant decrease of the overall oxygen species as a result of the limited water supply.
The elemental composition of the surface and near-surface region of the PtPd film during the in situ study as determined by XPS is reported in Table 1. The atomic ratios reveal still the enrichment of the surface with carbon albeit the sputter-cleaning pretreatment. Upon cathodic polarization, we observe an increase of the O abundance (O/Pt ratio increases) and a decrease of the Pt abundance (C/Pt ratio decreases). This observation indicates that O and H2O related species are accumulating preferentially on the Pt exposed surface. Interestingly, the Pd/Pt ratio also slightly decreases, which would suggest that O accumulates more on Pd than on Pt, consistent with the less noble character of the former. Likewise, under anodic polarization water accumulates further preferentially on Pt. When the water in the cell is completely consumed, the O/Pt ratio decreases significantly. Arrigo et al. discussed earlier [10] that the anodic polarization induces a small increase of the C–O species, however, this contribution is a minimal part. These results demonstrate that most of the accumulated O is related to the interaction of water on Pt and takes part in the OER. Indeed, the nature of the deposited carbon is amorphous/graphitic-like, thus of sufficient chemical resistance on the one hand. On the other hand, it may be beneficial for holding the nanoparticles together and guaranteeing electrical conductivity.
Similar dynamics involving the oxygen species as observed in the XPS O 1s spectra were identified by NEXAFS at the O K-edge. In this case, from OCP the film was first anodically polarized to + 1.2 V, + 2 V, and + 2.5 V versus CE quasi RE to induce the OER. Afterwards, the electrode was cathodically polarized to − 0.5 V and − 1.5 V to induce the HER. The O K-edge spectra in AEY (normalised to the edge jump) shown in Fig. 10a present resonances due to transitions from the O 1s core level to the O 2p–Pt 5d (Pd 4d) hybridized unoccupied orbitals. The first resonance (1s → π*) is found with a maximum at 531.6 eV, which is attributed to Pt–OH species [34]. The resonance at 534 eV could be ascribed to 1s → π* transitions from CO impurities bound to Pt [34]. The broad feature at 540 eV is due to transitions to the unoccupied σ* orbitals (1s → σ*) and is attributed to OH–OH scattering [34]. Upon application of an anodic potential, the intensity of the resonance due to OH species originally centred at 531.6 eV increases significantly and shifts slightly to lower energy (531.2 eV) reaching a maximum at + 2.5 V (Fig. 10a). At this potential, we expectedly also observe the highest OER rate throughout the experiment (not shown). The difference spectrum of the OCP and + 2.5 V measurements (see Fig. 10b) shows more clearly that several resonances contribute to this low excitation energy peak. Upon cathodic polarization (− 0.5 V), the intensity of the first resonance decreases again and shifts back to higher excitation energies. This trend is even more significant at more negative voltages (− 1.5 V) when H2 evolution is more pronounced. At this voltage, the spectrum overlaps with the spectrum at OCP in the 1s → π* region (see Fig. 10c), indicating a chemical reduction of the PtPd film. However, it appears evident that now the broad 1s → σ* resonance centred at around 540 eV is more intense. It was discussed in literature that an OH carpet might be formed via hydrogen bonding over the surface and, as a consequence, the resonance enhances due to the long-range ordering attained by the H-bond network [34]. Indeed, the difference spectrum of the OCP and − 1.5 V measurements reported in Fig. 10c shows features found for liquid water in AEY O K-edge NEXAFS spectra reported in literature (the pre edge at 535.4 eV, the edge at 540 eV) [34, 35].

O K-edge Auger electron yield (AEY) NEXAFS spectra recorded at 0.01 mbar with the two-electrode cell during polarization experiments of a PtPd 80/20 film sputtered on a Nafion® membrane a measurements were performed sequentially from bottom to top; b difference spectrum between + 2.5 V and OCP; c difference spectrum between − 1.5 V and OCP. OCP: open circuit potential, exit slit setting: 60 µm, pass energy: 100 eV
In our second case study using the two-electrode cell, we show that the presented cell is highly flexible and can be adapted to study electrocatalysts based on metal nanostructures supported on carbon. To demonstrate this flexibility, we prepared IrOx/C-based electrodes via electrodeposition [36]. To this aim, we used carbon paper as substrate onto which we electrodeposited Ir from a 5 mM IrCl3·3H2O + 0.5 M KCl solution. The working electrode was polarized at 0.55 V versus SCE until 2660 mC had been transferred, resulting in a mass loading of 0.5 mg/cm2. The electrodeposited Ir was subsequently oxidized by potential cycling with 100 mV/s between − 0.2 and + 1 V versus SCE in 0.1 M K2SO4. An SEM image of the as-synthetized electrode is reported in Fig. 11a. The image shows the surface of the carbon rods forming the carbon cloth onto which the Ir particles are deposited (bright spots). The so prepared electrode was physically placed on top of the Nafion® membrane without any hot-pressing step and studied in situ.

a SEM image of the electrodeposited Ir on carbon paper recorded with an acceleration voltage of 15 kV in backscattered electron mode. The bright spots correspond to the electrodeposited Ir phase supported on the carbon cloth. b Chronoamperometry signal recorded during electrode polarization at + 2 V in the two-electrode cell. An increase of the current is observed when the water pressure in the measurement chamber is raised from 0.0018 to 0.25 mbar by external water vapour dosage
The XPS results shown in Fig. 12 (survey) and 13 (core levels) indicate that the as-synthetized material is an Ir oxyhydroxide phase containing some Cl impurities. The broad Ir 4f peak (see Fig. 13d) with a full width at half maximum (FWHM) of 1.8 eV could be considered the convolution of a main component of Ir(IV) (Ir 4f7/2 BE = 61.7 eV) and an additional component of Ir (Ir 4f7/2 BE = 62.3 eV) [37, 38]. Despite changes in the ligands coordinated to the Ir oxyhydroxide clusters, the Ir 4f of the Ir oxyhydroxide presents negligible changes in the electronic structure upon polarization. A detailed study dedicated to Ir-based electrodes will be presented in the next section.

XPS survey spectrum of the as-prepared IrOOH film on C paper recorded in the two-electrode cell at open circuit potential at 0.01 mbar, exit slit setting: 111 µm, photon energy: 1200 eV, pass energy: 20 eV

XP spectra a O 1s; b C 1s; c Cl 2p; d Ir 4f of IrOOH electrodeposited on C recorded at open circuit potential (OCP) and during the oxygen evolution reaction (OER) at + 2 V at different water pressures. Due to the surface polarization and the application of 45 V at the cone of the electron analyser, the oxygen containing gas-phase components in the O 1s spectrum are broad and thus unresolved. As a rule of thumb, in order of increasing BE, the following gas-phase species are assumed present in close proximity to the sample surface: H2O, CO2, CO, O2 (kinetic energy (KE): 600 eV, beam line exit slit setting: 111 µm, analyser pass energy: 15 eV). Note that the higher local pressure in the last two measurements results in a decrease of the signal-to-noise ratio for the Ir 4f spectrum (light grey line)
Noteworthy in this experiment, due to the high resolution of chemical states enabled by this technique, it was possible to observe the corrosion the carbon support suffers upon application of an anodic potential: The C 1s peak intensity at higher BE than the graphitic component visibly increases (see Fig. 13b). This corrosion is a well-known limitation in the use of C-based electrodes for the OER. The absolute current obtained is low due to several factors: (1) the low loading of the active species, (2) the not intimate interaction between the solid electrolyte, (3) the electrode materials high resistance for the H+ transport, and (4) the low H2O pressure generated in the evacuated chamber by the water transport through the Nafion® membrane. However, the current’s response to the addition of 0.25 mbar H2O vapour pressure in the XPS chamber confirms the electrode activity (see Fig. 11b). Interestingly, the pores of the carbon support act as a trap for gas-phase H2O and O2 as well as possible C gaseous compounds resulting from the corrosion of the support as demonstrated by the gas-phase components appearing at higher binding energy in the O 1s spectra in these measurements (see Fig. 13a). When we compare the two O 1s spectra recorded at + 2 V in 0.25 mbar H2O atmosphere, we see that a small variation of the chemisorbed phase is accompanied by a significant evolution of species in the gas-phase. Note that the second O 1s spectrum is recorded immediately after the first one showing a dynamic switch from a prevailing C corrosion to OER (intensity increases at higher binding energy, corresponding to gas-phase oxygen evolution). This observation suggests that, in principle, OER catalysts could be optimized such to be used directly in selective hydrocarbon oxidation.
Our final showcase for the two-electrode cell presents how beam effects on the sample can complicate the measurement with this device. Earth-abundant transition metal oxides are currently under the spotlight of research to replace rare and expensive Ir-based electrocatalysts for the OER. This interest motivated us to investigate the suitability of this methodology for studying electrodeposited MnOx, which is characterized by a diverse OH−/O2− coordination chemistry as well as redox chemistry at reduction potentials of interest for the OER [39]. We again used carbon paper as substrate onto which we electrodeposited MnOx from a 20 mM KMnO4 solution following the procedure described by Zhao et al. [40]. The WE was polarized at − 0.85 V versus SCE until 510 mC had been transferred, resulting in a mass loading of 0.3 mg/cm2. An XPS survey spectrum of the as-prepared MnOx on carbon paper is shown in Fig. 14. The SEM image in Fig. 15a shows a carbon fibre of the cloth with part of its surface uncovered, revealing preferentially oriented carved lines, whereas the Mn deposit appears with dendrite-like (brighter region) morphology. However, some of the electrodeposited Mn is very thick (not shown) and not well in contact with the carbon surface. The inhomogeneity in the deposition of manganese can cause problems when studying the structure–function relation. The following obstacles inhibiting the electrochemical performance were observed in this experiment series: (1) beam damage [41, 42], (2) low conductivity; (3) wetting problems.

XPS survey spectrum of the as-prepared MnOx film on C paper recorded in the two-electrode cell at open circuit potential at 0.01 mbar, exit slit setting: 111 µm, photon energy: 1100 eV, pass energy: 20 eV

a SEM image of electrodeposited MnOx on carbon paper. b From top to bottom, Mn L-edge NEXAFS spectra recorded subsequently under the specified conditions of temperature and reactive atmosphere at a pressure of 0.25 mbar and reference spectra of Mn(II), Mn(II/III), Mn(III), and Mn(IV) oxides measured in UHV
A peculiarity of transition metal oxides is that their metal oxidation states generally can be more easily identified with NEXAFS than with XPS: The different oxides have clear fingerprint features in NEXAFS while their XPS core levels are more broadened by multiplet splitting and valence-shell recoupling in the core-excited state [31]. Therefore, we chose for the Mn case to concentrate on the Mn L-edges NEXAFS spectra to determine present Mn oxidation states. Since NEXAFS is slightly less surface sensitive than XPS, we thereby compromise some surface sensitivity but gain more chemical insight.
In Fig. 15b, the Mn L-edges NEXAFS spectra of this sample are compared to reference spectra for MnO (Mn(II)), Mn3O4 (Mn(II/III)), Mn2O3 (Mn(III)), and MnO2 (Mn(IV)) from commercially available manganese oxide powders after a required pretreatment (see Refs. [41, 43]). The freshly prepared sample is characterized by contributions from Mn(II), Mn(III) and Mn(IV) species (see Fig. 15b, UHV). However, we have observed instability of this material upon wetting in 0.25 mbar H2O and X-ray irradiation (Fig. 15b, H2O) as opposed to the electrodeposited IrOOH (Fig. 13). Its full re-oxidation was not possible in situ at 0.25 mbar O2 at 523 K, which can be concluded from the missing resonance at 644 eV characteristic for the presence of Mn(IV) (see spectra in O2 atmosphere in Fig. 15b). These findings differ from the results obtained for samples calcined ex situ in air at 393 K [44]. We attribute this effect to beam damage, which is even more pronounced when water vapour is present in the chamber.
XPS measurements of the Mn 2p core level at + 2 V polarization (not shown) indicated the expected shift of the peaks upon polarization, thus confirming that the sample was under the externally applied potential. The Mn L-edges NEXAFS spectra recorded for the fresh material at OCP and upon polarization under 10−5 mbar water pressure are reported in Fig. 16. A qualitative evaluation indicates that the electrodeposited material under OCP is already reduced and composed of mainly Mn(III) and Mn(II) species. Upon the application of + 2 V under low H2O pressure, only minor reduction due to radiation with X-rays is visible, which is probably due to the poor wetting of the surface under this condition. The changes are more drastic when 0.25 mbar H2O is added into the evacuated chamber resulting in a significant reduction to Mn(II).

Mn L edge spectra recorded during the in situ experiment for the electrodeposited Mn oxyhydroxide at: open circuit potential (OCP) and 10−5 mbar of H2O (black line); + 2 V and 10−5 mbar of H2O (grey line); + 2 V and 0.25 mbar H2O (light grey line). The potentials are referred to the Pt quasi reference CE
This result differs from recent published data on MnOx electrocatalysts performed in liquid environment, in which Mn(III)/Mn(IV) species were found during the OER [45, 46]. Thus, it is evident that in this case our in situ experiments were complicated: First, the measured spectra were highly affected by beam damage caused by the X-ray irradiation. Second, the poor wetting of the sample, which limits the water supply and the water turn over, inhibited the success of the in situ electrochemical experiments. Third, the poor conductivity of the electrodeposited samples might exacerbate the problem. This final showcase of the two-electrode setup shows the pitfalls of this in situ technique. Hence, controlling the experimental conditions and sample preparation are of paramount importance.
4 Three-Electrode Cell with Continuous Liquid Flow to Study the Oxygen Evolution Reaction [12]
Once the concept had been established that PEM-based electrode assemblies were leak-tight and sufficiently stable upon X-ray irradiation, we designed an in situ electrochemical cell with a continuous flow of electrolyte. The sustained electrolyte supply prevents the PEM from drying out, provides more stable measurement conditions, and renders longer measurement times possible. In addition, we modified the cell into a three-electrode system by integrating a micro reference electrode (RE) enabling direct comparison with bench electrochemical experiments.
The setup of the modified cell is shown in Fig. 17 by (a) a construction model and (b) a schematic cross section. In this configuration, the WE is again applied onto the membrane side facing the evacuated chamber for XPS and NEXAFS analysis. The CE (Pt coiled wire) and the RE (Ag/AgCl) are inserted from the side and rear parts of the cell, respectively, directly into the electrolyte stream and in close proximity to the Nafion® membrane. The electrodes connect to an external potentiostat that applies OER-relevant potentials while, simultaneously, XPS or NEXAFS are recorded.

b Reproduced from Ref. [12] with permission from the Royal Society of Chemistry
a Construction model and b schematic cross section of the homemade three-electrode in situ cell with sputtered WE, Pt wire CE and Ag/AgCl RE. For the assembly, all cell parts are fixed with the respective screws. The aqueous solution of the electrolyte is continuously supplied by means of an external syringe pump. The three-electrode cell has the same working principle as the two-electrode cell, described in detail in Fig. 3.
Pfeifer et al. used this in situ electrochemical cell to investigate the reactivity of sputter-deposited metallic Ir films in the OER [12]. In contrast to the electrodeposited IrOx on carbon paper investigated with the two-electrode cell, in which Ir was already initially oxidised, this study focused on the early stages of Ir oxidation during the OER and the oxygen ligands forming on a metallic iridium substrate. In this contribution, we would like to review some important findings reported in [12] that prepare the ground for discussing advantages and disadvantages of the two cells presented here.
First, we confirm the comparability of the electrochemical results obtained with this three-electrode in situ cell with wet bench electrochemical experiments. To this aim, we recorded CVs of sputtered Ir films in 0.1 M H2SO4, see Fig. 18. In the three-electrode setup, it is no longer possible to only fill the cell with ultra-pure Milli-Q water as we had done for the two-electrode setup. The three-electrode cell requires the use of a liquid electrolyte to ensure the flow of ions between the RE and CE and the WE.

Reproduced from Ref. [12] with permission from the Royal Society of Chemistry
Cyclic voltammogram of a sputter-deposited, 20 nm thick Ir electrode measured with the three-electrode in situ cell at 100 mV/s at 0.01 mbar in 0.1 M H2SO4.
Indeed, the shape and peak positions of the oxidation waves as well as the OER onset are in accordance with previous literature reports on Ir [47]; e.g. in the anodic scan, the main oxidation wave of the material occurs at approximately 1 V versus SHE and there is a small oxidation wave at 1.4 V versus SHE before the OER onset at 1.5 V versus SHE.
In a next step, we considered possible beam damage of the samples. In earlier literature on XPS studies of Ir oxides for the OER, the electrode materials were first treated wet electrochemically and afterwards transferred into vacuum for XPS characterization. Upon irradiation exposure, active Ir oxides samples were found irreversibly deactivated for OER [48]. To address the beam sensitivity of our samples, we measured under low X-ray dose (13 mA ring current) and minimized the beam exposure time of the probed region by choosing a new measurement spot for each set of measurement.
Finally, we determined the contribution of background signals to our measured spectra. Due to the maintained hydration of the film by the continuous supply of the electrolyte, the continuous flow cell suffers less from the problem of electrical disconnection of the films than the batch-like two-electrode approach. This improvement presented an opportunity to lower the metal film thickness down to 20 nm. The adjustment of the film thickness, however, has spectroscopic implications. On the one hand, due to the surface sensitivity of XPS and NEXAFS and the mud-crack type structure of the sputtered Ir films, thinner films ensure that a larger amount of the spectroscopically probed material is in touch with the triple-phase boundary between electrolyte, electrode, and water and is therefore actively taking part in the reaction. On the other hand, the thickness reduction leads to a strong spectral contribution of the core levels and absorption edges from sulphate groups and carbon compounds originating from the liquid electrolyte and the Nafion®. The presence of these additional signals makes the analysis of the O K-edge NEXAFS spectrum complicated since the oxygen signals originating from sulphur and metal (hydr)oxide compounds as well as water overlap. Thus, a controlled study of the nature of the species composing the O K-edge was necessary before we were able to discern the species involved in the activation of water and the OER at the metal surface from those belonging to Nafion® and the liquid electrolyte, respectively.
We initially investigated the O K-edge spectrum of a bare, uncoated Nafion® membrane mounted in the three-electrode cell with a continuous flow of 0.1 M H2SO4 (see Fig. 19). From this investigation, we assessed the major contributions to the O K-edge spectrum from the Nafion® “substrate” and the liquid electrolyte at excitation energies of ≈ 532 eV and ≈ 537 eV. The former stems most likely from 1s → π* (C=O) transitions from carboxyl groups present on the membrane surface or in the electrolyte [49]. The latter originates from a convolution of 1s → σ* (C=O and C–O) resonances of carboxyl groups [49] and ether groups of the Nafion® membrane as well as O → S transitions in sulphate species contained in the liquid electrolyte and the membrane itself [50, 51].

Figure adapted from Ref. [12] with permission from the Royal Society of Chemistry
O K-edge of an uncoated proton exchange membrane (Nafion® 117) measured with the three-electrode cell at open circuit potential (OCP) in Auger electron yield (AEY) at 0.01 mbar and with a continuous flow of 0.1 M H2SO4, beam line exit slit setting: 111 µm, kinetic energy: 385 eV, pass energy: 50 eV. Inset shows a zoom of the low excitation energy region recorded while the indicated OER-relevant potentials (vs. SHE) were applied.
From previous reference experiments of highly OER-active X-ray amorphous iridium oxides [37, 38], we knew that fingerprints of electrophilic OI− as well as of OII− species of iridium oxides are located in the O K-edge at 529 and 530 eV, respectively. Hence, we had to ensure that, upon polarization, the membrane/substrate contribution to the O K-edge spectrum does not change in this low excitation energy region. To this aim, we applied a range of OER-relevant potentials to the uncoated Nafion® and monitored its O K-edge. The inset in Fig. 19 confirms that upon polarization, the energy window of interest remains unaffected; hence we validated that changes in this low energy region observed during our in situ studies of iridium oxides can be attributed to changes in the active catalyst material itself.
After these preliminary robustness checks of the system, we performed in situ investigations of oxygen-evolving iridium surfaces on a sputter-deposited metallic iridium film with a thickness of approx. 20 nm. The film was first activated by 35 CV cycles between + 0.1 and + 1.6 V versus SHE, followed by transient experiments at OER-relevant potentials. Oxygen evolution was continuously monitored through the QMS unit connected to the NAP-XPS setup.
Figure 20 shows an XPS survey measurement of the as deposited Ir film on Nafion® mounted in the three-electrode cell at 0.01 mbar with a continuous flow of 0.1 M H2SO4. The survey only shows the core and Auger lines expected for the deposited Ir film (Ir) and the membrane (S, C, O, F). Please note that the Ir/C ratio is considerably larger than the Pt/C ratio observed above (compare Fig. 5). This observation shows that Ir is not as affected by carbon coverage during the deposition process as Pt. Therefore, in the case of Ir, we omitted the sputter-cleaning procedure.

Adapted from Ref. [12] with permission from the Royal Society of Chemistry
XPS survey spectrum of the as-prepared Ir film recorded in the three-electrode cell at open circuit potential at 0.01 mbar and with a continuous flow of 0.1 M H2SO4, beam line exit slit setting: 111 µm, photon energy: 1020 eV, pass energy: 20 eV.
While previous research on iridium had focused on the metal oxidation states [16, 52, 53], we were interested in the role of the oxygen ligands during the OER. To identify the oxygen ligands forming on oxygen-evolving iridium surfaces, we performed dedicated O K-edge NEXAFS investigations of the sample. Previous experiments had shown that the O K-edge region of iridium oxides is extremely sensitive to the presence of electrophilic OI− and OII− species [54]. Figure 21a shows the low excitation energy region of the in situ measured O K-edge at different applied potentials with fits using calculated spectra of OI− and OII− [37, 38]. We observe that during OER at + 1.7 V versus SHE indeed both electrophilic OI−, centered at 529 eV, and OII−, centered at 530 eV, are present. Especially for the electrophilic OI− species, we observe that the major contribution to the signal can be turned on and off by switching on and off the potential and, therewith, the OER. Hence, these species seem to be intimately linked to the OER activity of iridium oxides. The electrophilic nature and high reactivity of these species was previously confirmed by their ability to oxidize CO to CO2 at room temperature [54].

Adapted and reproduced from Ref. [12] with permission from the Royal Society of Chemistry
Low excitation energy regions of O K-edges of Ir-coated Nafion® samples, consecutively recorded a left to right and b bottom to top in the three-electrode cell with the indicated potentials versus SHE at 0.01 mbar and with a continuous flow of 0.1 M H2SO4, beam line exit slit setting: 111 µm, pass energy: 50 eV. c Normalized OI− and OII− concentrations determined from fit of low excitation energy region of O K-edge in b over QMS oxygen ion current.
To test for a structure–function correlation between the abundance of reactive OI− species and oxygen formation, we consecutively increased the potential applied to the iridium electrode and analysed both the low excitation energy region of the O K-edge and the amount of oxygen formed. Figure 21b shows the measured O K-edges and the fit envelopes obtained from fitting the low excitation energy region of the measured with the calculated spectra for OI− and OII−. Figure 21c shows the linear correlation between the amount of oxygen formed and the concentration of electrophilic OI− species. Noteworthy, while we were able to clearly follow the surface oxidation of the sample via the characteristic signals in the O K-edge NEXAFS, the Ir 4f spectra [12] hardly changed upon polarization showing that the bulk of the material remained mainly in its initial metallic state. These results indicate that the property making iridium oxides such unique OER catalysts is not their ability to form high valence cations, but their capacity to accommodate oxygen anions of formal oxidation state I-.
While a link between the presence of electrophilic OI− species and increased OER activity had already been suggested based on observations of reference measurements and CO titration [54], only by performing these in situ investigations of an iridium electrode during the OER, a direct structure–function relationship between the electrophilic OI− species and the OER could be established [12]. This achievement underlines the potential of this three-electrode in situ XPS and NEXAFS electrochemical cell to investigate energy conversion processes. This study has shed light onto the OER over IrOx catalysts, showing that not only a bulk oxide phase can activate H2O and turn it into O2, but also a predominantly Ir0 film with surface Ir oxide species can catalyse this reaction. This finding indicates the molecular or cluster-like character of the active Ir-O species.
5 Discussion
Providing a unified concept of the OER was attempted already early on by Trasatti [55]. Due to the increasing relevance of water electrolysis in energy research, this subject is currently being revisited with the aid of newly developed surface-sensitive in situ methodology. In our group, we aim to contribute to unveiling the reaction mechanism of the OER using a combination of surface-sensitive soft X-ray and electron-detection-based techniques. XPS is particularly useful for research in electrochemistry because it enables a contact-free probe of the electrochemical potential [6]. In principle, by looking at the core level shift and FWHM as functions of the potential, it is possible to describe the electrical double layer [33] and the modification the double layer undergoes as the potential is increased towards the intrinsic over-potential for the OER. This feature enables us to understand interfacial phenomena that lead to the high over-potential observed in all known active materials. However, the analysis of the XPS O 1s core level is often complicated due to the convolution of the different specifically chemisorbed oxygen species on the electrode surface (which are at the applied potential) and molecules of the solvent ions (which are at a different potential).
Recently, by analysing the broadening of the liquid water component in the O 1s spectrum, the potential profile across the electrical double layer and the diffuse layer have been described [33]. In our experiments, the film of liquid water is much thinner than in the experiments reported in [33], where the O 1s is dominated by the water component. Thus, we are more sensitive to specifically chemisorbed surface species on the electrode, which account for the catalytic properties of the electrode, but lack information about the electrolyte. Regardless, absorption spectroscopy at the O K-edge for the case of Pt (Fig. 10) has shown the presence of a thin layer of liquid water, which substantiates our findings. The quantitative analysis in Table 1 indicates that the dynamics of the oxygen species take place on the Pt surface and near-surface region. The surface chemistry scenario evidenced by our in situ study, however, was very different from the one seen over polycrystalline Pt foil after liquid electrolysis in H2SO4, [56] in which Pt2+ species and Pt4+ species dominated the topmost surface layer. Pioneering work [57, 58] postulated the formation of a PtO2 phase and its transition into instable PtO3 before OER takes place. Our in situ study, however, shows that the active state of Pt is indeed a Ptδ+ species stable under OER, whereas Pt2+ species are present in lower amount but also increasing in concentration with increasing anodic potentials. Ptδ+ is a metallic Pt species electronically modified by O atoms in the subsurface, which is described as clusters of Pt oxide at the steps of the rough Pt surfaces [32]. Ptδ+ is able to coordinate water and eventually turns it into O2. It appears evident that due to the low water chemical potential of our experiments, the surface is quenched in this Ptδ+ oxidation state while further oxidation is prevented.
The TEM analysis of a polycrystalline Pt film subjected to bulk water OER in H2SO4 has shown a peculiar characteristic of the electrode with a roughened surface of higher contrast on top of a bulky metallic Pt with cracks exposing new metallic surface [10]. A similarly roughened surface was observed on the TEM of the Pt electrode after our in situ experiments (see Fig. 4c). In both cases, the O 1s spectra do not show the typical O 1s fingerprint of Pt oxide at 529.6 eV, demonstrating the hydroxide character of the present Pt2+ and Pt4+ species. Together with our in situ study, this TEM analysis has enabled us to contribute a hypothesis on the reaction mechanism leading to the formation of the high valence Pt species earlier considered as OER active species [57, 58]. In liquid electrolytes upon anodization, the initial oxidation of Pt0 to Ptδ+ induces the mobilization of Pt at higher potential according to the equation previously reported [10]:
The Pt aquo complex undergoes condensation according to
The dimer in (2) can condense further to hydrous PtO or oxidize to [Pt2(O)2(H2O)4]4+ from which hydrous PtO2 and mixed valent oxides are formed. Such a mechanism explains also the formation of single atoms of Pt on carbon-supported electrodes during OER [59]. Those species might be intermediates in the OER, provided that electronically and coordinatively unsaturated sites are available and the material is electrically conductive. Otherwise, a passivating layer of higher valence states is formed and only the mechanical rupture of it will enable the exposure of further active surface [10]. Due to the low-pressure conditions realized in our experiments, we were able to quench the metastable Ptδ+ active phase while dissolution/precipitation processes were limited. Consistently, in recent experiments in liquid phase using tender X-ray photoelectron spectroscopy, the Ptδ+ species was also found on Pt electrodes in alkaline solution and discussed as the relevant species for OER on Pt [8].
Similarly, the reactivity of dry and hydrous Ir oxide-based electrodes has been attributed to the ability of Ir oxides to form instable high oxidation states upon water coordination that free O2 and recover the formal oxidation state [52]. In situ spectroscopic data have failed to confirm the existence of Ir(VI) states. Only Ir(III), Ir(IV), and Ir(V) were claimed to be present [16, 53, 60], but the chemical nature of the oxygen ligands had still not been clarified. This gap was filled by the in situ investigations using the three-electrode cell [12]. The detailed analysis of the O K-edge has provided insights into a likely reaction mechanism: electrophilic oxygen ligands are formed in situ upon polarization [12, 61] and will be attacked by nucleophilic OH species to form O2. The molecular nature of the intermediate species bearing O ligands able to turn H2O in O2 was evident. We also showed that the OER can occur on only slightly oxidized Ir metal surfaces and that it is not an exclusive ability of the bulk oxide. A recent publication has confirmed that also in liquid environments on an initially metallic Ir, the OER is enhanced upon formation of small, hydrated and hydroxylated, non-stoichiometric Ir–O particles at the triple-phase and grain boundaries [62].
The need for a careful conduction of experiments monitoring oxygen-evolving electrodes became obvious when investigating the iridium oxides: The evaluation of the onset of the electrophilic OI− species forming on Ir was only possible under low dose of X-ray beam due to their beam sensitivity. This limitation manifested itself when considering manganese oxides. Mn in the form of high surface area dendrite-like oxyhydroxide is even more difficult to investigate due to its high beam sensitivity. It will be shown in a follow up contribution that a low dose of X-ray and additional filters are needed to evaluate anodic process over Mn, which are otherwise covered by the reduction induced by ionized water and e−. The poor conductivity of the Mn(III/IV)OOH seems to lead to its reduction to Mn(II) under the effect of the beam and prevents its anodic oxidation.
We attempt here a hypothesis of a unified reaction concept for the OER on metallic electrodes: Upon polarization, OH chemisorbs on the electrode surface and the oxidation proceeds with increasing potential. The oxidation of metals is known to be diffusion-limited due to the poor flexibility of the metals to accommodate O atoms. Thus, as the electrode anodization proceeds, a surface O oversaturation might occur and a molecular metal species bearing an electrophilic oxygen ligand will form through a one-electron transfer mechanism. This species will then undergo a chemical step in which adjacent OH− attacks the electrophilic OI−, forming an intermediate species that decomposes to O2. If OII− is formed instead of OI−, a higher overpotential for the OER is required. The chemical nature of the nucleophilic attack of OH−, as opposed to the previous electrochemical step, would explain the linear trend observed in Fig. 21c. We thus conclude that the OER is kinetically favoured over the metal oxidation when the metal or metal oxide surface undergoes a transformation path that involves a metastable phase with a higher oxidation state of + 1 from the starting value.
When we now explicitly consider the OER in liquid electrolytes, apart from the metal surface and subsurface oxidation, also equilibria of hydrolysis, condensation, and precipitation, which depend on the pH and solubility constant, should be considered. The dissolution of surface metal ions can expose new phases and generate metastability (which could be beneficial for the O2 turn over). If the material dissolves further, an oversaturation of metal hydroxide species in close proximity to the electrode surface may lead to a condensation reaction and the formation of a precipitate of metal oxyhydroxide [63]. Depending on the nature of the oxyhydroxide layer, it can be detrimental for catalytic activity when it converts into a non-conductive oxide layer as in the case of Pt [54]. In the case of metallic Ir electrodes, however, the Ir oxyhydroxide is conductive and active. Li et al. [62] have recently observed that it enhances the activity of an initially metallic Ir electrode and is even more reactive but less stable than rutile-type IrO2. The authors go on and show that the process leading to a reduced OER activity on initially metallic iridium electrodes with time is in fact the crystallization of this metastable oxyhydroxide into bulk rutile-type IrO2.
The present work has shown that if Mn(III)OOH or any other earth-abundant material-based electrode should replace Ir-based catalysts, their design should be driven not only by chemical considerations based on the thermodynamic reduction potential, but also by mechanical/electrical considerations: The macroscopic assembly of the active site needs to be in intimate contact with a conductive support. Moreover, in both the Ir and Pt case, we have indicated that each metal atom undergoes monoelectronic transfers. This type of transfer appears to be a necessary condition for the OER and is probably necessary to form the electrophilic OI− species. In contrast, a 2 e− electron transfer to a metal atom leads to more strongly bound O species.
6 Conclusion
Herein, we have comprehensively described the technical development of two electrochemical cells to study water splitting materials by near ambient pressure X-ray photoelectron spectroscopy (NAP-XPS). The surface sensitivity of this technique and the broad range of available pressures enable us to investigate and identify the surface elemental composition and chemical state of most of the relevant elements in catalysis at varying conditions.
Our first prototype to study oxygen-evolving electrodes in situ was a batch-like two-electrode cell. Its transient character naturally induced perturbation to the system, which enabled us to identify the relevant redox processes and distinguish them from secondary reaction paths. While the results presented herein have shown the great potential of this cell to study the oxygen evolution reaction (OER), its design entailed several complications preventing investigation under steady state conditions, namely (1) limited water storage ability, (2) lack of reference electrode, (3) over-pressure in liquid reservoir due to gas evolution at counter electrode. These limitations motivated the further development of the cell architecture into a three-electrode flow cell, which provided a continuous electrolyte supply and eased the pressure exerted on the membrane from gases evolved at the counter electrode.
Using the two in situ cells at working pressures of 10−2–10−1 mbar, we were able to observe the initial activation processes of OER-active materials and achieved a high sensitivity towards the dynamics of chemisorbed species. Working in this, compared to atmospheric conditions, low pressure environment quenched the system in its initial active state. However, the limited wetting conditions prevented us to evaluate the impact of electrolytes and the equilibria in solution. Regardless, these cells have helped to contribute to the community the working oxidation state of anions and cations of the OER-active surface for Pt, considered as poorly active material for OER, and for IrOx, the state-of-the-art OER catalyst. These investigations have shown that the splitting in formal charges between anions and cations is much less than that anticipated in literature. For the case of Ir, the experiments demonstrated a ligand/anion-centred oxidation (formation of OI−) during the OER.
While the example of manganese has shown that beam-sensitive materials require specifically designed NAP-XPS experiments, the (1) high flexibility, (2) surface-sensitive detection mode with opportunity of depth profiling, and (3) comparative analysis by looking at different chemical entities taking part in the reaction mechanism make NAP-XPS incomparable to any other in situ technique. In fact, as seen in the Pt case, the opportunity to extend the pressure range may turn out to be very useful in identifying metastable phases normally not seen with other operando methodologies.
Finally, it appears evident from this report that the pressure range of these PEM-based in situ cells needs to be further enlarged toward higher pressures and to approach realistic operation conditions to further elucidate the role of the electrolyte. New lines of research must consider innovative ideas to entrap the water/electrolyte diffused through the Nafion® membrane and locally enable a liquid phase on the electrode. Further instrumental development should be devoted to controlling the thickness of the water layer.
References
Leitner W, Quadrelli EA, Schlögl R (2017) Harvesting renewable energy with chemistry. Green Chem 19:2307–2308
Schlögl R (2013) Chemical energy storage. DE GRUYTER, Berlin
Centi G, Perathoner S (2017) In: Chen W-Y, Suzuki T, Lackner M (eds) Handbook of climate change mitigation and adaptation. Springer, Cham
Salmeron M, Schlögl R (2008) Ambient pressure photoelectron spectroscopy: a new tool for surface science and nanotechnology. Surf Sci Rep 63:169–199
Hoster HE, Gasteiger HA (2010) Handbook of fuel cells. Wiley, New York
Zhang CJ, Grass ME, McDaniel AH, DeCaluwe SC, El Gabaly F, Liu Z, McCarty KF, Farrow RL, Linne MA, Hussain Z, Jackson GS, Bluhm H, Eichhorn BW (2010) Measuring fundamental properties in operating solid oxide electrochemical cells by using in situ X-ray photoelectron spectroscopy. Nat Mater 9:944–949
Axnanda S, Crumlin EJ, Mao B, Rani S, Chang R, Karlsson PG, Edwards MOM, Lundqvist M, Moberg R, Ross P, Hussain Z, Liu Z (2015) Using “tender” X-ray ambient pressure X-Ray photoelectron spectroscopy as a direct probe of solid-liquid interface. Sci Rep 5:9788
Favaro M, Valero-Vidal C, Eichhorn J, Toma FM, Ross PN, Yano J, Liu Z, Crumlin EJ (2017) Elucidating the alkaline oxygen evolution reaction mechanism on platinum. J Mater Chem A 5:11634–11643
Han Y, Axnanda S, Crumlin EJ, Chang R, Mao B, Hussain Z, Ross PN, Li Y, Liu Z (2018) Observing the electrochemical oxidation of Co metal at the solid/liquid interface using ambient pressure X-ray photoelectron spectroscopy. J Phys Chem B 122:666–671
Arrigo R, Hävecker M, Schuster ME, Ranjan C, Stotz E, Knop-Gericke A, Schlögl R (2013) In situ study of the gas-phase electrolysis of water on platinum by NAP-XPS. Angew Chem Int Ed 52:11660–11664
Law YT, Zafeiratos S, Neophytides SG, Orfanidi A, Costa D, Dintzer T, Arrigo R, Knop-Gericke A, Schlögl R, Savinova ER (2015) In situ investigation of dissociation and migration phenomena at the Pt/electrolyte interface of an electrochemical cell. Chem Sci 6:5635–5642
Pfeifer V, Jones TE, Velasco Velez JJ, Arrigo R, Piccinin S, Hävecker M, Knop-Gericke A, Schlögl R (2017) In situ observation of reactive oxygen species forming on oxygen-evolving iridium surfaces. Chem Sci 8:2143–2149
Velasco-Velez JJ, Pfeifer V, Hävecker M, Weatherup RS, Arrigo R, Chuang C-H, Stotz E, Weinberg G, Salmeron M, Schlögl R, Knop-Gericke A (2015) Photoelectron spectroscopy at the graphene–liquid interface reveals the electronic structure of an electrodeposited cobalt/graphene electrocatalyst. Angew Chem Int Ed 54:14554–14558
Knop-Gericke A, Pfeifer V, Velasco-Velez JJ, Jones T, Arrigo R, Hävecker M, Schlögl R (2017) In situ X-ray photoelectron spectroscopy of electrochemically active solid-gas and solid-liquid interfaces. J Electron Spectrosc Relat Phenom 221:10–17
Mierwaldt D, Mildner S, Arrigo R, Knop-Gericke A, Franke E, Blumenstein A, Hoffmann J, Jooss C (2014) In situ XANES/XPS investigation of doped manganese perovskite catalysts. Catalysts 4:129
Sanchez Casalongue HG, Ng ML, Kaya S, Friebel D, Ogasawara H, Nilsson A (2014) In situ observation of surface species on iridium oxide nanoparticles during the oxygen evolution reaction. Angew Chem Int Ed 126:7297–7300
Sanchez Casalongue HG, Kaya S, Viswanathan V, Miller DJ, Friebel D, Hansen HA, Norskov JK, Nilsson A, Ogasawara H (2013) Direct observation of the oxygenated species during oxygen reduction on a platinum fuel cell cathode. Nat Commun 4:2817
Cavalca F, Ferragut R, Aghion S, Eilert A, Diaz-Morales O, Liu C, Koh AL, Hansen TW, Pettersson LGM, Nilsson A (2017) Nature and distribution of stable subsurface oxygen in copper electrodes during electrochemical CO2 reduction. J Phys Chem C 121:25003–25009
Papaefthimiou V, Shishkin M, Niakolas DK, Athanasiou M, Law YT, Arrigo R, Teschner D, Hävecker M, Knop-Gericke A, Schlögl R, Ziegler T, Neophytides SG, Zafeiratos S (2013) Solid oxide fuel cells: on the active surface state of nickel-ceria solid oxide fuel cell anodes during methane electrooxidation. Adv Energy Mater 3:690–690
Toghan A, Arrigo R, Knop-Gericke A, Imbihl R (2012) Ambient pressure X-ray photoelectron spectroscopy during electrochemical promotion of ethylene oxidation over a bimetallic Pt–Ag/YSZ catalyst. J Catal 296:99–109
Kolmakov A, Dikin DA, Cote LJ, Huang JX, Abyaneh MK, Amati M, Gregoratti L, Gunther S, Kiskinova M (2011) Graphene oxide windows for in situ environmental cell photoelectron spectroscopy. Nat Nanotechnol 6:651–657
Masuda T, Yoshikawa H, Noguchi H, Kawasaki T, Kobata M, Kobayashi K, Uosaki K (2013) In situ X-ray photoelectron spectroscopy for electrochemical reactions in ordinary solvents. Appl Phys Lett 103:111605
Takagi Y, Wang H, Uemura Y, Nakamura T, Yu L, Sekizawa O, Uruga T, Tada M, Samjeske G, Iwasawa Y, Yokoyama T (2017) In situ study of oxidation states of platinum nanoparticles on a polymer electrolyte fuel cell electrode by near ambient pressure hard X-ray photoelectron spectroscopy. Phys Chem Chem Phys 19:6013–6021
Brown MA, Bossa GV, May S (2015) Emergence of a stern layer from the incorporation of hydration interactions into the Gouy–Chapman model of the electrical double layer. Langmuir 31:11477–11483
Carmo M, Fritz DL, Mergel J, Stolten D (2013) A comprehensive review on PEM water electrolysis. Int J Hydrogen Energy 38:4901–4934
Grot WG (1994) Perfluorinated ion exchange polymers and their use in research and industry. Macromol Symp 82:161–172
Heitner-Wirguin C (1996) Recent advances in perfluorinated ionomer membranes: structure, properties and applications. J Memb Sci 120:1–33
Söhn M (2010) Kohenstoff-Nanoröhrchen als Elektrodenmaterial für PEM-Brennstoffzellen. Dissertation, TU Darmstadt, Darmstadt
Knop-Gericke A, Kleimenov E, Hävecker M, Blume R, Teschner D, Zafeiratos S, Schlögl R, Bukhtiyarov VI, Kaichev VV, Prosvirin IP, Nizovskii AI, Bluhm H, Barinov A, Dudin P, Kiskinova M (2009) In: Bruce CG, Helmut K (eds) Advances in catalysis. Academic Press, Waltham
Hävecker M, Cavalleri M, Herbert R, Follath R, Knop-Gericke A, Hess C, Hermann K, Schlögl R (2009) Methodology for the structural characterisation of VxOy species supported on silica under reaction conditions by means of in situ O K-edge X-ray absorption spectroscopy. Phys Status Solidi B 246:1459–1469
DeGroot F, Kotani A (2008) Core level spectroscopy of solids. CRC Press, Boca Raton
Zhu Z, Tao F, Zheng F, Chang R, Li Y, Heinke L, Liu Z, Salmeron M, Somorjai GA (2012) Formation of nanometer-sized surface platinum oxide clusters on a stepped Pt(557) single crystal surface induced by oxygen: a high-pressure STM and ambient-pressure XPS study. Nano Lett 12:1491–1497
Favaro M, Jeong B, Ross PN, Yano J, Hussain Z, Liu Z, Crumlin EJ (2016) Unravelling the electrochemical double layer by direct probing of the solid/liquid interface. Nat Commun 7:12695
Nagasaka M, Nakai I, Kondoh H, Ohta T, Carravetta V (2003) Oxygen K-edge near edge X-ray absorption fine structures of O and OH overlayers on Pt(111). Chem Phys Lett 375:419–424
Bluhm H, Ogletree DF, Fadley CS, Hussain Z, Salmeron M (2002) The premelting of ice studied with photoelectron spectroscopy. J Phys Cond Matter 14:L227
Le Vot S, Roué L, Bélanger D (2012) Electrodeposition of iridium onto glassy carbon and platinum electrodes. Electrochim Acta 59:49–56
Pfeifer V, Jones TE, Velasco Vélez JJ, Massué C, Greiner MT, Arrigo R, Teschner D, Girgsdies F, Scherzer M, Allan J, Hashagen M, Weinberg G, Piccinin S, Hävecker M, Knop-Gericke A, Schlögl R (2016) The electronic structure of iridium oxide electrodes active in water splitting. Phys Chem Chem Phys 18:2292–2296
Pfeifer V, Jones TE, Velasco Vélez JJ, Massué C, Arrigo R, Teschner D, Girgsdies F, Scherzer M, Greiner MT, Allan J, Hashagen M, Weinberg G, Piccinin S, Hävecker M, Knop-Gericke A, Schlögl R (2016) The electronic structure of iridium and its oxides. Surf Interface Anal 48:261–273
Armstrong FA (2008) Why did Nature choose manganese to make oxygen? Philos Trans R Soc Lond B 363:1263–1270
Zhao D, Yang Z, Zhang L, Feng X, Zhang Y (2011) Electrodeposited manganese oxide on nickel foam–supported carbon nanotubes for electrode of supercapacitors. Electrochem Solid-State Lett 14:A93–A96
Sulzmann F, Jones TE, Knop-Gericke A, Schlögl R, Skorupska K (2019) in preparation
van Schooneveld MM, DeBeer S (2015) A close look at dose: toward L-edge XAS spectral uniformity, dose quantification and prediction of metal ion photoreduction. J Electron Spectrosc Relat Phenom 198:31–56
Mette K, Bergmann A, Tessonnier J-P, Hävecker M, Yao L, Ressler T, Schlögl R, Strasser P, Behrens M (2012) Nanostructured manganese oxide supported on carbon nanotubes for electrocatalytic water splitting. ChemCatChem 4:851–862
Khan M, Xiao J, Zhou F, Yablonskikh M, MacFarlane DR, Spiccia L, Aziz EF (2015) On the origin of the improvement of electrodeposited MnOx films in water oxidation catalysis induced by heat treatment. ChemSusChem 8:1980–1985
Fuller FD, Gul S, Chatterjee R, Burgie ES, Young ID, Lebrette H, Srinivas V, Brewster AS, Michels-Clark T, Clinger JA, Andi B, Ibrahim M, Pastor E, de Lichtenberg C, Hussein R, Pollock CJ, Zhang M, Stan CA, Kroll T, Fransson T, Weninger C, Kubin M, Aller P, Lassalle L, Bräuer P, Miller MD, Amin M, Koroidov S, Roessler CG, Allaire M, Sierra RG, Docker PT, Glownia JM, Nelson S, Koglin JE, Zhu D, Chollet M, Song S, Lemke H, Liang M, Sokaras D, Alonso-Mori R, Zouni A, Messinger J, Bergmann U, Boal AK, Bollinger JM Jr, Krebs C, Högbom M, Phillips GN Jr, Vierstra RD, Sauter NK, Orville AM, Kern J, Yachandra VK, Yano J (2017) Drop-on-demand sample delivery for studying biocatalysts in action at X-ray free-electron lasers. Nat Methods 14:443
Risch M, Stoerzinger KA, Han B, Regier TZ, Peak D, Sayed SY, Wei C, Xu Z, Shao-Horn Y (2017) Redox processes of manganese oxide in catalyzing oxygen evolution and reduction: an in situ soft X-ray absorption spectroscopy study. J Phys Chem C 121:17682–17692
Capon A, Parsons R (1972) Effect of strong acid on reactions of hydrogen and oxygen on noble-metals: study using cyclic voltammetry and a new teflon electrode holder. J Electroanal Chem 39:275–286
Burke LD, Scannell RA (1988) The effect of UV-light on the hydrous oxides of iridium. J Electroanal Chem 257:101–121
Outka DA, Stöhr J, Madix RJ, Rotermund HH, Hermsmeier B, Solomon J (1987) NEXAFS studies of complex alcohols and carboxylic acids on the Si(111)(7 × 7) surface. Surf Sci 185:53–74
Rodriguez JA, Jirsak T, Freitag A, Hanson JC, Larese JZ, Chaturvedi S (1999) Interaction of SO2 with CeO2 and Cu/CeO2 catalysts: photoemission, XANES and TPD studies. Catal Lett 62:113–119
Chaturvedi S, Rodriguez JA, Brito JL (1998) Characterization of pure and sulfided NiMoO4 catalysts using synchrotron-based X-ray absorption spectroscopy (XAS) and temperature-programmed reduction (TPR). Catal Lett 51:85–93
Kötz R, Neff H, Stucki S (1984) Anodic iridium oxide films: XPS-studies of oxidation state changes and O2-evolution. J Electrochem Soc 131:72–77
Minguzzi A, Lugaresi O, Achilli E, Locatelli C, Vertova A, Ghigna P, Rondinini S (2104) Observing the oxidation state turnover in heterogeneous iridium-based water oxidation catalysts. Chem Sci 5:3591–3597
Pfeifer V, Jones TE, Wrabetz S, Massué C, Velasco Vélez JJ, Arrigo R, Scherzer M, Piccinin S, Hävecker M, Knop-Gericke A, Schlögl R (2016) Reactive oxygen species in iridium-based OER catalysts. Chem Sci 7:6791–6795
Trasatti S (1984) Electrocatalysis in the anodic evolution of oxygen and chlorine. Electrochim Acta 29:1503–1512
Johnson B, Ranjan C, Greiner MT, Arrigo R, Schuster ME, Höpfner B, Gorgoi M, Lauermann I, Willinger MG, Knop-Gericke A, Schlögl R (2016) ChemSusChem 9:1634
Reddy AKN, Genshaw M, Bockris JO (1964) Ellipsometric study of oxygen-containing films on platinum electrodes. J Electroanal Chem 8:406
Churchill CR, Hibbert DB (1982) Kinetics of the electrochemical evolution of isotopically enriched gases. Part 1: 18O16O evolution on platinum in acid and alkaline solution. J Chem Soc Faraday Trans 178:2937–2945
Schlögl R, Kudrenko E, Willinger MG, Yi Y, Arrigo R, Schüth F (2013) Pt nanoparticles as electrocatalysts for water splitting: atomistic insights into functions and stability. Microsc Microanal 19:1444–1445
Cherevko S, Geiger S, Kasian O, Mingers A, Mayrhofer KJJ (2016) Oxygen evolution activity and stability of iridium in acidic media. Part 2: electrochemically grown hydrous iridium oxide. J Electroanal Chem 774:102–110
Saveleva VA, Wang L, Teschner D, Jones TE, Gago AS, Friedrich KA, Zafeiratos S, Schlögl R, Savinova ER (2018) Operando evidence for a universal oxygen evolution mechanism on thermal and electrochemical iridium oxides. J Phys Chem Lett 9:3154–3160
Li T, Kasian O, Cherevko S, Zhang S, Geiger S, Scheu C, Felfer P, Raabe D, Gault B, Mayrhofer KJJ (2018) Atomic-scale insights into surface species of electrocatalysts in three dimensions. Nat Catal 1:300–305
Binninger T, Mohamed R, Waltar K, Fabbri E, Levecque P, Kötz R, Schmidt TJ (2015) Thermodynamic explanations of the universal correlation between oxygen evolution activity and corrosion of oxide catalysts. Sci Rep 5:12167
Acknowledgements
The authors gratefully acknowledge Prof. Georg Held for discussion on fitting the Mn spectra, Gisela Weinberg for SEM images, Dr. Travis E. Jones for the calculated OI− and OII− spectra for the iridium oxides, and Frederic Sulzmann for manganese reference NEXAFS spectra. The authors acknowledge BESSY II/HZB for granting beam time under the proposal #15202526. This work was further supported by the Ministry of Education and Science of the Russian Federation (RFMEFI61614 × 0007) and the Bundesministerium für Bildung und Forschung (05K14EWA) through the joint Russian-German research project “SYnchrotron and NEutron STudies for Energy Storage” (SYNESTESia). In addition, the Bundesministerium für Bildung und Forschung funded the project through the MANGAN cluster project Nr. 8.1 NKBF 98.
Author information
Authors and Affiliations
Corresponding authors
Rights and permissions
Open Access This article is distributed under the terms of the Creative Commons Attribution 4.0 International License (http://creativecommons.org/licenses/by/4.0/), which permits unrestricted use, distribution, and reproduction in any medium, provided you give appropriate credit to the original author(s) and the source, provide a link to the Creative Commons license, and indicate if changes were made.
About this article

Cite this article
Streibel, V., Hävecker, M., Yi, Y. et al. In Situ Electrochemical Cells to Study the Oxygen Evolution Reaction by Near Ambient Pressure X-ray Photoelectron Spectroscopy. Top Catal 61, 2064–2084 (2018). https://doi.org/10.1007/s11244-018-1061-8
Published:
Issue Date:
DOI: https://doi.org/10.1007/s11244-018-1061-8