
Abstract
Here we present an analysis protocol for dynamic contrast enhanced magnetic resonance imaging (DCE-MRI) data of the kidneys. It covers comprehensive steps to facilitate signal to contrast agent concentration mapping via T1 mapping and the calculation of renal perfusion and filtration parametric maps using model-free approaches, model free analysis using deconvolution, the Toft’s model and a Bayesian approach.
This chapter is based upon work from the COST Action PARENCHIMA, a community-driven network funded by the European Cooperation in Science and Technology (COST) program of the European Union, which aims to improve the reproducibility and standardization of renal MRI biomarkers. This analysis protocol chapter is complemented by two separate chapters describing the basic concept and experimental procedure.
You have full access to this open access chapter, Download protocol PDF
Key words
- Magnetic resonance imaging (MRI)
- Dynamic contrast enhanced (DCE )
- Contrast agent
- Kidney
- Mice
- Rats
- Deconvolution
- Toft’s model
- T1 mapping
- Perfusion
- Filtration
1 Introduction
Contrast enhanced imaging is based on the use of endogenous tracers (or contrast agents) with para- or ferromagnetic properties and was proposed in the mid-1980s. The aim was to measure or derive the tissue perfusion and capillary permeability from the signal changes caused by the tracer. Based on the employed imaging technique, this concept is called dynamic susceptibility contrast (DSC) or dynamic contrast-enhanced (DCE) MRI whereby the first is used in conjunction with T2-weighted imaging techniques whereas the latter is used in T1-weighted imaging. During such DCE-MRI exams a signal time curve (STC) is recorded that reflects the passage of the tracer through tissue and therefore also the perfusion and filtration of the renal tissue. To analyze the tracer kinetics and the STC various approaches were proposed comprising semiquantitative, model-free, and model based approaches which will be outlined in this chapter [1,2,3,4,5,6].
Theoretical considerations and acquisition protocols are detailed in the chapters by Pedersen M et al. “Dynamic Contrast Enhancement (DCE) MRI–Derived Renal Perfusion and Filtration: Basic Concepts” and by Irrera P et al. “Dynamic Contrast Enhanced (DCE) MRI-Derived Renal Perfusion and Filtration: Experimental Protocol.”
A typical workflow for analyzing DCE-MRI data and for calculating parametric maps of renal perfusion and filtration comprises the segmentation of the kidney and the delineation of the arterial input function (AIF), calculation of T1 maps to convert voxel-wise STCs to concentration time curves (CTC), model selection, and eventually the calculation of perfusion and filtration parameters [7,8,9,10]. There are several existing software packages that can calculate renal perfusion and filtration from a dynamic contrast enhanced MRI scan. However, none of the packages provide a complete solution so that the user has to select the package(s) that fit(s) his needs most.
This analysis protocol chapter is complemented by two separate chapters describing the basic concept and experimental procedure, which are part of this book.
This chapter is part of the book Pohlmann A, Niendorf T (eds) (2020) Preclinical MRI of the Kidney—Methods and Protocols. Springer, New York.
2 Materials
2.1 Software Requirements
The methods described in this chapter require the following software tools:
-
1.
A recent version of the DICOM workstation OsiriX (www.pixmeo.com) or Horos (https://horosproject.org/).
-
2.
UMMPerfusion Plugin version 1.5.3 (http://www.opossumm.de/redmine/projects/ummperfusion).
-
3.
Bayesian Data-Analysis Toolbox (a working manual of the entire Bayesian Data-Analysis Toolbox, including server- and client-side installation and operation instructions, descriptions and operating instructions for software packages and an overview of Bayesian Probability Theory can be found at: http://bayes.wustl.edu/Manual/BayesManual.pdf). Information on server-side and client-side configurations may be found below in Notes 1 and 2.
2.2 Source Data: Format Requirements and Quality Check
2.2.1 Input Requirements
To analyze preclinical data with UMMPerfusion, the image data need to be converted into DICOM prior to the analysis [11, 12]. It is recommended to convert DICOM to NIFTI first, then use the NIFTI images for all processing within ROCKETSHIP [13]. Data can be imported into DCE @ur-Lab from DICOM format, Bruker Biospin MRI data format (http://www.bruker.com/products/mr/mri.html), as well as from binary unformatted data [14]. MITK-model fit can import various data formats like DICOM or NIFTI [15].
2.2.2 Prequality Check
Visual inspection is required to check that all slices are aligned as time advances. Slices with clear motion artifacts should be removed. More robustly, data with slight movements can be recovered by coregistration images to suitable baseline image(s).
3 Methods
3.1 Segmentation
For the calculation of whole kidney GFR it is necessary to segment the kidneys and to determine their volume .
3.2 T1 Mapping
According to the software chosen for performing the analysis the series of images acquired may be converted to a convenient format (e.g., DICOM).
The calculations should be performed only on the pixels obtained from renal segmentation (see Subheading 3.1).
More detailed descriptions of T1 mapping calculations are described in the chapter by Garteiser P et al. “Analysis Protocols for MRI Mapping of Renal T1.”
3.2.1 VTR Analysis
For the analysis of the VTR images a pixel-by-pixel fitting procedure is used to fit the intensities of every renal pixel in the images as a function of TR against the following signal equation
where TR is the repetition time, A is a bias intensity, and S0 is the intensity once reached a plateau.
For every pixel a T1 value can be obtained according to the fitting of Eq. 1 (an example of T1 map fitting within the Bruker Paravision® software is shown in Fig. 1).

T1 map fitting under the VTR scheme performed within the Bruker Paravision 5.1® software for a selected ROI
3.2.2 VFA Analysis
For the analysis of the VFA images a pixel by pixel fitting procedure is used to fit the intensities of every renal pixel in the images as a function of FA against the following signal equation
where FA is the flip angle, TR is the repetition time, A is a bias intensity and S0 is the intensity reached a plateau.
For every pixel a T1 value can be obtained according to the fitting of Eq. 2.
3.3 Model Selection and Quantification
Several methods for DCE-MRI analysis have been proposed, with different mathematical representation of physiologic system interpretation through kinetic modeling [1]. Due to the large number of these methods and models, herein we describe only those that are mostly used and that can be easily exploited due to the availability of free software for these analyses. Among them we will consider deconvolution approaches (see Subheading 3.4) and extended Toft’s model (see Subheading 3.5). In addition, a description on how to select the best model based on Bayesian approaches according to the acquired data is also provided (see Subheading 3.6).
3.4 Deconvolution Approach
The following steps are based on the UMMPerfusion plugin [12] and the DICOM workstation OsiriX.
-
1.
Open the dataset in the Osirix 4D-viewer (see Note 3):
-
2.
OsiriX will check if the data selected are a 4D data set (3D spatial plus 1D temporal), however, sometimes this internal check fails. Therefore, an intermediate step might be necessary to load the data into the UMMPerfusion plugin. To do so, select the series in the database window. Press the Alt-Key and click the 2D-viewer’s icon at the same time. A window will open. Select/click on the 4D-viewer button, the series will appear within the 4D viewer, although it was not designed for it initially.
-
3.
Start the plugin via the Osirix plugin menu (see Fig. 2):
Plugins → image filter → UMMPerfusion
-
4.
Select algorithm from the tool bar (see Fig. 3).
-
5.
Place a ROI on a clearly visible artery in order to receive an arterial input function.
-
6.
For ensuring correct results all algorithms require an arterial input function (AIF). This function is defined by using the Osirix ROI-tool and by placing/designating a “region of interest” (ROI ) on the abdominal artery. An oval is used as a standard, however all ROI-tools offered by Osirix are supported by UMMPerfusion.
-
7.
Upon placing a ROI , a chart will appear on the right-hand side of the plugin window, depicting the arterial input function. The aif-color corresponds to the current ROI border color, whereas the vertical line, the base line will always be in red. When a ROI is created, it will be attached to the popup-menu. If several ROIs have been created within this dataset, the desired ROI has to be assigned to its determined position. If only one pixel shall be the source of the AIF, the ROI-Brush- Tool with the size of 1px is to be used in order to specify the smallest ROI possible (Fig. 4).
-
8.
Make sure that the desired ROI is selected in the popup menu called “Arterial.”
-
9.
A good ROI selection can be recognized by a large peak on the chart to the right of the plugin-window.
-
10.
Drag the baseline to a desired position or simply enter the value in the respective text field.
-
11.
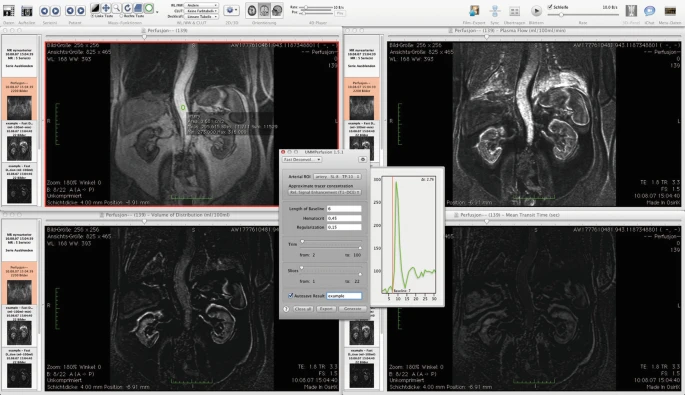
The length of baseline represents the number of images during a certain period of time that are used for signal normalization. For attaining correct results, the baseline should be chosen in a way that the tracer is not yet visible at that point of time. The easiest way to set the baseline is to drag the baseline with the mouse to its desired timeframe in the AIF-chart. The value can alternatively be inserted into the baseline textfield (see Note 4, and Fig. 5).
-
12.
Set limits to the relevant scope by using the trim-sliders if necessary.
-
13.
Before hitting the generate-button, there is the opportunity to activate the autosave-checkbox to automatically save the results and to generate a report.
-
14.
The calculation begins after using the generate-button.
-
15.
As a result, three new views/viewers are created in which the calculated data are presented. Each viewer shows one parametric map calculated by the deconvolution approach: blood flow (perfusion) in ml/100 ml/min, the blood volume (ml/100 ml) and the mean transit time (s) (Fig. 6).
-
16.
If the autosave function has not been activated before using the generate button, it is still possible to save the results as well as the report after the calculation. In this case, use the export button next to the generate-button.
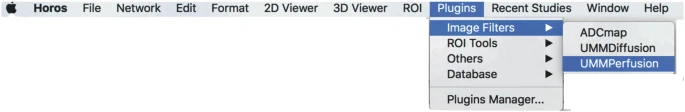
Selecting the UMMPerfusion plugin from the plugin menu of OsiriX
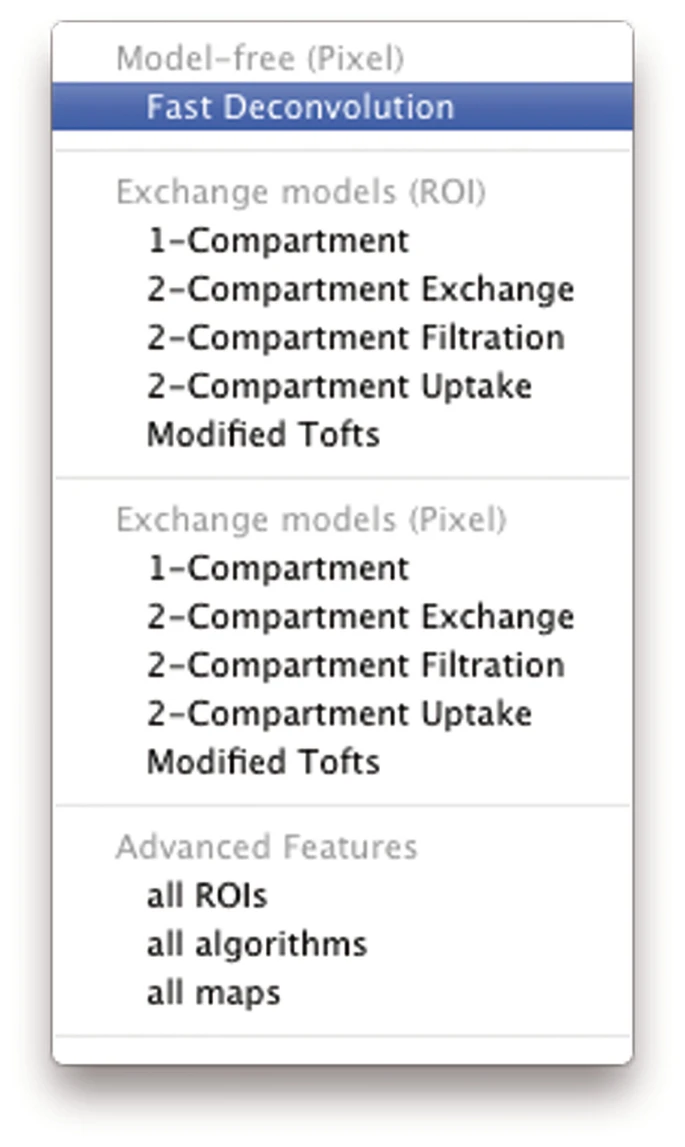
UMMperfusion drop down menu to select a perfusion model
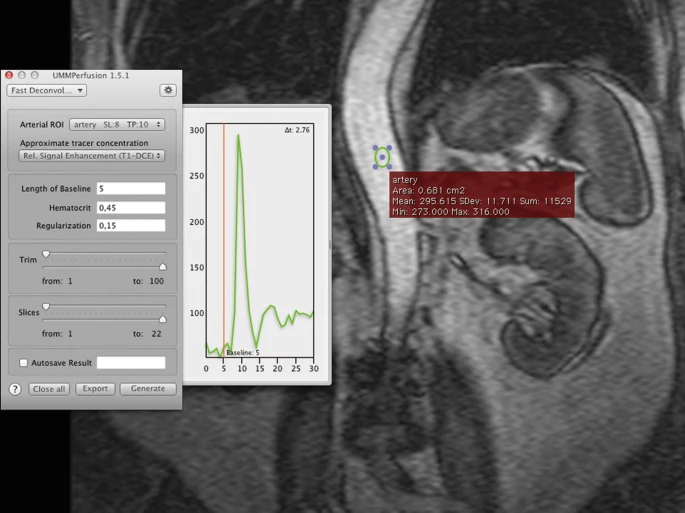
Example of placing a ROI to select the AIF. The AIF is displayed as a chart next to the plugin

Selection of the baseline
Example of the result of the deconvolution model implemented in UMMPerfusion. Besides the original DCE-MRI data (top left), three additional viewers are opened presenting parametric maps of blood flow, blood volume, and mean transit time
3.5 Toft’s Model
Three open source packages for renal perfusion and filtration quantification implement the Toft’s model, namely, UMMPerfusion [12], ROCKETSHIP [13], MITK-model fit [15], and DCE @ur-LAB [14]. In the following, the processing steps are given for UMMPerfusion; however, the other three tools can be used in exchange. For details on using them please refer to the respective documentation.
-
1.
Open the dataset in the Osirix 4D-viewer.
-
2.
Start the plugin via the Osirix plugin menu:
Plugins → image filter → UMMPerfusion.
-
3.
Select algorithm from the tool bar.
UMMperfusion implements the extended Toft’s model. It can be calculated either ROI-based (see Note 5) or pixel-wise. The latter is described in the following.
-
4.
Place a ROI on a clearly visible artery in order to receive an arterial input function. The recommended shape of the ROI is oval.
Please see Subheading 3.4 for more details.
-
5.
Place a rectangular ROI on the relevant tissue. When using the pixel-based compartment model algorithms, only a rectangular ROI shape is supported at the moment by UMMPerfusion.
-
6.
The pixelwise calculation might require some time to calculate. To save time, the ROI should be accurately fitting around the tissue that is to be analyzed (see Fig. 7).
-
7.
The arterial-ROI and the tissue-ROI do not have to be on the same slice.
-
8.
Make sure that the desired arterial-ROI is selected in the popup menu called “Arterial.”
-
9.
Make sure that the desired tissue-ROI is selected in the popup menu called “Tissue.”
-
10.
Select the tracer approximation, baseline, and spatiotemporal trimming of the data as described in Subheading 3.4.
-
11.
The calculation begins after using the generate-button. A new window will appear, in which the desired viewers (parametric maps) can be chosen.
-
12.
Upon approval with the OK button the selected viewers will appear and show the specified area (see Fig. 8).
-
13.
If the autosave function has not been activated before using the generate button, it is still possible to save the results, as well as the report. In that case, use the export button next to the generate-button. The dataset’s name will be appended on your specified name.

Example of rectangular ROI placed tight around the kidney. Within this ROI, a voxel-wise fit of the Toft’s model is performed, all pixels outside the ROI are not considered

Example of different parametric maps calculated by the Toft’s model. Based on the ROI drawn around the kidney, only voxels within this ROI are used during model fit. Voxels outside the ROI are not taken into account
3.6 Bayesian Model Selection
3.6.1 Analyzing Regions of Interest Data Using the Enter ASCII Model Package
From the client-side Java interface:
-
1.
Select the “enter ASCII Model” option under the “Package” menu.
-
2.
Load your signal model.
-
Your own signal model can be loaded using the “User” button (links to the client-side .../Bayes/BayesAsciiModels folder, where you should store you model and parameter files).
-
A prepackaged “System” model can be loaded using the “System” button (links to Server-side models).
-
-
3.
Load ASCII data using widgets.
-
File → Load ASII → File.
-
Data file must be in ASCII format.
-
Data are typically in 2-column ASCII format (abscissa, ordinate), however, the software package allows both multicolumn abscissas and ordinates.
-
-
4.
Build your model using the “Build” button.
-
5.
OPTIONAL: If you believe that your data contains outliers, you can check the “Find Outliers” option under “Analysis Options.”
-
6.
Under the “Prior Viewer” tab, review your user-defined prior probability distributions and parameter ranges.
-
7.
If you have multiple servers running the Bayesian Data-Analysis Toolbox, select the desired server for processing the analysis using the “Select” button.
-
8.
OPTIONAL: You can check the status of the selected server using the “Status” button.
-
9.
Run the analysis using the “Run” button.
-
10.
You can monitor the status of the analysis using the Status button or the button bearing a picture of an eye at the bottom left of the window.
-
11.
Once the analysis is complete, retrieve the results using the “Get Job” button or the job will be automatically retrieved when the job status is checked and the job is completed.
3.6.2 Model Selection and Analysis of Region of Interest Data Using the Enter ASCII Model Selection Package
From the client-side Java interface:
-
1.
Select the “enter ASCII Model Selection” option under the “Package” menu.
-
2.
Load all of the signal models that you would like to compare.
-
Your own signal models can be loaded using the “User” button (links to the client-side ../Bayes/BayesAsciiModels folder, where a model and parameter files are stored).
-
Prepackaged “System” models can be loaded using the “System” button (links to Server-side models).
-
-
3.
Load your data.
-
File → Load ASII → File.
-
Data file must be in ASCII format.
-
Data are typically in 2-column ASCII format (abscissa, ordinate), however, the software package allows for multicolumn data and abscissaes (See the Bayesian Data-Analysis Toolbox manual, Appendix A for details).
-
-
4.
Build your models using the “Build” button.
-
5.
OPTIONAL: If you believe that your data contain outliers, you can check the “Find Outliers” option under “Analysis Options.”
-
6.
Under the “Fortran/C Model Viewer” → “Parameters” tabs, review your user-defined prior probability distributions.
-
7.
If you have multiple servers running the Bayesian Data-Analysis Toolbox, select desired server for processing the analysis using the “Select” button.
-
8.
OPTIONAL: You can check the status of the selected server using the “Status” button.
-
9.
Run the analysis using the “Run” button.
-
10.
You can monitor the status of the analysis with the Button bearing a picture of an eye at the bottom left of the window, or using the status button.
-
11.
Once the analysis is complete, retrieve the results using the “Get Job” button. The job is automatically retrieved when the job status is checked and the job is completed.
3.7 Voxel-Wise Image Analysis
3.7.1 Analyzing Image Data Using the Analyze Image Pixels Package
From the client-side Java interface:
-
1.
Select the “Analyze Image Pixels” option under the “Package” menu.
-
2.
Load your signal model.
-
Your own signal model can be loaded using the “User” button (links to the client-side ../Bayes/BayesAsciiModels folder, where you should store you model and parameter files).
-
A prepackaged “System” model can be loaded using the “System” button (links to Server-side models).
-
-
3.
Load your data.
-
File → Load Image.
-
Select the file format of your data.
-
-
4.
Load an abscissa file (your vector specifying the time at which data were collected, b-values, echo times, etc.).
-
5.
Set the noise standard deviation of the data.
-
An acceptable approximation of the noise standard deviation for this purpose would be to draw an ROI in a region of no signal of an image and input the RMS value of this ROI . Tools to make this measurement are available in the main window once data have been loaded—Do not use the standard deviation of the data.
-
-
6.
Compile your signal model using the “Build” button.
-
7.
OPTIONAL: If you believe that your data contains outliers, you can check the “Find Outliers” option under “Analysis Options.”
-
8.
OPTIONAL: If you want a much faster analysis, you can select the “Max Probability” option. The option comes at the cost of only returning the max probability parameter value. No posterior probability distribution information is available if you use this option.
-
9.
Under the “Prior Viewer” tab, review the prior probability distributions.
-
10.
If you have multiple servers running the Bayesian Data-Analysis Toolbox, select desired server for processing the analysis using the “Select” button.
-
11.
OPTIONAL: You can check the status of the selected server using the “Status” button.
-
12.
Run the analysis using the “Run” button.
-
13.
You can monitor the status of the analysis with the status button or the button bearing a picture of an eye at the bottom left of the window.
-
14.
Once the analysis is complete, retrieve the results using the “Get Job” button. The job is automatically retrieved when the job status is checked and the job is completed.
3.7.2 Model Selection and Analysis of Image Data Using the Image Model Selection Package
From the client-side Java interface:
-
1.
Select the “Analyze Image Pixels” option under the “Package” menu.
-
2.
Load all of the signal models that you would like to compare.
-
Your own signal models can be loaded using the “User” button (links to the client-side ../Bayes/BayesAsciiModels folder, where you should store you model and parameter files).
-
Prepackaged “System” models can be loaded using the “System” button (links to Server-side models).
-
-
3.
Load your data.
-
File → Load Image.
-
Select the file format of your images.
-
-
4.
Load an abscissa file (your vector specifying the time at which data were collected, b-values, echo times, etc.).
-
5.
Set the noise standard deviation of the data.
-
An acceptable approximation of the noise standard deviation for this purpose would be to draw an ROI in a region of no signal of an image and input the RMS value of this ROI . Tools to make this measurement are available in the main window once data have been loaded.
-
-
6.
Build your signal models using the “Build” button.
-
7.
Under the “Fortran/C Model Viewer” → “Parameters” tabs, review your user-defined prior probability distributions.
-
8.
If you have multiple servers running the Bayesian Data-Analysis Toolbox, select desired server for processing the analysis using the “Select” button.
-
9.
OPTIONAL: You can check the status of the selected server using the “Status” button.
-
10.
Run the analysis using the “Run” button.
-
11.
You can monitor the status of the analysis using the status button, or with the Button bearing a picture of an eye at the bottom left of the window.
-
12.
Once the analysis is complete, retrieve the results using the “Get Job” button. The job is automatically retrieved when the job status is checked and the job is completed.
3.8 Results Validation
3.8.1 Evaluation of Analysis Errors and Variability Using Synthetic Data
UMMPerfusion has been in-house certified by the authors and comes with a set of simulated data to test the technical validity of the algorithms. Also, the other software packages provide example data for testing. The Bayesian Data-Analysis Toolbox provides an estimation of uncertainty, even for a single measurement and it has been validated with simulated data for which ground truth is known [4].
3.8.2 Comparison with Reference Values from the Literature
Table 1 surveys reference values from the literature for renal blood flow in small rodents. Please note that these values might vary versus those obtained by the reader following this chapter due to different AIF selection and acquisition parameters.
4 Notes
-
1.
Recommended server configuration and server-side installation of the Bayesian Data-Analysis Toolbox: Multicore LinuxPC (32 or 64 cores); 32- or 64-bit processor; Operating system: Linux (CentOS 4.7 or higher) or Sun Solaris 9 or 10; Installing Fortran and C is strongly recommended (required to build and analyze data with your own signal model). Server-side installation instruction can be found at: http://bayesiananalysis.wustl.edu/install.html.
-
2.
Recommended client-side configuration for the Bayesian Data-Analysis Toolbox: any operating system that can run Java 6 or higher. Note that the client machine only runs a Java graphical user interface that the sends and receives jobs from the server-side Bayesian Data-Analysis Toolbox. Through this interface, data can be loaded and visualized, mathematical models can be written in Fortran and tested, jobs can be sent to the server-side software for analysis, and completed jobs can be retrieved from the server-side Bayesian Data-Analysis Toolbox and visualized.
-
3.
If T1-mapping is available, please convert signal intensities to concentrations beforehand and save this back into DICOM files.
-
4.
If concentration time curves are used, please select the option “Signal enhancement.”
-
5.
For examples to perform ROI based analysis with UMMperfusion please see http://www.opossumm.de/redmine/projects/ummperfusion/wiki/Tutorials__How_to_.
References
Sourbron SP, Buckley DL (2013) Classic models for dynamic contrast-enhanced MRI. NMR Biomed 26(8):1004–1027. https://doi.org/10.1002/nbm.2940
Sourbron S, Dujardin M, Makkat S, Luypaert R (2007) Pixel-by-pixel deconvolution of bolus-tracking data: optimization and implementation. Phys Med Biol 52(2):429–447. https://doi.org/10.1088/0031-9155/52/2/009
Duan C, Kallehauge JF, Bretthorst GL, Tanderup K, Ackerman JJ, Garbow JR (2017) Are complex DCE-MRI models supported by clinical data? Magn Reson Med 77(3):1329–1339. https://doi.org/10.1002/mrm.26189
Beeman SC, Osei-Owusu P, Duan C, Engelbach J, Bretthorst GL, Ackerman JJH, Blumer KJ, Garbow JR (2015) Renal DCE-MRI model selection using Bayesian Probability Theory. Tomography 1(1):61–68. https://doi.org/10.18383/j.tom.2015.00133
Sourbron SP, Michaely HJ, Reiser MF, Schoenberg SO (2008) MRI-measurement of perfusion and glomerular filtration in the human kidney with a separable compartment model. Investig Radiol 43(1):40–48. https://doi.org/10.1097/RLI.0b013e31815597c5
Baumann D, Rudin M (2000) Quantitative assessment of rat kidney function by measuring the clearance of the contrast agent Gd(DOTA) using dynamic MRI. Magn Reson Imaging 18(5):587–595
Eikefjord E, Andersen E, Hodneland E, Hanson EA, Sourbron S, Svarstad E, Lundervold A, Rørvik JT (2017) Dynamic contrast-enhanced MRI measurement of renal function in healthy participants. Acta Radiol 58(6):748–757. https://doi.org/10.1177/0284185116666417
Ebrahimi B, Textor SC, Lerman LO (2014) Renal relevant radiology: renal functional magnetic resonance imaging. Clin J Am Soc Nephrol. https://doi.org/10.2215/CJN.02900313
Sourbron SPMH, Reiser MF, Schoenberg SO (2008) MRI-measurement of perfusion and glomerular filtration in the human kidney with a separable compartment model. Invest Radiol 43(1):40–48
Buckley DL, Shurrab AE, Cheung CM, Jones AP, Mamtora H, Kalra PA (2006) Measurement of single kidney function using dynamic contrast-enhanced MRI: comparison of two models in human subjects. J Magn Reson Imaging 24(5):1117–1123. https://doi.org/10.1002/jmri.20699
Zollner FG, Daab M, Sourbron SP, Schad LR, Schoenberg SO, Weisser G (2016) An open source software for analysis of dynamic contrast enhanced magnetic resonance images: UMMPerfusion revisited. BMC Med Imaging 16:7. https://doi.org/10.1186/s12880-016-0109-0
Zollner FG, Weisser G, Reich M, Kaiser S, Schoenberg SO, Sourbron SP, Schad LR (2013) UMMPerfusion: an open source software tool towards quantitative MRI perfusion analysis in clinical routine. J Digit Imaging 26(2):344–352. https://doi.org/10.1007/s10278-012-9510-6
Barnes SR, Ng TS, Santa-Maria N, Montagne A, Zlokovic BV, Jacobs RE (2015) ROCKETSHIP: a flexible and modular software tool for the planning, processing and analysis of dynamic MRI studies. BMC Med Imaging 15:19. https://doi.org/10.1186/s12880-015-0062-3
Ortuno JE, Ledesma-Carbayo MJ, Simoes RV, Candiota AP, Arus C, Santos A (2013) DCE@urLAB: a dynamic contrast-enhanced MRI pharmacokinetic analysis tool for preclinical data. BMC Bioinformatics 14:316. https://doi.org/10.1186/1471-2105-14-316
Debus C, Floca R, Ingrisch M, Kompan I, Maier-Hein K, Abdollahi A, Nolden M (2019) MITK-ModelFit: a generic open-source framework for model fits and their exploration in medical imaging - design, implementation and application on the example of DCE-MRI. BMC Bioinformatics 20(1):31. https://doi.org/10.1186/s12859-018-2588-1
Zimmer F, Zollner FG, Hoeger S, Klotz S, Tsagogiorgas C, Kramer BK, Schad LR (2013) Quantitative renal perfusion measurements in a rat model of acute kidney injury at 3T: testing inter- and intramethodical significance of ASL and DCE-MRI. PLoS One 8(1). https://doi.org/10.1371/journal.pone.0053849
Sadick M, Schock D, Kraenzlin B, Gretz N, Schoenberg SO, Michaely HJ (2009) Morphologic and dynamic renal imaging with assessment of glomerular filtration rate in a pcy-mouse model using a clinical 3.0 Tesla scanner. Investig Radiol 44(8):469–475. https://doi.org/10.1097/RLI.0b013e3181a8afa1
Oostendorp M, de Vries EE, Slenter JM, Peutz-Kootstra CJ, Snoeijs MG, Post MJ, van Heurn LW, Backes WH (2011) MRI of renal oxygenation and function after normothermic ischemia-reperfusion injury. NMR Biomed 24(2):194–200. https://doi.org/10.1002/nbm.1572
Acknowledgments
The Italian Ministry for Education and Research (MIUR) is gratefully acknowledged for yearly FOE funding to the Euro-BioImaging Multi-Modal Molecular Imaging Italian Node (MMMI).
This chapter is based upon work from COST Action PARENCHIMA, supported by European Cooperation in Science and Technology (COST). COST (www.cost.eu) is a funding agency for research and innovation networks. COST Actions help connect research initiatives across Europe and enable scientists to enrich their ideas by sharing them with their peers. This boosts their research, career, and innovation.
PARENCHIMA (renalmri.org) is a community-driven Action in the COST program of the European Union, which unites more than 200 experts in renal MRI from 30 countries with the aim to improve the reproducibility and standardization of renal MRI biomarkers.
Author information
Authors and Affiliations
Corresponding author
Editor information
Editors and Affiliations
Rights and permissions
Open Access This chapter is licensed under the terms of the Creative Commons Attribution 4.0 International License (http://creativecommons.org/licenses/by/4.0/), which permits use, sharing, adaptation, distribution and reproduction in any medium or format, as long as you give appropriate credit to the original author(s) and the source, provide a link to the Creative Commons license and indicate if changes were made.
The images or other third party material in this chapter are included in the chapter's Creative Commons license, unless indicated otherwise in a credit line to the material. If material is not included in the chapter's Creative Commons license and your intended use is not permitted by statutory regulation or exceeds the permitted use, you will need to obtain permission directly from the copyright holder.
Copyright information
© 2021 The Author(s)
About this protocol

Cite this protocol
Zöllner, F.G. et al. (2021). Analysis Protocol for Dynamic Contrast Enhanced (DCE) MRI of Renal Perfusion and Filtration. In: Pohlmann, A., Niendorf, T. (eds) Preclinical MRI of the Kidney. Methods in Molecular Biology, vol 2216. Humana, New York, NY. https://doi.org/10.1007/978-1-0716-0978-1_38
Download citation
DOI: https://doi.org/10.1007/978-1-0716-0978-1_38
Published:
Publisher Name: Humana, New York, NY
Print ISBN: 978-1-0716-0977-4
Online ISBN: 978-1-0716-0978-1
eBook Packages: Springer Protocols